 Open Access Article
Creative Commons Attribution 3.0 Unported Licence
The role of sp2/sp3 hybrid carbon regulation in the nonlinear optical properties of graphene oxide materials†
Shuai Wanga,
Yongli Dong ab,
Chunying He*a,
Yachen Gaoa,
Nan Jiaa,
Zhimin Chen
 a and
Weina Song
 *ab
*ab
aKey Laboratory of Functional Inorganic Material Chemistry, Ministry of Education, School of Chemistry and Materials Science, Heilongjiang University, Harbin 150080, PR China. E-mail: chunyinghe_hlju@163.com; weinasong@163.com; Fax: +86 451 86673647; Tel: +86 451 88609145
bCollege of Environmental and Chemical Engineering, Heilongjiang University of Science and Technology, Harbin 150022, PR China
First published on 22nd November 2017
Abstract
Rational regulation of localized sp2/sp3 hybrid carbon structure in graphene oxide systems plays a very important role in developing advanced carbon-based hybrid materials. Here, we report a simple ethanol solvothermal method toward precise control of the growth of the sp2 hybrid carbon configurations/clusters in the sp3 carbon matrix so as to regulate the structure of electronic energy bands in the graphene oxide system. The results of morphology observation, XPS, solid-state 13C MAS NMR, FT-IR and Raman spectroscopy proved that controllable generation of the sp2 hybrid carbon configurations/clusters can be achieved based on an executive oxidation/reduction strategy. Upon excitation by a 532 nm laser with 4 ns pulses, the obtained reduced graphene oxide (160-rGO-6) with a large number of sp2 hybrid carbon configurations displays greater nonlinear reverse saturable absorption response and a higher nonlinear absorption coefficient β of 560 cm GW−1 than graphene oxide with different oxidation degree (GO-X, X = 6, 8, 10 and 12), and reduced graphene oxide with relatively few sp2 hybrid carbon configuration ratios (Y-rGO-6, Y = 80, 100, 120, 140 and 180). The significantly enhanced nonlinear reverse saturable absorption of 160-rGO-6 is attributed to the two photon absorption and excited state absorption originating from the sp2 hybrid carbon configuration system.
1. Introduction
Nonlinear optical (NLO) materials have been extensively studied for their potential applications in a lot of fields such as optical limiting, optical communications and optical data recording, etc.1–3 Among all the NLO applications, optical limiting is one of the most promising practical applications in the protection of delicate optical instruments and human eyes against damage by high intensity laser beams. A promising optical limiter should strongly absorb or refract intense, potentially dangerous laser light, while exhibiting high transmittance for low-intensity ambient levels.4 Many efforts have been devoted to research into ideal broadband optical limiting materials with different NLO mechanisms by means of covalent bonding or multiple plane π–π interactions.Graphene is an atomically thin two-dimensional carbon material which consists of sp2-hybridized carbon atoms. It has received tremendous interest in many scientific fields. More particularly, from the study of its singular photonics and electronics, graphene has captured interest for its NLO properties.5 But the challenges faced in optical limiting applications of graphene based materials are the absence of bandgap, the solubility and the difficulty to manufacture graphene on large scales. These have hindered graphene to be a promising NLO material. However, graphene oxide (GO), the most well known graphene derivative, can solve above-mentioned questions very well. Moreover, GO possesses some characteristics of graphene due to the presence of pristine graphitic nanoislands, which make GO also hold obvious NLO properties. As NLO material, the most striking characteristics of GO compared to graphene is that electronic band structure can be tuned over a wide range by regulating the amount of oxygen-containing groups.6 The quantity of oxygen functional groups can be adjusted by reduction or oxidation procedure. The electronic band structure of GO and reduced graphene oxide (rGO) directly depend on the oxidation and the reduction procedure. Furthermore, the NLO properties of material is often related to their electronic band gap.7 Xiao et al. reported the third-order nonlinear responses of GO as a tunable platform of hybrid carbon structure. The results indicated that the tunability of ratio of the sp3 and sp2 fractions is a powerful strategy to tune its bandgap.8 Liu and co-workers found that sp2-hybridized domains dominated saturable absorption and the sp3-hybridized domains displayed the two photon absorption.9 Up to now, GO-based materials are still being investigated to improve their optical limiting performance for the practical application. In order to meet this challenge, much more perspicuous and systemic studies on the relationships between the degree of oxidation or reduction of GO and the optical limiting behaviors need to be paid more attention. Furthermore, our group have investigated the NLO properties of GO/rGO covalently functionalized with phthalocyanine. The researching results indicate that the structure of phthalocyanine molecule and GO can improve NLO performance of the hybrid materials.10–13 Especially, the oxidation and reduction degree of GO shows great effect on the NLO properties of hybrid materials. The reduced graphene oxide covalently functionalized phthalocyanine hybrid material presented significantly increased nonlinear absorption coefficient β than GO/phthalocyanine hybrid. It indicates that structure manipulation of sp2 and sp3 hybrid carbon within GO nanosheets maybe a powerful way to enhance the NLO properties.
Encouraged by these considerations, in this work, the role of the regulations of the sp2/sp3 carbon structure in the NLO properties of GO were studied in details. Special attentions are paid on the regulation of the sp2 carbon configuration/cluster structure and nonlinear optical properties of graphene oxide and reduced graphene oxide samples. The 160-rGO-6 with numerous sp2 carbon configuration generated under certain ethanol solvothermal conditions, exhibits stronger RSA response and higher nonlinear absorption coefficient than those of the GO and rGO samples, which is attributed to coexisted two photon absorption and the excited state absorption inducing from sp2 carbon configurations upon excitation by a high intensity laser pulse.
2. Experimental section
2.1 Materials
Flake graphite was obtained from nanjing XFNANO materials Tech Co., Ltd. KMnO4, NaNO3, H2O2 and HCl were purchased from Kermel Chemical Reagent Co., Ltd. De-ionized (DI) water was used in all experiments.2.2 Synthesis of graphene oxide (GO)
Graphene oxide (GO) was prepared by the modified Hummers method.14 Briefly, graphite powder (2 g), sodium nitrate (1 g) and concentrated sulfuric acid (50 mL) were first added into a 500 mL flask at room temperature. The system was simultaneously stirred in an ice bath. Potassium permanganate with certain amount (6 g, 8 g, 10 g and 12 g) was added gradually to above solution with mechanical stirring. Then the stirring was continued for 1.5 h at 0 °C and 2 h at 40 °C. Followed by addition of de-ionized (DI) water (100 mL) to the mixture, the temperature was raised to 80 °C and maintained for 10 min. Subsequently, DI water (250 mL) and hydrogen peroxide (30 wt%) were added into the mixture to terminate the reaction, respectively. Finally, the bright yellow suspension was centrifuged and washed with 10% HCl solvent for six times. The resulting suspension was further purified by re-dispersing in DI water and dialyzing until the pH value of the solution surpassed 6. The yellow brown colloid was dried under vacuum at 30 °C for 48 hours. According to the added amount of potassium permanganate, obtained graphite oxide are denoted as GO-6, GO-8, GO-10 and GO-12, respectively. The flow diagram of preparing steps can be seen in Scheme S1.†2.3 Synthesis of reduced graphene oxide (rGO)
For the preparation of reduced graphene oxide (rGO), an ethanol solvothermal treatment was carried out. In a typical experiment, as-synthesized GO-6 of 80 mg was dispersed in anhydrous ethanol of 80 mL by ultrasonic treatment for 2 h to obtain a homogeneous dispersion. Then, the brown mixture was transferred to a 100 mL Teflon-lined autoclave and kept in an oven at a certain temperature for 12 h. Subsequently, the resulting black slurry was collected, washed six times with anhydrous ethanol and dried in a vacuum oven at 30 °C for overnight. The reduced graphene oxide samples prepared under different temperatures (80, 100, 120, 140, 160 and 180 °C) are labeled as Y-rGO-6 (Y = 80, 100, 120, 140, 160 and 180).2.4 Characterization
The scanning electron microscope (SEM) micrographs were obtained by using a Hitachi S-4800 instrument manipulating at 5.0 kV. Atomic force microscopy (AFM) were carried out with a Digital Instruments Nanoscope IIIA by using the tapping mode with a silicon cantilever. The UV-Vis absorption spectra were taken out with a UV-2700 spectrometer and the samples were dispersed in DI water. Fourier transform infrared (FT-IR) spectra were carried out by means of a Nicolet FT-IR NEXUS spectrometer. Raman spectra were obtained with a HR800 spectrometer using an excitation wavelength of 458 nm. X-ray photoelectron spectroscopy (XPS) was performed on a Thermo ESCALAB 250 spectrometer with Al Kα radiation as X-ray source. High-resolution solid-state 13C NMR experiments were obtained with a Bruker DRX-400 MHz NMR spectrometer.2.5 Nonlinear optical measurement
The NLO performance of GO and rGO were evaluated from open aperture Z-scan measurements.10 The advantage of this technique is experimental simplicity, and it allows simultaneous determination of the nonlinear absorption and refraction signal of a sample. In the measurement systems, the excitation source was a Q-switched Nd:YAG laser (1064 nm, 4 ns). The laser beam was firstly adjusted by an inverted telescope system that includes a Glan-Taylor prism and a fluence attenuator, and then focused by a f/100 mm convex lens (Zolix OLB50-100, Φ 50, f 100) to a beam waist radius ω0 of 50 μm. After the laser beam penetrated the sample, it was divided into two beams by a beam splitter. One was the reflected beam that was used as open-aperture signal. The other was transmitted beam that was used as close-aperture signal. Both laser beams were monitored per 850 ms by detectors (PE9-ROHS energy probes, OPHIR Laser Measurement Group). A computer was applied to collect and analyze the experimental data that were sent from the detectors through a Zolix SC300-2A Motion Controller. Dimethyl sulfoxide (DMSO) solutions of various GO and rGO with 0.13 mg mL−1 were placed in a 2 mm quartz cell. The magnitude of the nonlinear absorption coefficient β of the samples can be determined by using the intensity variation equation and adopting an intensity-dependent absorption coefficient.153. Results and discussion
3.1 Characterization of GO and rGO
The morphologies of as-prepared GO-6 and 180-rGO-6 have been gained from the scanning electron microscope (SEM) and atomic force microscopy (AFM). The SEM images of the GO-6 and 180-rGO-6 are shown in Fig. 1A and B. The GO-6 has a smooth and folded sheet like morphology. After ethanol solvothermal treatment, the 180-rGO-6 shows severe crumple in the surface and a highly loose architecture, which should be attributed to the intercalation and release of gas during reduction process.16 Furthermore, the GO-6 and 180-rGO-6 can be exfoliated into single or few layers graphene, as shown in AFM analysis (Fig. 1C and D). The GO-6 displays a flat sheets with a thickness of ca. 1.2 nm, which matches well with the thickness of an individual layer of GO. The 180-rGO-6 demonstrates an average layer thickness of ca. 3 nm, indicating few-layer graphene with 3–6 layers. The reason for the increased thickness of 180-rGO-6 compared to that of the GO-6 sheets maybe attributed to that, after ethanol solvothermal reduction, the amount of oxygen-containing groups are removed. The surface of rGO nanosheets became hydrophobic. The strong van der Waals forces would facilitate the aggregation of graphene nanosheets.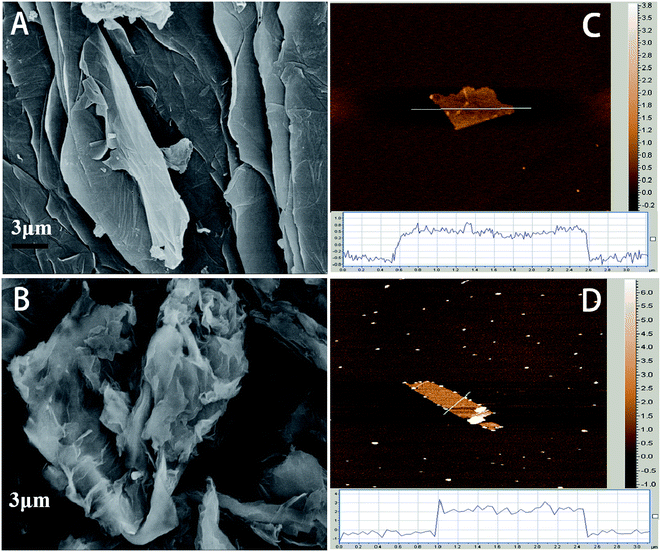 | ||
| Fig. 1 SEM images of GO-6 (A), 180-rGO-6 (B) and AFM images of GO-6 (C), 180-rGO-6 (D), the insets of (C and D) showing the thickness of GO-6 and 180-rGO-6 nanosheets. | ||
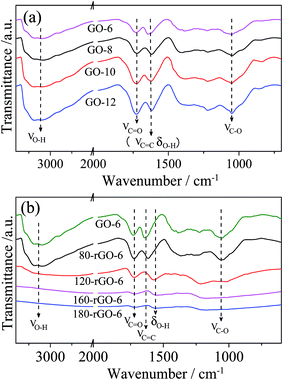
The FT-IR spectrum can provide important information of the oxygen-containing functional groups. The FT-IR spectra of GO-X (X = 6, 8, 10 and 12) and Y-rGO-6 (Y = 80, 120, 160 and 180) are demonstrated in Fig. 2. The main characteristic absorption peaks of GO-6 can be observed at 2900–3600 cm−1 (νO–H) and 1738 cm−1 (νC![[double bond, length as m-dash]](https://www.rsc.org/images/entities/char_e001.gif) O) from carboxyl groups and carbonyl, 1635 cm−1 (νC
O) from carboxyl groups and carbonyl, 1635 cm−1 (νC![[double bond, length as m-dash]](https://www.rsc.org/images/entities/char_e001.gif) C, δO–H) and 1051 cm−1 (νC–O) from unoxidized graphitic regions, adsorbed water molecules (the C
C, δO–H) and 1051 cm−1 (νC–O) from unoxidized graphitic regions, adsorbed water molecules (the C![[double bond, length as m-dash]](https://www.rsc.org/images/entities/char_e001.gif) C stretching vibration of unoxidized graphitic regions merges into the deformation vibration of adsorbed water molecules) and alkoxy groups.17–21 In comparison with GO-6, the intensity of all characteristic peaks in GO-8, GO-10 and GO-12 enhances clearly upon increasing the amount of KMnO4 in Hummers method. Moreover, the relative intensity ratio of the νC
C stretching vibration of unoxidized graphitic regions merges into the deformation vibration of adsorbed water molecules) and alkoxy groups.17–21 In comparison with GO-6, the intensity of all characteristic peaks in GO-8, GO-10 and GO-12 enhances clearly upon increasing the amount of KMnO4 in Hummers method. Moreover, the relative intensity ratio of the νC![[double bond, length as m-dash]](https://www.rsc.org/images/entities/char_e001.gif) O to νC
O to νC![[double bond, length as m-dash]](https://www.rsc.org/images/entities/char_e001.gif) C peak (IC
C peak (IC![[double bond, length as m-dash]](https://www.rsc.org/images/entities/char_e001.gif) O/IC
O/IC![[double bond, length as m-dash]](https://www.rsc.org/images/entities/char_e001.gif) C) gradually increases. These observations reflect more introduction of the oxygen-containing groups and enhanced oxidation degree in the GO nanosheets.
C) gradually increases. These observations reflect more introduction of the oxygen-containing groups and enhanced oxidation degree in the GO nanosheets.
The FT-IR spectra of Y-rGO-6 (Y = 80, 120, 160 and 180) are displayed in Fig. 2b. The 80-rGO-6, 100-rGO-6 and 120-rGO-6 samples prepared under low-temperature ethanol solvothermal treatment exhibit similar characteristic peaks to the GO-6. After the temperature is higher than 120 °C, the intensities of all characteristic peaks corresponding to oxygen-containing functional groups decrease significantly. The peaks at 2900–3600 cm−1 and 1050 cm−1 ascribed to O–H and C–O species nearly disappear for 160-rGO-6 and 180-rGO-6. While the peak at 1738 cm−1 attributed to the carbonyl C![[double bond, length as m-dash]](https://www.rsc.org/images/entities/char_e001.gif) O group can be still observed clearly for 180-rGO-6. Moreover, an obvious peak obtained at 1569 cm−1 (νC
O group can be still observed clearly for 180-rGO-6. Moreover, an obvious peak obtained at 1569 cm−1 (νC![[double bond, length as m-dash]](https://www.rsc.org/images/entities/char_e001.gif) C) should be assigned to the restoration of the π-system in graphene nanosheets. These results indicate the gradual reduction of GO-6 by the ethanol solvothermal treatment. The different oxygen-containing functional groups in the GO nanosheets would be removed gradually in the reduction process.
C) should be assigned to the restoration of the π-system in graphene nanosheets. These results indicate the gradual reduction of GO-6 by the ethanol solvothermal treatment. The different oxygen-containing functional groups in the GO nanosheets would be removed gradually in the reduction process.
The UV-vis absorption spectra of GO-X and Y-rGO-6 can be seen in Fig. 3. The absorption spectrum of GO-6 displays an obvious absorption maxima at around 210–260 nm, attributed to π–π* transitions of C![[double bond, length as m-dash]](https://www.rsc.org/images/entities/char_e001.gif) C bonds in sp2 carbon hybrid regions.7,22 In addition, a shoulder peak at around 310 nm should be ascribed to n–π* transitions of carbonyl groups.23,24 The broad absorption spectrum extended to 800 nm indicates the absence of a definite band edge for the GO-6 in the UV-vis energy range. Compared to GO-6, GO-X (X = 8, 10 and 12) samples exhibit similar absorption peak type with a tiny blue shift due to the decrease of the aromatic C
C bonds in sp2 carbon hybrid regions.7,22 In addition, a shoulder peak at around 310 nm should be ascribed to n–π* transitions of carbonyl groups.23,24 The broad absorption spectrum extended to 800 nm indicates the absence of a definite band edge for the GO-6 in the UV-vis energy range. Compared to GO-6, GO-X (X = 8, 10 and 12) samples exhibit similar absorption peak type with a tiny blue shift due to the decrease of the aromatic C![[double bond, length as m-dash]](https://www.rsc.org/images/entities/char_e001.gif) C transitions upon further oxidation. These results indicate that GO's oxidation degree gradually increases from GO-6 to GO-12, as documented in the FT-IR spectra analysis of GO-X.
C transitions upon further oxidation. These results indicate that GO's oxidation degree gradually increases from GO-6 to GO-12, as documented in the FT-IR spectra analysis of GO-X.
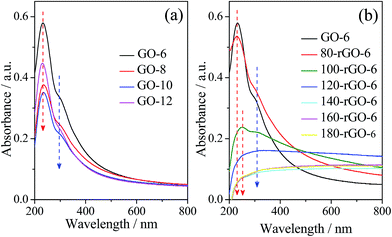 | ||
| Fig. 3 UV-vis absorption spectra of GO-X (X = 6, 8, 10 and 12) (a) and Y-rGO-6 (Y = 80, 100, 120, 140, 160 and 180) (b) in de-ionized water. | ||
After reduction via ethanol solvothermal treatment, the absorption spectra of Y-rGO-6 (Y = 80, 100, 120, 140, 160 and 180) can be observed in Fig. 3b. Compared with the GO-6, the main absorption peak of Y-rGO-6 shifts gradually from 230 nm of 80-rGO-6 to 253 nm of 100-rGO-6 and the absorptive intensity decreased clearly. Especially, when the reduction temperature is higher than 120 °C, the strong reduction leads to the disappearance of the absorption peaks from 140-rGO-6 to 180-rGO-6. These observations reflect that, after the ethanol solvothermal treatment, a large amount of epoxy, hydroxyl and carboxyl groups of GO would be removed along with recover of C![[double bond, length as m-dash]](https://www.rsc.org/images/entities/char_e001.gif) C species.25–27 The new generated sp2 hybrid carbon further enlarged the conjugated π-system. However, this new generated sp2 hybrid carbon will enlarge the existing sp2 carbon nanoislands or only re-create a few smaller sp2 carbon configuration in graphene nanosheets. The clear evidence should be further studied by means of solid-state 13C magic-angle spinning MAS NMP, XPS and Raman spectrum.
C species.25–27 The new generated sp2 hybrid carbon further enlarged the conjugated π-system. However, this new generated sp2 hybrid carbon will enlarge the existing sp2 carbon nanoislands or only re-create a few smaller sp2 carbon configuration in graphene nanosheets. The clear evidence should be further studied by means of solid-state 13C magic-angle spinning MAS NMP, XPS and Raman spectrum.
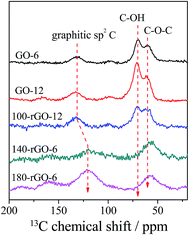
Solid-state 13C magic-angle spinning (MAS) NMR was adopted to further confirm the structural change of GO-X and Y-rGO-6 samples. The 13C MAS NMR measurement was performed on five selected samples including GO-6, GO-12, 100-rGO-6, 140-rGO-6 and 180-rGO-6, as shown in Fig. 4. For GO-6 sample, the main signals are located at 60, 69 and 131 ppm, corresponding to 13C nuclei in the epoxide, hydroxyl groups and un-oxidized graphitic sp2 carbon, respectively.28,29 Compared with the GO-6, the epoxy and hydroxyl signals of the heavy oxidized GO-12 enhance and the graphitic sp2 carbon becomes weak. These results implies that plentiful epoxy and hydroxyl groups are introduced as the oxidation condition gradually increases from GO-6 to GO-12. After the ethanol solvothermal treatment, the signal of the 100-rGO-6 at 69 ppm assigned to C–OH groups decreases compared to that of the GO-6, revealing that the C–OH groups in graphene oxide nanosheets first occurs deoxidization reduction. After reduction at 140 °C, the signals of the 140-rGO-6 at around 60 ppm ascribed to C–OH and C–O–C groups decrease further significantly. Additionally, the graphitic sp2 carbon moves toward low chemical shift location. With the increase of the reduction temperature to 180 °C, the graphitic sp2 carbon signal is broadened and shifts from 131 ppm (GO-6) to 121 ppm (180-rGO-6). The epoxy and hydroxyl signals of 180-rGO-6 shift to 56 ppm. The movement toward low chemical shift location should be ascribed to the changes of the chemical environment of the hybrid carbons in 180-rGO-6 sample. The generation of numerous sp2 hybrid carbons should make 180-rGO-6 possess different sp2/sp3 hybrid carbon structure and fraction to GO-6 sample, which would change the chemical environment of 13C nuclei in the epoxide, hydroxyl groups and un-oxidized graphitic sp2 carbon. These observations reflect more significant reduction effects under high temperature conditions on the hybrid carbon system of graphene oxide.
Further insight into the surface chemical composition of samples are investigated by using the X-ray photoelectron spectrum (XPS). The XPS survey spectra of GO-X and Y-rGO-6 are displayed in Fig. 5a and b. There are main two peaks in all samples corresponding to C 1s and O 1s species. The O/C atomic ratio enhances from 0.47 of GO-6 to 0.51 of GO-12, reflecting an increase of oxidized degree with the increased in the amount of KMnO4. While the O/C atomic ratio decreases from 0.40 of 100-rGO-6 to 0.18 of 180-rGO-6 significantly. Undoubtedly, gradual loss of oxygen groups occurs upon increasing the ethanol solvothermal temperature.
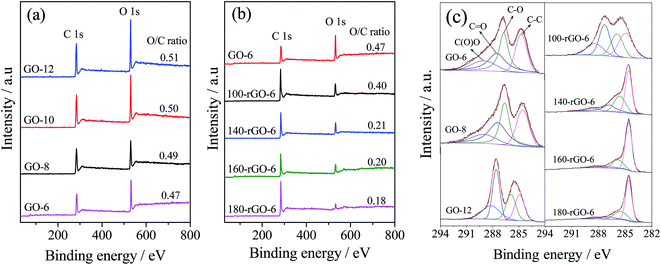 | ||
| Fig. 5 XPS survey spectra of GO-X (X = 6, 8, 10 and 12) (a), Y-rGO-6 (Y = 100, 140, 160 and 180) (b) and C 1s XPS spectra of GO-X (X = 6, 8 and 12) and Y-rGO-6 (Y = 100, 140, 160 and 180) (c). | ||
The C 1s XPS spectra of samples were further studied, as demonstrated in Fig. 5c. The C 1s XPS spectrum of GO-6 can be fitted into four peaks corresponding to the carbon species with different chemical valence, namely, C(O)O at 288.9 eV, C![[double bond, length as m-dash]](https://www.rsc.org/images/entities/char_e001.gif) O at 287.5 eV, C–O at 286.7 eV and C–C (sp2 carbon) at 284.6 eV, respectively.30,31 The ratio of the C–O species governs in GO-6. The peak area ratios of carbon-containing bonds to total area are calculated according to the XPS analysis and presented in Table 1. The amount of the C–C species decreases from 26.5% of the GO-6 to 22.1% of the GO-12 with the increase of the KMnO4 consumption. Meanwhile, the amount of the C
O at 287.5 eV, C–O at 286.7 eV and C–C (sp2 carbon) at 284.6 eV, respectively.30,31 The ratio of the C–O species governs in GO-6. The peak area ratios of carbon-containing bonds to total area are calculated according to the XPS analysis and presented in Table 1. The amount of the C–C species decreases from 26.5% of the GO-6 to 22.1% of the GO-12 with the increase of the KMnO4 consumption. Meanwhile, the amount of the C![[double bond, length as m-dash]](https://www.rsc.org/images/entities/char_e001.gif) O and C(O)O species increases significantly followed by the decrease of the amount of the C–O species from 30.8% (GO-6)% to 23.3% (GO-12). It indicates that the residual C–C species (sp2 carbon) even the C–O group in GO-6 nanosheets were oxidized gradually to C
O and C(O)O species increases significantly followed by the decrease of the amount of the C–O species from 30.8% (GO-6)% to 23.3% (GO-12). It indicates that the residual C–C species (sp2 carbon) even the C–O group in GO-6 nanosheets were oxidized gradually to C![[double bond, length as m-dash]](https://www.rsc.org/images/entities/char_e001.gif) O and C(O)O species during the process of the heavy oxidation. Furthermore, after the reduction by means of the ethanol solvothermal treatment, the amount of the C–C species increases to 59.8% of 180-rGO-6, and the amount of C–O, C
O and C(O)O species during the process of the heavy oxidation. Furthermore, after the reduction by means of the ethanol solvothermal treatment, the amount of the C–C species increases to 59.8% of 180-rGO-6, and the amount of C–O, C![[double bond, length as m-dash]](https://www.rsc.org/images/entities/char_e001.gif) O as well as C(O)O species decreases clearly, as shown in Table 1. It is noted that the number of the C–O species displays a process of an increase and then decrease to 23.5% (180-rGO-6), illustrating first reduction of the unstable C
O as well as C(O)O species decreases clearly, as shown in Table 1. It is noted that the number of the C–O species displays a process of an increase and then decrease to 23.5% (180-rGO-6), illustrating first reduction of the unstable C![[double bond, length as m-dash]](https://www.rsc.org/images/entities/char_e001.gif) O and C(O)O species to C–O group and further to C–C species. The changes of the carbon species manifest a gradual reduction of the GO-6, which corroborates the obtained results from FT-IR and solid-state NMR that the sp3 hybrid carbon gradually translate into sp2 hybrid carbon with increased ethanol solvothermal temperature.
O and C(O)O species to C–O group and further to C–C species. The changes of the carbon species manifest a gradual reduction of the GO-6, which corroborates the obtained results from FT-IR and solid-state NMR that the sp3 hybrid carbon gradually translate into sp2 hybrid carbon with increased ethanol solvothermal temperature.
| Sample | AC–C/AT (%) | AC–O/AT (%) | AC![[double bond, length as m-dash]](https://www.rsc.org/images/entities/char_e001.gif) O/AT (%) O/AT (%) |
AC(O)O/AT (%) |
|---|---|---|---|---|
| GO-12 | 22.1 | 23.3 | 32.9 | 21.6 |
| GO-8 | 25.3 | 29.1 | 30.2 | 15.3 |
| GO-6 | 26.5 | 30.8 | 27.8 | 14.9 |
| 100-rGO-6 | 30.2 | 24.1 | 29.1 | 16.6 |
| 140-rGO-6 | 42.6 | 28.3 | 19.6 | 9.4 |
| 160-rGO-6 | 53.1 | 25.9 | 14.7 | 5.3 |
| 180-rGO-6 | 59.8 | 23.5 | 12.4 | 4.2 |
The Raman spectroscopy is a powerful technique for the analysis of the carbon framework. The Raman spectra of GO-X, Y-rGO-6 as well as the raw graphite are illustrated in Fig. S1.† The graphite exhibits a weak D band at 1364 cm−1, corresponding to the disordered modes. A intense and sharp G band observed at 1581 cm−1 represents an ordered, crystalline and less defective graphitic sample.32,33 In comparison with the graphite, the D bands are significantly intense and the G bands clearly broaden in the Raman spectra of GO-X (X = 6, 8, 10 and 12), which is ascribed to the generation of a large number of sp3 hybrid carbon in the oxidation process. The procreant sp3 carbon matrix would do great damage to honeycomb graphene lattice. The creation of vacancies, defects and distortions in graphene nanosheets during oxidation process further decreases the size of the sp2 carbon domains. These changes lead to that sp2 hybrid carbons are isolated by the sp3 carbon matrix. Moreover, after the ethanol solvothermal reduction, the intensities of the G band and D band in the spectra of Y-rGO-6 (Y = 80, 100, 120, 140, 160 and 180) show significant change when compared with those of the GO-6. The intensity ratio (ID/IG) of the D band with G band is widely used to estimate the in-plane crystallite sizes of graphite and the degree of disorder in graphitic materials. The ID/IG values of GO-X (X = 6, 8, 10 and 12) and Y-rGO-6 (Y = 80, 100, 120, 140, 160 and 180) are calculated according to the Raman spectroscopy. Furthermore, the relationship of the ID/IG ratio and the size of the perfect graphene domains are calculated by using of the eqn (1),
La (nm) = (2.4 × 10⁻¹⁰)λ4(ID/IG)−1![[thin space (1/6-em)]](https://www.rsc.org/images/entities/char_2009.gif) 34 34
| (1) |
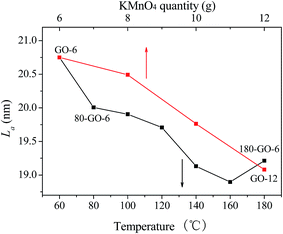 | ||
| Fig. 6 The lateral dimension of in-plane crystallite sp2 carbon (La) of GO-X and Y-rGO-6 as a function of different oxygen/reduction condition. | ||
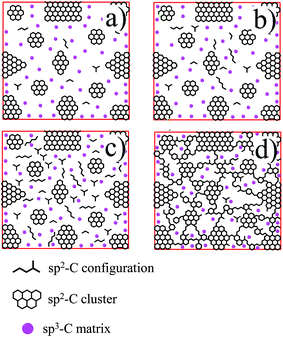 | ||
| Fig. 7 The schematic representation for structure evolution of the sp2/sp3 hybrid carbon in the graphene oxide nanosheets. | ||
In GO nanosheets, small sp2 carbon configurations and large sp2 carbon clusters disperse in sp3 carbon matrix (Fig. 7a). After the ethanol solvothermal treatment, a large quantity of oxygen-containing functional groups in graphene nanosheets would be removed gradually. In low-temperature reduction condition, the size of sp2 carbon clusters don't enlarge and the concentration of sp2 carbon configurations increases (Fig. 7b and c). Further removal of oxygen under the high-temperature ethanol solvothermal condition leads to percolation among the sp2 carbon clusters via growth of sp2 configurations, as shown in Fig. 7d. The interesting evolution of the sp2/sp3 hybrid carbon structure in graphene nanosheets would further induce to the change of the nonlinear optical properties of graphene, which would be discussed below.
3.2 Nonlinear optical properties of GO and rGO
The nonlinear optical (NLO) properties of GO-X and Y-rGO-6 samples were investigated by using an open aperture Z-scan technique. The samples were dispersed in DMSO at a concentration of 0.13 mg mL−1 by ultrasonic treatment, considering that DMSO shows a good dispersive ability for reduced graphene oxide.35 Since DMSO solvent does not show any nonlinear optical response in the measurement, it can be explicitly concluded that the obtained nonlinear optical response is exclusively attributed to the dispersed GO and rGO samples. For all samples, the open aperture Z-scan measurements are carried out at 0.4 J cm−2 input pulse laser of 532 nm and 4 ns. Fig. 8 gives open aperture Z-scan curves of GO-X (X = 6, 8, 10 and 12) and Y-rGO-6 (Y = 80, 100, 120, 140, 160 and 180). The normalized transmittance curve of the GO-6 exhibits two weak shoulder peaks along with a valley at the focal plane (Z = 0), corresponding to a transformation from saturable absorption (SA) to reverse saturable absorption (RSA) with the increase of the pump intensity. The peculiar structure of the sp2/sp3 hybrid carbon of GO and rGO have been proved so that the small sp2 carbon configurations and the sp2 carbon clusters are isolated by the sp3 matrix. The sp2 carbon clusters with large crystallite carbon size usually present saturable absorption (SA) behavior at low input pulse intensities.36,37 The small localized sp2 carbon configurations and the sp3 carbon matrix can provoke the two photon absorption (TPA) and the excited state absorption (ESA).38 It is worth noting that the nonlinear absorptive capacity of the sp2 carbon configurations is larger than that of the sp3 carbon matrix.39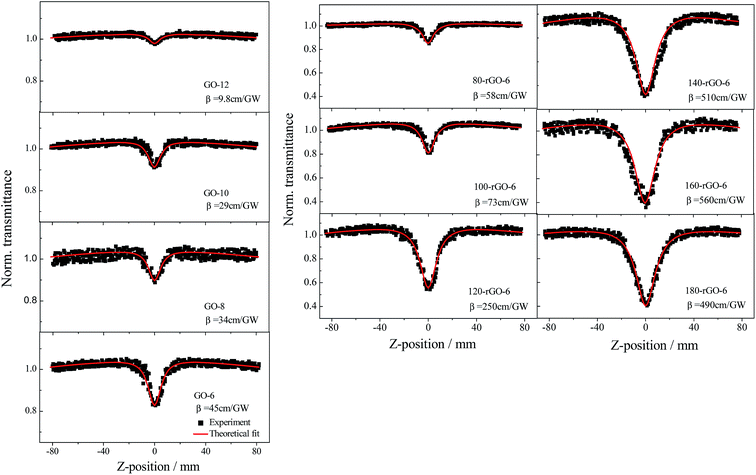 | ||
| Fig. 8 Open aperture Z-scan curves of GO-X (X = 6, 8, 10 and 12) and Y-rGO-6 (Y = 80, 100, 120, 140, 160 and 180) excited by an input intensity of 0.40 J cm−2. | ||
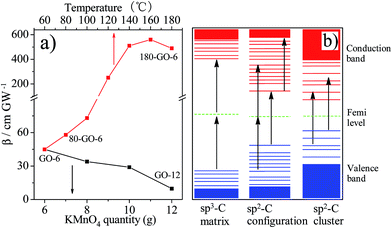
As the oxidation degree gradually increases from GO-6 to GO-12, the RSA valley significantly diminishes. Since the small localized sp2 carbon configurations dominate TPA and ESA response, the decrease of the RSA valley implies that slightly oxidized GO-6 possesses a significant fraction of sp2 carbon configurations than GO-12, which is agreement with the change of the La value observed in the Raman. Furthermore, the open aperture Z-scan curves of Y-rGO-6 samples represent a gradually deepened and broadened valley, suggesting an enhanced nonlinear absorption. The nonlinear absorption coefficient β is further derived by fitting the open aperture Z-scan curves in order to analyze the relationship of the carbon structure of graphene and nonlinear optical properties in details. As shown in Fig. 9a, the β values of GO samples decrease from 45 cm GW−1 of GO-6 to 9.8 cm GW−1 of GO-12, which can be attributed to the significant decrease of the sp2 carbon configurations in the gradually enhanced oxidation process. Moreover, the β value increases from 58 cm GW−1 of 80-rGO-6 to 560 cm GW−1 of 160-rGO-6 then decreases to 490 cm GW−1 of 180-rGO-6. The high β value of 160-rGO-6 indicates its superior nonlinearity compared with other prepared carbon materials, including EGO film, MWNTs and C60.40–42 The significant enhanced nonlinear optical performance suggests that the change of the carbon structure in graphene nanosheets should effect remarkably on the nonlinear optical properties of the graphene materials. According to observations of the Raman, the concentration of sp2 carbon configurations increases in low-temperature reduction condition, which should induce stronger nonlinear RSA than that of the GO-6. However, further removal of oxygen groups at 180 °C high-temperature reduction condition results in the percolation among the sp2 carbon clusters via gradual growth of sp2 carbon configurations so as to increase the La value of the 180-rGO-6 sample observed in Raman results. The number of the sp2 carbon cluster will give rise to the SA behavior. The increase of sp2 carbon clusters as well as the decrease of sp2 carbon configurations determine the decrease of the nonlinear absorption coefficient β value of the 180-rGO-6 compared with that of the 160-rGO-6.
The structure of electronic energy band of sp2/sp3 hybrid carbon in graphene oxide nanosheets is further represented in Fig. 9b and discussed. The structure of electronic energy band of GO is determined by the δ states of the sp3 hybridized carbon and π states of the sp2 bonded carbon. For sp3 hybridized carbon matrix, the δ–δ* energy gaps are approximately 3.0 eV.43 Up excitation by high intensity laser pulse (2.34 eV in our experiment), the bond electrons in the valence band of sp3 carbon matrix can transit to conduction band through TPA process. Additionally, the π–π* band gap of the sp2 carbon with crystallite carbon structure (sp2 carbon nanoislands) is around 0.5 eV.7 The optical absorption of electrons in sp2 carbon clusters can be saturated quickly owing to valence depletion and conduction band filling so as to present the SA behavior. Furthermore, the electronic band gap of sp2 carbon configurations should lie within the sp2 carbon clusters and sp3 carbon matrix, as demonstrated in Fig. 9b. Different mechanisms including TPA and ESA thus coexist the process of the NLO absorption of sp2 carbon configurations.9,10,44 Therefore, for GO-X samples, the high nonlinear absorption coefficient β value of GO-6 than those of the GO-8, GO-10 and GO-12 should be attributed to strong TPA and ESA originating from the sp2 carbon configurations in GO-6 sample. It further corroborates that the sp2 carbon configurations in the process of the deep oxidation are oxidized gradually to sp3 hybrid carbon with the increase of the KMnO4 consumption. Which results in the decrease of the average crystallite carbon size from GO-8 to GO-12 as observed in La value change from the Raman spectrum. Moreover, under mild ethanol solvothermal condition, much sp2 carbon configuration generated gradually but did not interconnect to form sp2 carbon nanoislands in the Y-GO-6 (Y = 80, 100, 120, 140 and 160) nanosheets, which leads to the stronger nonlinear RSA than GO-6. Therefore, we observed the enhancement of the nonlinear absorption coefficient β from 80-rGO-6 to 160-rGO-6. However, further removal of oxygen group at 180 °C ethanol solvothermal condition gives rise to percolation among the sp2 carbon clusters via the growth of sp2 carbon configurations. Much generated sp2 carbon cluster make the 180-rGO-6 show decreased RSA response and low β value than rGO samples reduced below 180 °C. Therefore, the regulation of the localized sp2 carbon configurations/clusters structure in graphene nanosheets achieved by easy ethanol solvothermal reduction, shows important effect on the electronic energy band of GO. Proper energy band gap in rGO carbon hybrid materials not only enhances nonlinear RSA efficiency but also improves NLO and optical limiting performance.
The closed aperture Z-scan measurements of GO-X and Y-rGO-6 samples were performed at the same time, as illustrated in Fig. 10. The nonlinear refraction signal of the GO-X (X = 6, 8, 10 and 12) and 80-rGO-6 samples were not observed under the test condition of 0.4 J cm−2 input pulse laser. Other reduced graphene oxide samples exhibit gradually increased valley-peak patterns from 100-rGO-6 to 180-rGO-6, demonstrating that the nonlinear refraction is the positive sign and the samples possess self-focusing nonlinear behavior. The effective refractive index n2 are calculated to be +1.87 × 10⁻¹⁷ m2 W−1 for 100-rGO-6, +7.32 × 10⁻¹⁷ m2 W−1 for 120-rGO-6, +6.23 × 10⁻¹⁷ m2 W−1 for 140-rGO-6, +7.36 × 10⁻¹⁷ m2 W−1 for 160-rGO-6 and +8.40 × 10⁻¹⁷ m2 W−1 for 180-rGO-6, respectively.
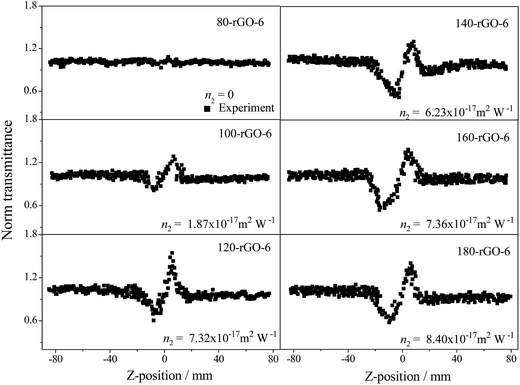 | ||
| Fig. 10 Closed aperture Z-scan curves of Y-rGO-6 (Y = 80, 100, 120, 140, 160 and 180) excited by an input intensity of 0.40 J cm−2. | ||
4. Conclusions
A series of graphene oxide (GO-X, X = 6, 8, 10 and 12) and reduced graphene oxide (Y-rGO-6, Y = 80, 100, 120, 140, 160 and 180) with regulatable sp2/sp3 hybrid carbon structure were prepared by means of ethanol solvothermal treatment at different reduction temperatures. The results of FT-IR, UV-vis, solid-state NMR, XPS and Raman spectra confirm that the small sp2 carbon configurations and large sp2 carbon clusters are isolated by the sp3 carbon matrix in GO-6 nanosheets. With the enhancement of the oxidized condition, the residual sp2 carbon configurations in GO-6 transfer to sp3 hybrid carbon so as to reduce the average crystallite carbon size in graphene nanosheets. Furthermore, a large number of sp2 carbon configurations can be controllable generated under below 180 °C ethanol solvothermal reduction conditions. These sp2 carbon configurations would further interconnect to form sp2 carbon clusters at reduction temperature of 180 °C. Upon excitation by a 532 nm laser of 4 ns pulses, the enhanced nonlinear absorption coefficient β of GO-6 than those of the GO-8, GO-10 and GO-12 reflects that the sp2 carbon configurations dominate nonlinear RSA response. Importantly, the 160-rGO-6 possesses great NLO performance and higher nonlinear absorption coefficient β than GO-6, Y-rGO-6 (Y = 80, 100, 120 and 140) as well as 180-rGO-6, illustrating that the sp2 carbon configurations with TPA and ESA response can improve efficiently nonlinear RSA properties of carbon materials. By achieving the regulation of the sp2 carbon configurations/clusters in the graphene hybrid carbon system, this work may provide some insight into the designing of other novel graphene-based materials with the regulatable structure of electronic energy band.Conflicts of interest
There are no conflicts to declare.Acknowledgements
This work is supported by the National Natural Science Foundation of China (61705063, 21203058 and 61275117), Natural Science Foundation of Heilongjiang Province of China (QC2016013 and B201308), Foundation of Educational Commission of Heilongjiang Province of China (12531579), and the Innovative Talents Program of Heilongjiang University of Science and Technology (Q20130202).References
- D. Wohrle and D. Meissner, Adv. Mater., 1991, 3, 129 CrossRef.
- S. J. Mathews, S. C. Kumar, L. Giribabu and S. V. Rao, Opt. Commun., 2007, 280, 206 CrossRef CAS.
- M. Hanack, D. Dini, M. Barthel and S. Vagin, Chem. Rec., 2002, 2, 129 CrossRef CAS PubMed.
- J. Wang, Y. Hernandez, M. Lotya, J. N. Coleman and W. J. Blau, Adv. Mater., 2009, 21, 2430 CrossRef CAS.
- G. K. Lim, Z. L. Chen, J. Clark, R. G. S. Goh, W. H. Ng, H. W. Tan, R. H. Friend, P. K. H. Ho and L. L. Chua, Nat. Photonics, 2011, 5, 554 CrossRef CAS.
- L. Guo, R. Q. Shao, Y. L. Zhang, H. B. Jiang, X. B. Li, S. Y. Xie, B. B. Xu, Q. D. Chen, J. F. Song and H. B. Sun, J. Phys. Chem. C, 2012, 116, 3594 CAS.
- G. Eda, Y. Y. Lin, C. Mattevi, H. Yamaguchi, H. A. Chen, I. S. Chen, C. W. Chen and M. Chhowalla, Adv. Mater., 2010, 22, 505 CrossRef CAS PubMed.
- X. Zheng, B. Jia, X. Chen and M. Gu, Adv. Mater., 2014, 26, 2699 CrossRef CAS PubMed.
- Z. B. Liu, X. Zhao, X. L. Zhang, X. Q. Yan, Y. P. Wu, Y. S. Chen and J. G. Tian, J. Phys. Chem. Lett., 2011, 2, 1972 CrossRef CAS.
- W. Song, C. He, W. Zhang, Y. Gao, Y. Yang, Y. Wu, Z. Chen, X. Li and Y. Dong, Carbon, 2014, 77, 1020 CrossRef CAS.
- W. Song, C. He, Y. Dong, W. Zhang, Y. Gao, Y. Wu and Z. Chen, Phys. Chem. Chem. Phys., 2015, 17, 7149 RSC.
- Z. Wang, C. He, W. Song, Y. Gao, Z. Chen, Y. Dong, C. Zhao, Z. Li and Y. Wu, RSC Adv., 2015, 5, 94144 RSC.
- B. Chen, C. He, W. Song, C. Zhao, Y. Gao, Z. Chen, Y. Dong, Y. Wu and R. Li, RSC Adv., 2015, 5, 55150 RSC.
- W. S. Hummer and R. E. Offeman, J. Am. Chem. Soc., 1958, 80, 1339 CrossRef.
- Y. Gao, X. Zhang, Y. Li, H. Liu, Y. Wang, Q. Chang, W. Jiao and Y. Song, Opt. Commun., 2005, 251, 429 CrossRef CAS.
- S. Pei, J. Zhao, J. Du, W. Ren and H. M. Cheng, Carbon, 2010, 48, 4466 CrossRef CAS.
- T. Szabo, O. Berkesi and I. Dekany, Carbon, 2005, 43, 3186 CrossRef CAS.
- G. I. Titelman, V. Gelman, S. Born, R. L. Khalfin, Y. Cohen and H. B. Peled, Carbon, 2005, 43, 641 CrossRef CAS.
- E. Fuente, J. A. Menendez, M. A. Diez, D. Suarez and M. A. M. Moran, J. Phys. Chem. B, 2003, 107, 6350 CrossRef CAS.
- G. Wang, B. Wang, J. Park, J. Yang, X. Shen and J. Yao, Carbon, 2009, 47, 68 CrossRef CAS.
- P. Dash, T. Dash, T. K. Rout, A. K. Sahu, S. K. Biswal and B. K. Mishra, RSC Adv., 2016, 6, 12657 RSC.
- X. Zheng, M. Feng and H. Zhan, J. Mater. Chem. C, 2013, 1, 6759 RSC.
- Q. Ma, J. Song, C. Jin, Z. Li, J. Liu, S. Meng, J. Zhao and Y. Guo, Carbon, 2013, 54, 36 CrossRef CAS.
- Z. Luo, Y. Lu, L. A. Somers and A. T. C. Johnson, J. Am. Chem. Soc., 2009, 131, 898 CrossRef CAS PubMed.
- Y. Yao, Z. Lin, Z. Li, X. Song, K. S. Moon and C. P. Wong, J. Mater. Chem., 2012, 22, 13494 RSC.
- C. Mattevi, G. Eda, S. Agnoli, S. Miller, K. A. Mkhoyan, O. Celik, D. Mastrogiovanni, G. Granozzi, E. Garfunkel and M. Chhowalla, Adv. Funct. Mater., 2009, 19, 2577 CrossRef CAS.
- Y. Zhou, Q. Bao, L. A. L. Tang, Y. Zhong and K. P. Loh, Chem. Mater., 2009, 21, 2950 CrossRef CAS.
- M. M. Storm, M. Overgaard, R. Younesi, N. E. A. Reeler, T. Vosch, U. G. Nielsen, K. Edstrom and P. Norby, Carbon, 2015, 85, 233 CrossRef CAS.
- W. Gao, L. B. Alemany, L. Ci and P. M. Ajayan, Nat. Chem., 2009, 1, 403 CrossRef CAS PubMed.
- Y. Yan, T. Kuila, N. H. Kim, B. C. Ku and J. H. Lee, J. Mater. Chem. A, 2013, 1, 5892 CAS.
- D. S. Yu, T. Kuila, N. H. Kim, P. Khanra and J. H. Lee, Carbon, 2013, 54, 310 CrossRef CAS.
- J. H. Yang, Y. Gao, W. Zhang, P. Tang, J. Tan, A. H. Lu and D. Ma, J. Phys. Chem. C, 2013, 117, 3785 CAS.
- M. S. Strano, C. A. Dyke, M. L. Usrey, P. W. Barone, M. J. Allen, H. Shan, C. Kittrell, R. H. Hauge, J. M. Tour and R. E. Smalley, Science, 2003, 301, 1519 CrossRef CAS PubMed.
- L. G. Cancado, K. Takai and T. Enoki, Appl. Phys. Lett., 2006, 88, 163106 CrossRef.
- J. I. Paredes, S. V. Rodil, A. M. Alonso and J. M. D. Tascon, Langmuir, 2008, 24, 10560 CrossRef CAS PubMed.
- Q. Bao, H. Zhang, Y. Wang, Z. Ni, Y. Yan, Z. X. Shen, K. P. Loh and D. Y. Tang, Adv. Funct. Mater., 2009, 19, 3077 CrossRef CAS.
- F. Bonaccorso, Z. Sun, T. Hasan and A. C. Ferrari, Nat. Photonics, 2010, 4, 611 CrossRef CAS.
- X. L. Zhang, Z. B. Liu, X. C. Li, Q. Ma, X. D. Chen, J. G. Tian, Y. F. Xu and Y. S. Chen, Opt. Express, 2013, 21, 7511 CrossRef CAS PubMed.
- H. Shi, C. Wang, Z. Sun, Y. Zhou, K. Jin, S. A. T. Redfern and G. Yang, Opt. Express, 2014, 22, 19375 CrossRef PubMed.
- J. Ren, X. R. Zheng, Z. M. Tian, D. Li, P. Wang and B. H. Jia, Appl. Phys. Lett., 2016, 109, 221105 CrossRef.
- X. L. Zhang, Z. B. Liu, X. Q. Yan, X. C. Li, Y. S. Chen and J. G. Tian, J. Opt., 2015, 17, 015501 CrossRef CAS.
- H. Zhang, S. Virally, Q. L. Bao, L. K. Ping, S. Massar, N. Godbout and P. Kockaert, Opt. Lett., 2012, 37, 1856 CrossRef CAS PubMed.
- C. Mathioudakis, G. Kopidakis, P. C. Kelires, P. Patsalas, M. Gioti and S. Logothetidis, Thin Solid Films, 2005, 482, 151 CrossRef CAS.
- S. Perumbilavil, K. Sridharan, D. Koushik, P. Sankar, V. P. M. Pillai and R. Philip, Carbon, 2017, 111, 283 CrossRef CAS.
Footnote |
| † Electronic supplementary information (ESI) available. See DOI: 10.1039/c7ra10505c |
| This journal is © The Royal Society of Chemistry 2017 |

