 Open Access Article
A novel fluorescence polarization assay for copper ions based on DNA-templated click chemistry and amplification of nanoparticles†
Suqi Liaob,
Jingjin Zhao *ab,
Yingfeng Qina and
Shulin Zhao
 b
b
aKey Laboratory of Ecology of Rare and Endangered Species and Environmental Protection of Ministry Education, Guangxi Normal University, Guilin 541004, PR China. E-mail: jzhao12@163.com; Fax: +86-773-583-2294; Tel: +86-0773-212-0226
bState Key Laboratory for the Chemistry and Molecular Engineering of Medicinal Resources, Guangxi Normal University, Guilin 541004, China
First published on 8th December 2017
Abstract
In this work, we developed a novel fluorescence polarization (FP) method for the sensitive detection of Cu2+ based on the chemical ligation of DNA by click chemistry and silica nanoparticles-assisted FP enhancement. A double-stranded DNA hybrid (P1P2) is used as an “end-of-helix” template with an alkyne group and an azide group at the end of two DNA strands, respectively. Cu2+ can be reduced to Cu+ by sodium ascorbate, and trigger the chemical ligation P1P2 through the Cu+-catalyzed azide–alkyne cycloaddition. A biotin-labeled P3 which can hybridize with P1 is introduced to displace the FAM-contained P2 from P1P2 duplex. Since P1 and P2 are linked after the Cu2+-triggered click chemistry, a P1P2P3 complex is formed which can be captured on the silica nanoparticle surface through the biotin-streptavidin interaction, thus achieving a high FP signal. In the absence of Cu2+, there is no ligation between P1 and P2. The released P2 is free and cannot be immobilized on the nanoparticle surface, resulting in a low FP. The specificity of click chemistry provides a high selectivity, and the nanoparticle-assisted FP enhancement provides a high sensitivity with a detection limit of 0.0178 μM. This method also displays good assay performance in real water samples, which may be further used for environmental monitoring.
1. Introduction
Copper is an essential biological trace element, and one of the most familiar metals in daily life as it is a vital component of proteins and enzymes in the body.1 The lack of copper in the human body may cause copper deficiency diseases, including anaemia, and certain heart, circulatory and intestinal problems.2 However, copper is also harmful to the human body at elevated concentrations, leading to cirrhosis of the liver, diarrhea, vomiting, movement disorders, and perception of neurological disorders.3 Several methods have been developed to detect copper ions, including atomic absorption spectrometry,4 coupled plasma mass spectrometry,5 electrochemical,6 colorimetric,7 fluorescent methods.8 Although these methods are very sensitive, they require expensive equipment, or need relatively complicated test process, or are interference by other metal ions easily. In this regard, the establishment of convenient methods to detect trace copper with high sensitivity and selectivity has become more and more significant in biological and environmental analysis.Cu+-catalyzed azide–alkyne cycloaddition (CuAAC) reaction is a typical example of “Click Chemistry”. It has the advantages of mild reaction conditions, high reaction rate, high yield, and facile purification with almost no byproducts. The reaction proceeds by the Cu+-catalyzed cycloaddition of a terminal alkyne and azide, forming a stable triazole compound. It is highly specific, as Cu+ only catalyzes the reaction at terminal alkynes.9 As these unique characteristics, CuAAC reaction is commonly applied in many fields, including drug research and development,10 polymer synthesis,11 and functionalization of biological macromolecules.12 Recently, CuAAC has also been used as a linking tool for DNA chemical ligation and introduced for the detection of copper ions. For example, Mirkin's group reported a colorimetric Cu2+ sensor based on click chemistry-triggered ligation of DNA-modified gold nanoparticles.13 Nie's group used DNA-templated click reaction to mediate intra-molecular G-quadruplex structure formation for developing a fluorescence Cu2+ detection method.14
Here, we presented the first example of using fluorescence polarization (FP) technique to detect Cu2+ through CuAAC strategy. FP is a simple quantitative method related to the molecular mass and volume of fluorescent molecules.15 The degree of FP exhibited by a molecule is inversely proportional to its rotational speed. Thus, larger molecules with slower rotation present stronger FP, whereas smaller molecules with faster rotation present weaker FP. When performed in homogeneous solution, the FP technique has the advantages of simple operation, high sensitivity, and good reproducibility, and has thus received much attention in life science.16 In recent years, to further improve the sensitivity of FP, researchers have developed signal amplification methods, such as the use of silica nanoparticles,17 carbon nanotubes,18 proteins,19 and gold nanoparticles20 to enhance the FP signal. In this work, we used CuAAC reaction to chemically ligase DNA chains and introduced streptavidin-modified silica nanoparticles (SA-SiO2) to enhance FP, thus developing a novel signal-amplification method for the detection of Cu2+. The specific CuAAC reaction provides a good selectivity, and the FP amplification by silica nanoparticles gives a high sensitivity. This method also exhibits an acceptable assay performance in river water samples, which may be further used for environmental monitoring.
2. Experimental
2.1 Reagents and instruments
Streptavidin-modified silica nanoparticles (SA-SiO2) were purchased from Bangs Laboratories Inc., USA. Tris-(hydroxypropyltriazolylmethyl) amine (THPTA) was obtained from Sigma, USA. Sodium ascorbate (NaVC) was bought from Shanghai Sangon Biotech. All other reagents used in the experiments were made in China and of analytical grade. Ultrapure water with an electrical resistance of 18.2 MΩ cm was used throughout this study. The DNA fragments used in this study were synthesized by Shanghai Sangon Biotech Co. Ltd. The sequences are shown below:P1: CH![[triple bond, length as m-dash]](https://www.rsc.org/images/entities/char_e002.gif) CH-GCGTCGCCAGGTCC
CH-GCGTCGCCAGGTCC
P2: FAM-GGCGACGC-N3
P3: GGACCTGGCGACGCAGCGTCG-Biotin
A DNA stock solution was made by centrifuging DNA at 12![[thin space (1/6-em)]](https://www.rsc.org/images/entities/char_2009.gif) 000 rpm for 1 min and dissolving in ultrapure water to a concentration of 20 μM. The solution was then allowed to stand at 4 °C for 24 h and stored at −20 °C prior to use. 10× Tris–HCl buffer (pH 7.0) contained 0.2 M Tris–HCl and 1 M NaCl was used in this work.
000 rpm for 1 min and dissolving in ultrapure water to a concentration of 20 μM. The solution was then allowed to stand at 4 °C for 24 h and stored at −20 °C prior to use. 10× Tris–HCl buffer (pH 7.0) contained 0.2 M Tris–HCl and 1 M NaCl was used in this work.
2.2 Fluorescence polarization detection of Cu2+
P1 and P2 with equal concentration were mixed in 1× Tris–HCl buffer (0.02 M Tris–HCl and 0.1 M NaCl, pH 7.0). The mixture was then heated at 95 °C for 5 min, followed by cooling to room temperature to obtain the duplex P1P2 probe. After that, 11.1 μL of H2O, 1.9 μL of 10× Tris–HCl buffer, 1.0 μL of 1.0 μM P1P2, 2.0 μL of 10 mM THPTA, 2.0 μL of 5.0 mM NaVC, and 2.0 μL of a CuSO4 solution with different concentration were mixed well. After reacting at room temperature for 120 min, 16 μL of H2O, 2.0 μL of 10× Tris–HCl buffer, and 2.0 μL of 2.0 μM P3 were added and reacted for 60 min at 37 °C. Then, 8.0 μL of H2O, 1.0 μL of 10× Tris–HCl buffer, and 1.0 μL of 0.50 μg μL−1 SA-SiO2 were added to the reaction mixture, which was mixed well and allowed to react at 37 °C for 30 min. After that, 25 μL obtained solution was added into 75 μL of 1× Tris–HCl buffer to give a 100 μL of final solution for FP analysis. All FP measurements were performed using a Cary Eclipse fluorescence spectrophotometer (Agilent Technologies, USA) at an excitation wavelength of 485 nm with a slit-with of 10 nm for excitation and emission. The FP signal was recorded at an emission wavelength of 520 nm. Each sample was measured three times independently. The change of FP signals between the presence and absence of Cu2+ was used to evaluate the assay performance.2.3 Gel electrophoresis
Agarose gel electrophoresis was used to confirm the chemical linkage of the P1 and P2 and its hybridization with P3. The samples were prepared as follows: 6.6 μL of H2O, 1.4 μL of 10× Tris–HCl buffer, 6.0 μL of 10 μM P1P2, 2.0 μL of 10 mM THPTA, 2.0 μL of 5.0 mM NaVC, and 2.0 μL of 0.20 mM CuSO4 were thoroughly mixed at room temperature and allowed react for 120 min. Then, 13.0 μL of H2O, 2.0 μL of 10× Tris–HCl buffer, and 3.0 μL of 20 μM P3 were added and allowed to react for 60 min at 37 °C. Agarose gel electrophoresis was performed using a 4% agarose gel in 1× TBE buffer 9.0 mM Tris, 9.0 mM boric acid, and 0.2 mM EDTA, pH 7.9. 20 μL of sample solution was added to each well, and the experiment was run under a constant voltage of 90 V for 90 min. The results were imaged with an Omega 16ic gel imaging system and analyzed.3. Results and discussion
3.1 Design principle
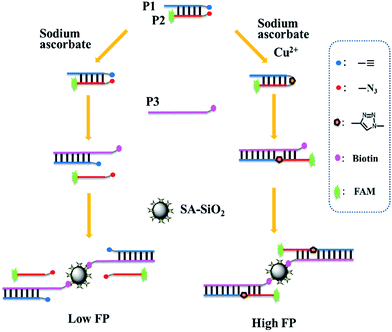
The principle of the proposed FP signal amplification strategy is outlined in Scheme 1. The 5′ end of P1 was modified with an alkyne group, while the P2 was labelled with a fluorophore (FAM) at the 5′ end and an azide group at its 3′ end. P3 was modified with a biotin on the 3′ end, which is entirely complementary to P1 and also has 6 complementary base pairs to P2. A double-stranded DNA (dsDNA) hybrid (P1P2) is used as “end-of-helix” template bearing an alkyne group and an azide group at the end of two DNA strands, respectively. In the presence of Cu2+, Cu2+ is reduced to Cu+ by sodium ascorbate (NaVC), and triggers the chemical ligation of P1 and P2 through the Cu+-catalyzed azide–alkyne cycloaddition under the assistance of ligand Tris (hydroxy-propyltriazolyl methyl) amine (THPTA). The biotin-labelled P3 then hybridizes with P1 and displaces the P2. As P1 and P2 are linked, P2 is drawn closer to P3 and hybridizes with it to form a P1P2P3 complex. After the addition of SA-SiO2, the FAM-contained P1P2P3 complex binds to the surface of the nanoparticles through the specific bonding between biotin and streptavidin, forming P1P2P3/SA-SiO2 nanocomplex. Due to the larger molecular volume and mass of the formed nanocomplex, a stronger FP signal was therefore obtained. In the absence of Cu2+, the azide–alkyne cycloaddition does not proceed and no linking will occur between the ends of P1 and P2. When P3 and P1 hybridized, P2 is displaced. Because P2 and P3 are less complementary which brings a lower DNA melting temperature, P2 cannot hybridize with P3. Consequently, the addition of SA-SiO2 only leads to the formation of a P1P3/SA-SiO2 nanocomplex. The FAM-labelled free P2 will give a weaker FP signal. Therefore, quantitative analysis of Cu2+ can be performed according to the change in FP signal. | ||
| Scheme 1 Schematic illustration of the amplified FP assay for Cu2+ based on DNA-templated click chemistry and SA-SiO2. | ||
3.2 Feasibility study
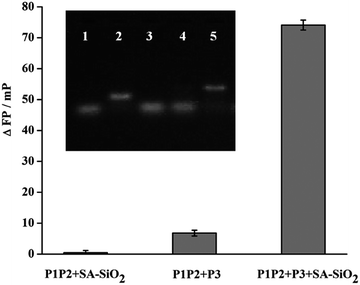
To verify the feasibility of the method concept, we first investigated the FP signal under different conditions. The change of FP signals (ΔFP) between the presence and absence of Cu2+ was used to evaluate the assay performance. As shown in Fig. 1, in the absence of P3, ΔFP value is negligible. This is because that the FAM-labelled P2 can't combine to SA-SiO2 without the help of P3 even though the chemical ligation has taken place. At the same time, if the system contains no SA-SiO2 but with P3, only a small ΔFP is observed. This is because the formed P1P2P3 complex has insufficient molecular volume/mass to significantly enhance FP signal. As expected, ΔFP value is increased remarkably in the presence of both P3 and SA-SiO2. This is because the formation of P1P2P3 after Cu2+-triggered cycloaddition, which can be captured by SA-SiO2 to give a larger P1P2P3/SA-SiO2 nanocomplex, greatly enhancing the FP signal. The above results show that this design principle is feasible and can be used for the quantitative detection of Cu2+.The viability of proposed strategy was further investigated by gel electrophoresis. The results are shown in the inset of Fig. 1. P2 was labelled with a FAM fluorophore, which was used as an indicator here to show the position of P2-contanined DNA in the gel, thus providing the hybridization state information indirectly. Lane 1 and lane 2 are P2 and P1P2, respectively. When P3 is mixed with P1P2, only a band (lane 3) at the same position as that of P2 but not of P1P2 is observed. This indicates that the strand displacement took place through the hybridization of P3 and P1, and P2 was released from P1P2. Lane 4 is the mixture of P1P2, P3, NaVC and THPTA but without Cu2+. In this condition, no ligation was occurred and P2 could also be displaced by P3. Thus, in lane 4, it only exhibits a band at the similar position to P2 and the band of P1P2 disappeared. With the introduction of Cu2+, a new band with more slower mobility is obtained (lane 5). This result imply that the P2 was linked to the P1 through Cu+-catalyzed azide–alkyne cycloaddition, and then formed P1P2P3 complex. So, a band that moves slowly can be observed. The above gel electrophoresis results indicate that the formation of P1P2P3 relied on the presence of Cu2+, further verifying the present design principle.
3.3 Assay performance
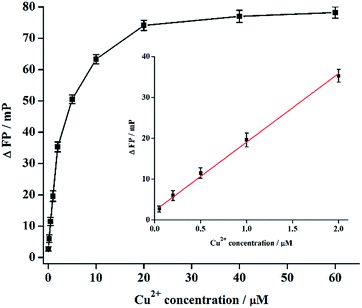
To achieve a good assay performance, we optimized the conditions including the temperature, incubation time, and the solution pH of the click chemistry reaction, and the concentrations of used NaVC and SA-SiO2. The experimental results show a largest ΔFP value when the click chemistry was performed using 5 mM NaVC to reduce Cu2+ at 25 °C for 120 min under a solution pH of 7.0 (Fig. S1, ESI†). In addition, ΔFP increased with increasing SA-SiO2 concentration and then decreased when the concentration was larger than 0.5 μg μL−1 (Fig. S2, ESI†). Thus, this value was selected as the optimal SA-SiO2 concentration for the following experiments.Under the optimized experimental conditions, a series of Cu2+ solutions with different concentrations was analyzed, and the results are shown in Fig. 2. ΔFP increases with increasing Cu2+ concentration from 0.050 to 20 μM, and reaches a plateau when the Cu2+ concentration is larger than 20 μM. ΔFP shows a good linear relationship in the Cu2+ concentration rang of 0.050–2.0 μM (inset of Fig. 2). The linear equation is ΔFP = 16.81C + 2.25 (C is Cu2+ concentration) with a correlation coefficient of 0.9960. The detection limit (DL) is about 0.0178 μM (S/N = 3). The assay performance of this method was also compared with other CuAAC-based Cu2+ determination methods (Table S1, ESI†). Comparison results indicate that the proposed FP assay here can be used for sensitive detection of Cu2+ except a slightly longer assay time. The DL here is much lower than that of previously reported colorimetric method based on CuAAC-triggered aggregation of DNA-modified gold nanoparticles (20 μM)13 and colorimetric method coupled CuAAC-ligated DNA with unmodified gold nanoparticle (250 nM),21 and is comparable to that of methods using DNA-templated CuAAC to mediate G-quadruplex structure formation (65 nM for fluorescence detection, and 5.9 nM for colorimetric method).14,22 Though the assay time of our method is slightly longer than that of G-quadruplex14,22 and unmodified gold nanoparticle21 based assays, it is much shorter than other methods, like fluorescence assay using CuAAC-triggered aggregation-induced emission of tetraphenylethene derivative23 and commercial glucometer-based assay.24
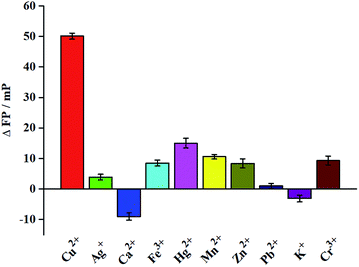
To investigate the selectivity of the method, we utilized other environmentally related heavy metal ions, such as Ag+, Ca2+, Fe3+, Hg2+, Mn2+, Zn2+, Pb2+, K+, and Cr3+. As can be seen from the results in Fig. 3, only Cu2+ induce a significant change of FP signal, while the other metal ions have lesser effects even the concentration of interference metal ion (20 μM) was larger than that of Cu2+ (5 μM). The results show that our method has high selectivity for the detection of Cu2+.
 | ||
| Fig. 3 Specificity of the proposed FP assay for Cu2+ detection. The concentration of Cu2+ is 5 μM, and all other metal ions are 20 μM. | ||
To study the applicability of this method, river water samples (Taohuajiang River, Guilin) spiked with different concentrations of Cu2+ were tested. The water samples were collected and pre-treated by centrifugation and filtration.8b Cu2+ with different concentrations was added into the obtained water samples and then analyzed. The recovery results were listed in Table 1. The recoveries of Cu2+ detection in real water samples are between 94.0 and 107.2%, with a relative standard deviation (RSD) lower than 5%. In addition, Cu2+-spiked river water samples 1 and 3 were also tested using ICP-MS. The concentrations of Cu2+ in these two samples were 0.114 and 1.01 μM, which is close to the results obtained by the proposed methods. The above results demonstrate that our method has potential for application to monitor Cu2+ in environment-related field.
| Samples | Added (μM) | Found (μM) | Recovery (%) | RSD (%, n = 3) |
|---|---|---|---|---|
| 1 | 0.10 | 0.12 | 107.2 | 2.5 |
| 2 | 0.40 | 0.39 | 94.0 | 3.6 |
| 3 | 1.00 | 0.98 | 96.6 | 2.1 |
| 4 | 1.50 | 1.60 | 103.3 | 3.3 |
4. Conclusions
In summary, a novel FP method for sensitive detection of Cu2+ was established based on the chemical ligation of DNA by click chemistry and signal amplification by silica nanoparticles. This method has several important features. First, the combination of FP and signal amplification by silica nanoparticles greatly improves the sensitivity of the method, achieving a detection limit of 0.0178 μM for Cu2+. Secondly, the high specificity of the CuAAC reaction improves the reliability. In addition, the homogeneous FP assay does not need separation, washing, and other complex processes. Moreover, the proposed method also has a good analysis performance in river water samples. Consequently, the proposed FP-based Cu2+ detection method may hold the potential applications in environmental fields.Conflicts of interest
There are no conflicts to declare.Acknowledgements
This work was supported by the National Natural Science Foundation of China (No. 21645003).Notes and references
- (a) B. E. Kim, T. Nevitt and D. J. Thiele, Nat. Chem. Biol., 2008, 4, 176 CrossRef CAS PubMed; (b) A. K. Boal and A. C. Rosenzweig, Chem. Rev., 2009, 109, 4760 CrossRef CAS PubMed.
- M. Bonham, J. M. O'Connor, B. M. Hannigan and J. J. Strain, Br. J. Nutr., 2002, 87, 393–403 CrossRef CAS PubMed.
- (a) P. G. Georgopoulos, A. Roy, M. J. Yonone-Lioy, R. E. Opiekun and P. J. Lioy, J. Toxicol. Environ. Health, Part B, 2001, 4, 341–394 CrossRef CAS PubMed; (b) B. P. Zietz, H. H. Dieter, M. Lakomek, H. Schneider, B. K. Gaedtke and H. Dunkelberg, Sci. Total Environ., 2003, 302, 127–144 CrossRef CAS PubMed.
- J. Chen and K. C. Teo, Anal. Chim. Acta, 2001, 450, 215–222 CrossRef CAS.
- A. Milne, W. Landing, M. Bizimis and P. Morton, Anal. Chim. Acta, 2010, 665, 200–207 CrossRef CAS PubMed.
- L. M. Zhang, Y. Y. Han, F. Zhao, G. Y. Shi and Y. Tian, Anal. Chem., 2015, 87, 2931–2936 CrossRef CAS PubMed.
- V. Tharmaraj and J. Yang, Analyst, 2014, 139, 6304–6309 RSC.
- (a) X. J. Liu, N. Zhang, T. Bing and D. H. Shangguan, Anal. Chem., 2014, 86, 2289 CrossRef CAS PubMed; (b) Y. Su, B. Shi, S. Liao, Y. Qin, L. Zhang, M. Huang and S. Zhao, Sens. Actuators, B, 2016, 225, 334 CrossRef CAS.
- (a) V. V. Rostovtsev, L. G. Green, V. V. Fokin and K. B. Sharpless, Angew. Chem., 2002, 114, 2708 CrossRef; (b) Q. Wang, T. R. Chan, R. Hilgraf, V. V. Fokin, K. B. Sharpless and M. G. Finn, J. Am. Chem. Soc., 2003, 125, 3192 CrossRef CAS PubMed.
- V. P. Mocharla, B. Colasson, L. V. Lee, S. Roper, K. B. Sharpless, C. Wong and H. C. Kolb, Angew. Chem., Int. Ed., 2005, 44, 116 CrossRef CAS PubMed.
- M. J. Joralemon, R. K. O'Reilly, C. J. Hawker and K. L. Wooley, J. Am. Chem. Soc., 2005, 127, 16892 CrossRef CAS PubMed.
- K. E. Beatty, F. Xie, Q. Wang and D. A. Tirrell, J. Am. Chem. Soc., 2005, 127, 14150 CrossRef CAS PubMed.
- X. Xu, W. L. Daniel, W. Wei and C. A. Mirkin, Small, 2010, 6, 623 CrossRef CAS PubMed.
- Q. P. Shen, L. F. Zhou, Y. J. Yuan, Y. Huang, B. B. Xiang, C. Y. Chen, Z. Nie and S. Z. Yao, Biosens. Bioelectron., 2014, 55, 187 CrossRef CAS PubMed.
- J. A. Cruz-Aguado and G. Penner, Anal. Chem., 2008, 80, 8853 CrossRef CAS PubMed.
- D. M. Jameson and J. A. Ross, Chem. Rev., 2010, 110, 2685 CrossRef CAS PubMed.
- J. Zhao, Z. Chu, X. Jin and S. Zhao, Sens. Actuators, B, 2015, 209, 116 CrossRef CAS.
- Y. Huang, M. Shi, L. M. Zhao, S. L. Zhao, K. Hu, Z. F. Chen, J. Chen and H. Liang, Biosens. Bioelectron., 2014, 54, 285 CrossRef CAS PubMed.
- Y. C. He, B. C. Yin, L. H. Jiang and B. C. Ye, Chem. Commun., 2014, 50, 6236 RSC.
- Y. Huang, J. Chen, M. Shi, S. L. Zhao, Z. F. Chen and H. Liang, J. Mater. Chem. B, 2013, 1, 2018 RSC.
- Q. Shen, W. Li, S. Tang, Y. Hu, Z. Nie, Y. Huang and S. Yao, Biosens. Bioelectron., 2013, 41, 663 CrossRef CAS PubMed.
- C. C. Ge, Q. Luo, D. Wang, S. M. Zhao, X. L. Liang, L. X. Yu, X. R. Xing and L. W. Zeng, Anal. Chem., 2014, 86, 6387 CrossRef CAS PubMed.
- T. Sanji, M. Nakamura and M. Tanaka, Tetrahedron Lett., 2011, 52, 3283 CrossRef CAS.
- J. Su, J. Xu, Y. Chen, Y. Xiang, R. Yuan and Y. Chai, Biosens. Bioelectron., 2013, 45, 219 CrossRef CAS PubMed.
Footnote |
| † Electronic supplementary information (ESI) available: Supplementary figures. See DOI: 10.1039/c7ra11159b |
| This journal is © The Royal Society of Chemistry 2017 |


