
 Open Access Article
 This Open Access Article is licensed under a Creative Commons Attribution-Non Commercial 3.0 Unported Licence
An untargeted metabolomics approach to determine component differences and variation in their in vivo distribution between Kuqin and Ziqin, two commercial specifications of Scutellaria Radix†
Zhi-Wei Yang a,
Feng Xu*b,
Xin Liuc,
Yi Caoa,
Qi Tanga,
Qian-Yu Chena,
Ming-Ying Shangb,
Guang-Xue Liub,
Xuan Wang*a and
Shao-Qing Caib
a,
Feng Xu*b,
Xin Liuc,
Yi Caoa,
Qi Tanga,
Qian-Yu Chena,
Ming-Ying Shangb,
Guang-Xue Liub,
Xuan Wang*a and
Shao-Qing Caib
aDepartment of Chemical Biology, School of Pharmaceutical Sciences, Peking University, No. 38 Xueyuan Road, Haidian District, Beijing 100191, PR China. E-mail: xuanwang6818@bjmu.edu.cn; Tel: +86-10-82806818
bState Key Laboratory of Natural and Biomimetic Drugs, Peking University, No. 38 Xueyuan Road, Haidian District, Beijing 100191, PR China. E-mail: xufeng76@bjmu.edu.cn; Tel: +86-10-82802534
cTechnical Center, Beijing Entry-Exit Inspection and Quarantine Bureau, No. 6 Tianshuiyuan Street, Beijing, 100026, PR China
First published on 29th November 2017
Abstract
Kuqin (KQ) and Ziqin (ZQ), derived from the roots of Scutellaria baicalensis Georgi, are two important commercial specifications of Scutellariae Radix (SR, termed Huang qin in Chinese). According to traditional Chinese medicine, KQ is used for the treatment of upper energizer lung heat syndrome while ZQ is used to clear lower energizer large intestine heat syndrome. The chemical basis for differences in efficacy between KQ and ZQ is currently unknown. Here, we present an untargeted metabolomics approach to rapidly screen and identify chemical and in vivo distribution differences between KQ and ZQ. We identified 114 constituent differences between KQ and ZQ, of which 35 were identified in SR for the first time. Furthermore, 19 prototype constituents and 16 metabolites were tentatively identified in rat colon and lungs after oral administration of SR, of which six prototype constituents and 12 metabolites were reported for the first time. Distribution differences of baicalin, wogonoside, wogonin and oroxylin A between colon and lungs were observed. To interpret such differences, their metabolic pathways were proposed. The peak area ratio of baicalin to eriodictyol calculated from the extracted ion chromatogram was proposed as a differentiation index for the classification and quality control of KQ and ZQ. These results may partially explain the efficacy differences between KQ and ZQ, and provide references for clinical treatment of related diseases.
Introduction
Scutellariae Radix (SR) is one of the most widely used traditional Chinese medicines and is used to treat infection of the respiratory and gastrointestinal tracts.1,2 Kuqin (KQ) and Ziqin (ZQ) are two important specifications of SR. Perennial and hollow roots with dark cores are defined as KQ and solid new roots are designated as ZQ. According to the theories of traditional Chinese medicine, KQ is used to treat upper energizer lung heat syndrome while ZQ is used for lower energizer large intestine heat syndrome. It has been reported that baicalein,3 baicalin,4 wogonin,5 wogonoside6 and SR extracts7 can protect against lipopolysaccharide (LPS)-induced acute lung injury (ALI) in rats. Baicalein,8,9 baicalin,9 wogonoside,9 wogonin,9 and SR extracts2,10–12 can all ameliorate the inflammatory symptoms of induced colitis. The above mentioned compounds are found in KQ and ZQ. These results suggest that the target organs of KQ and ZQ might be lungs and colon.We have previously reported that KQ is more potent than ZQ at inhibiting NO production by blocking inducible nitric oxide synthase (iNOS) expression in NR8383 cells (a rat alveolar macrophage cell line), indicating that the effects of KQ and ZQ on lung inflammation are different.13 Also, the ratios of baicalein to baicalin, wogonin to wogonoside, and oroxylin A to oroxylin A 7-O-glucuronide are significantly higher in KQ compared with ZQ.14 However, differences in the levels of six constituents between KQ and ZQ are not sufficient to explain the observed efficacy differences, and the in vivo chemical and distribution differences between them are not clear. Therefore, the chemical basis for the difference in efficacy between KQ and ZQ is not known.
We, therefore, used Q Exactive mass spectrometry-based untargeted metabolomics to investigate systemic chemical differences between KQ and ZQ. We then compared the distribution differences of prototype constituents and metabolites between lungs and colon. Finally, we proposed a differentiation index for the classification and quality control of KQ and ZQ. The study workflow is shown in Fig. 1.
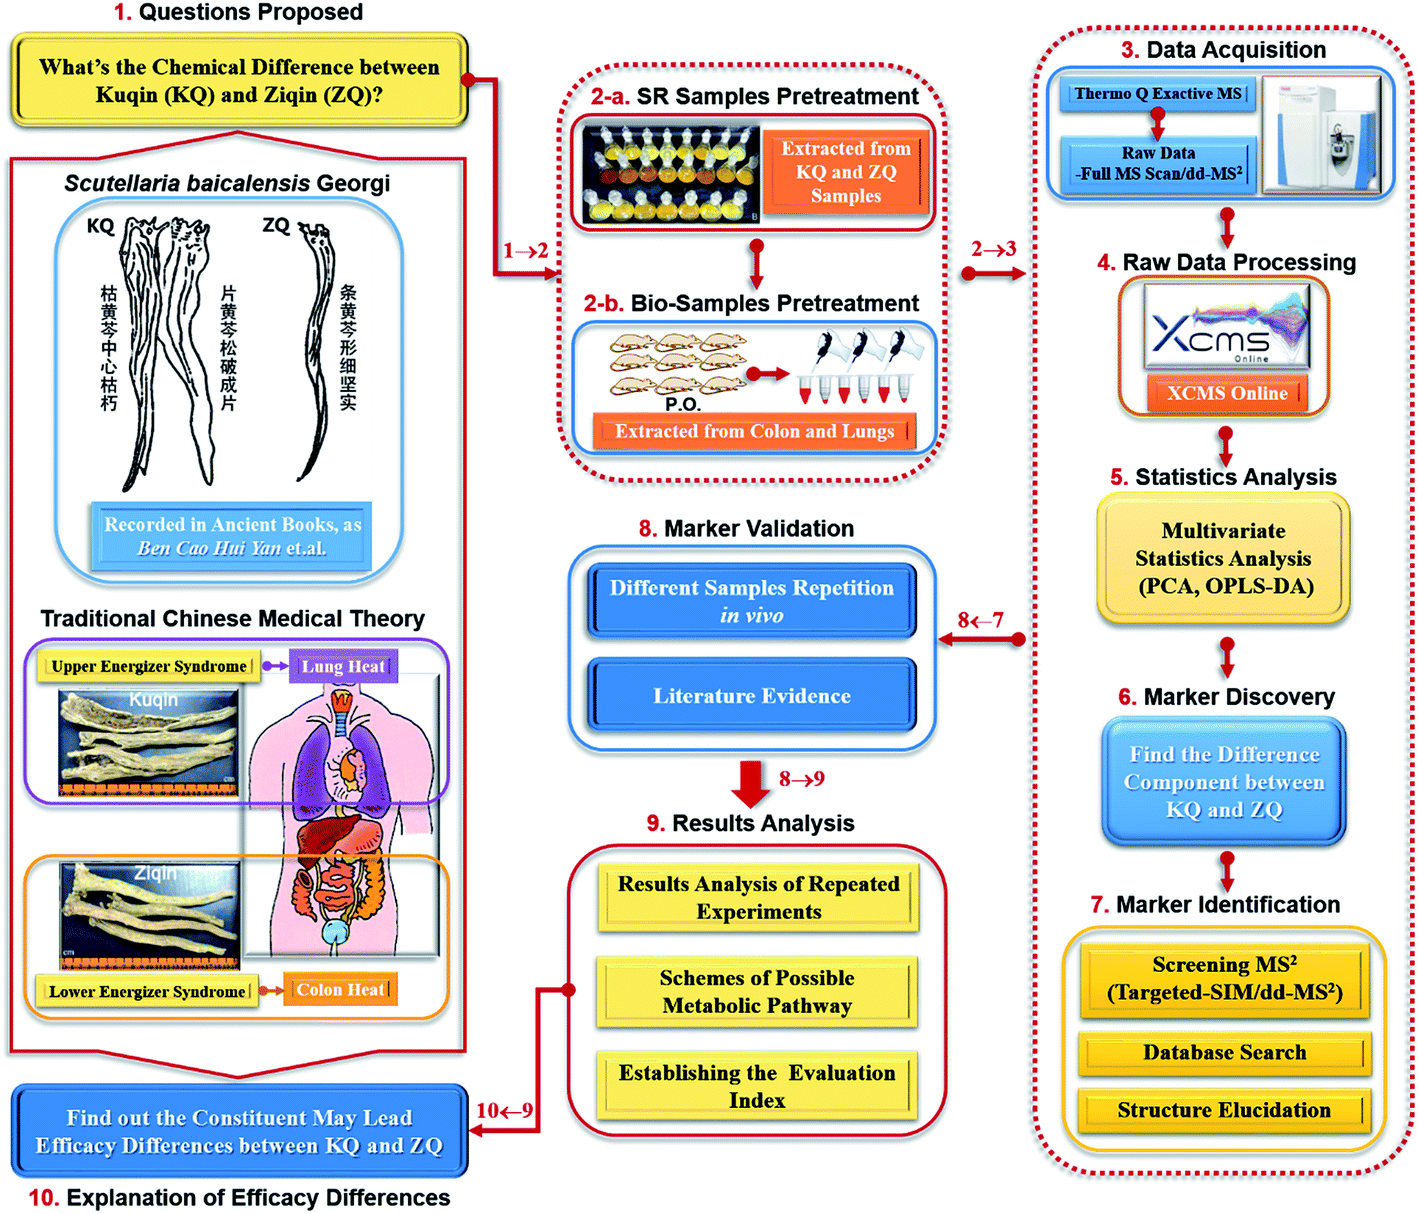 | ||
| Fig. 1 Workflow for Q Exactive MS data analysis, quality marker discovery, identification, validation and samples evaluation. This figure illustrates the key steps in a typical workflow, which comprises preparation of S. baicalensis extract and biological samples, data acquisition, raw data processing, multivariate statistical analysis, marker discovery and structure identification. | ||
Experimental
Chemicals and materials
Baicalein (≥98%, Lot no. 140115), baicalin (≥98%, Lot no. 131219), wogonin (≥98%, Lot no. 140203), wogonoside (≥98%, Lot no. 140403), scutellarein (≥98%, Lot no. 140215), scutellarin (≥98%, Lot no. 130615), oroxylin A (≥98%, Lot no. 131207), oroxylin A 7-O-glucuroside (≥98%, Lot no. 140116), acteoside (≥98%, Lot no. 140322), apigenin (≥98%, Lot no. 130312) and chrysin (≥98%, Lot no. 130402) were purchased from Beijing Tetra Biological Technology Co., Ltd (Beijing, China). Chrysin 6-C-glucoside 8-C-arabinoside (purity 98%, Lot no. CFS201601) and chrysin 6-C-arabinoside 8-C-glucoside (purity 98%, Lot no. CFS201601) were purchased from Wuhan Chemfaces Biochemical Co., Ltd (Wuhan, China). Viscidulin III (purity 98%, no. BBP00429) and 4′-hydroxywogonin (purity 98%, no. BBP00586) were obtained from BioBioPha Co., Ltd (Yunnan, China). HPLC grade methanol and acetonitrile, and LC/MS grade formic acid (Lot no. 136037) were supplied by Fisher Scientific (Fairlawn, NJ, USA). Ammonium acetate (AR. Lot no. F20091117a) was obtained from Sinopharm Chemical Reagent Co., Ltd (Shanghai, China). Ultrapure water was purified using a Milli-Q Water Purification System (Merck Millipore, Germany). All other reagents were of analytical grade or higher. Fifty-one different KQ and ZQ samples were purchased from Chinese druggists in corresponding producing areas (Table S1†). All samples were authenticated by Professor Shao-Qing Cai (School of Pharmaceutical Sciences, Peking University). The voucher specimens were deposited at the Herbarium of Pharmacognosy, School of Pharmaceutical Sciences, Peking University.Instruments and liquid chromatography-tandem mass spectrometry (LC/MS-MS) conditions
MS data were acquired using full scan/data dependent (dd)-MS2 and targeted-selected ion monitoring/data dependence (SIM/dd)-MS2 methods dynamically choosing the top five most abundant precursor ions from the survey scan for higher-energy collisional dissociation (HCD) fragmentation. Full scan data in both positive and negative ion modes were acquired over the range m/z 100–1000 with a mass resolution of 75![[thin space (1/6-em)]](https://www.rsc.org/images/entities/char_2009.gif) 000 (at m/z 200), and the automatic gain control (AGC) was set at 3 × 10⁶ and maximum injection time (IT) was set to 100 ms. Data dependent MS/MS (dd-MS2) scans were acquired in negative ion mode at a resolving power of 17500 (at m/z 200), and AGC was set at 1 × 10⁵ and maximum IT was set to 50 ms. The precursor ions were filtered by the quadrupole which operated in an isolation window of 2 Da, and collision energy was set to 35% normalized collision energy (NCE). The dynamic exclusion time was set to 10 s. Targeted-SIM was performed on selected m/z values at a resolution of 70000 (at m/z 200), with AGC of 5 × 10⁴, maximum IT of 100 ms and a detection window of 2 Da. Data dependent-MS/MS was performed using HCD and the detection was set at a resolution of 35000 (at m/z 200), with AGC of 2 × 10⁵ and maximum IT of 100 ms. NCE was set to 35%, and dynamic exclusion time was 10 s.
000 (at m/z 200), and the automatic gain control (AGC) was set at 3 × 10⁶ and maximum injection time (IT) was set to 100 ms. Data dependent MS/MS (dd-MS2) scans were acquired in negative ion mode at a resolving power of 17500 (at m/z 200), and AGC was set at 1 × 10⁵ and maximum IT was set to 50 ms. The precursor ions were filtered by the quadrupole which operated in an isolation window of 2 Da, and collision energy was set to 35% normalized collision energy (NCE). The dynamic exclusion time was set to 10 s. Targeted-SIM was performed on selected m/z values at a resolution of 70000 (at m/z 200), with AGC of 5 × 10⁴, maximum IT of 100 ms and a detection window of 2 Da. Data dependent-MS/MS was performed using HCD and the detection was set at a resolution of 35000 (at m/z 200), with AGC of 2 × 10⁵ and maximum IT of 100 ms. NCE was set to 35%, and dynamic exclusion time was 10 s.
Preparation of SR extracts
:100, w/v) for 30 min with intermittent mixing. The extract was passed through 16 layers of medical gauze and filtered again through filter paper under vacuum. The filtrate was then concentrated using a rotary vacuum evaporator (BÜCHI Rotavapor R-200, Switzerland) in a 60 °C water bath to obtain an SR extract (0.1 g crude drug per mL). Six batches of KQ (no. 7591-1, 7591-2, 6616, 6620, 70002, and 7486) and ZQ (no. 7593-1, 7593-2, 6619, 6614, 70002, and 7487) extracts were prepared using the above procedure. The HPLC peak areas of baicalin, wogonoside, oroxylin A 7-O-glucuronide, chrysin 6-C-arabinoside 8-C-glucoside, chrysin 6-C-glucoside 8-C-arabinoside, baicalein, wogonin, oroxylin A and chrysin in these extracts are shown in Table S2.†Animal treatment
Animal experiments were conducted in accordance with the Guide for the Care and Use of Laboratory Animals published by the US National Institutes of Health and were approved by the Biomedical Ethical Committee of Peking University (no. SYXK2012-0024). Efforts were made to minimize the number of animals used and their suffering. Male Sprague-Dawley rats (220 ± 20 g) were provided by the Department of Laboratory Animal Science, Peking University Health Science Center (Beijing, China), and they had free access to pellet food and tap water. The rats were maintained in an environmentally controlled breeding room (temperature at 20–25 °C, relative humidity of 50–60%) in a 12 h light–dark cycle throughout the experiments. Each rat was housed in a metabolic cage for 5 days to adapt to the environment before the formal experiment.Rats were randomly divided into KQ, ZQ and blank control groups, with six rats in each group. Rats in the KQ and ZQ groups were orally administrated 10 mL kg−1 KQ and ZQ extract, respectively, and the blank control group was orally administrated purified water. All rats were dosed twice daily for 5 days. Four hours after the last oral administration, the rats were sacrificed. Their lungs and colon were quickly removed, rinsed three times with precooled (4 °C) 0.9% saline solution, drained on filter paper, placed in 5 mL tubes in an ice bath, and then stored at −80 °C.
The animal experiment was repeated six times (E1–E6). In E1–E6, KQ and ZQ group rats were treated with six batches of KQ (no. 7591-1, 7591-2, 6616, 6620, 70002, and 7486) and ZQ (no. 7593-1, 7593-2, 6619, 6614, 70002, and 7487) extracts, respectively.
Pretreatment of lungs and colon samples
All samples were weighed on an electronic balance (AL204, Mettler Toledo), and homogenized in two volumes of cold purified water using an electric homogenizer (IKA T10, Germany) in an ice bath. Five hundred microliters of homogenate were placed in an Eppendorf tube and 1500 μL of 50% methanol and 50% acetonitrile (v/v = 1:1) solution containing 0.1% formic acid was added and vortexed for 3 min. The precipitate and the supernatant were then separated by centrifugation at 20200 (×g) for 20 min at 4 °C. The supernatant (1.5 mL) was evaporated to dryness under a stream of nitrogen gas at 37 °C and re-suspended in 200 μL of methanol. The mixture was vortexed well and centrifuged at 20200 (×g) for 10 min at 4 °C. One hundred and fifty microliters of the supernatant was transferred to an autosampler vial (2 mL, Agilent) with a vial insert (250 μL insert, polypropylene, Agilent) and a 5 μL aliquot was injected into the LC/MS-MS system for analysis.
Multivariate data processing approaches
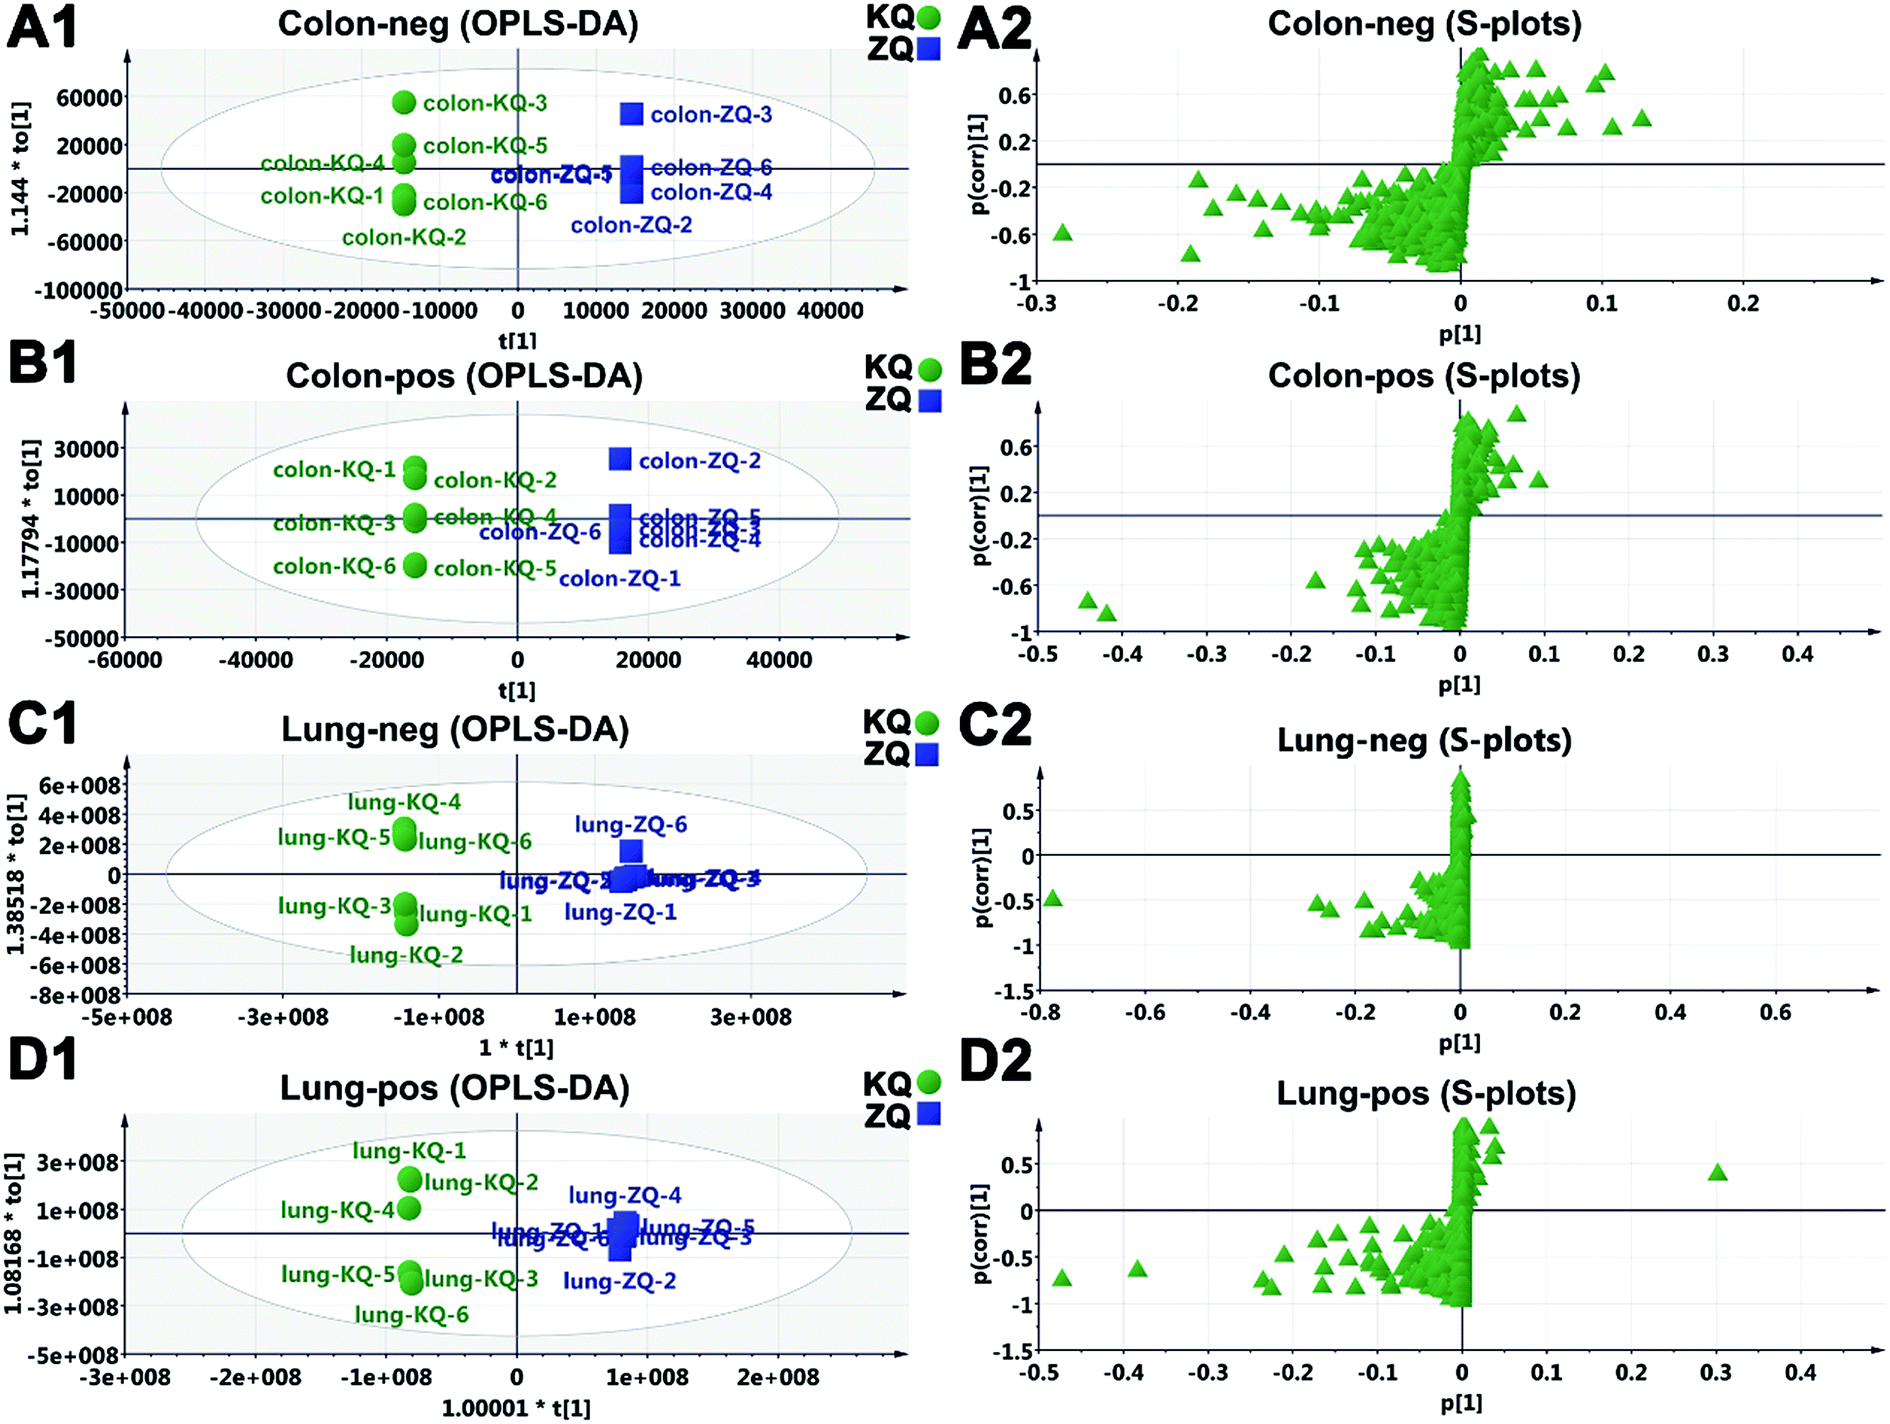 | ||
| Fig. 2 Pattern analysis and scores scatter plots between Kuqin (KQ) and Ziqin (ZQ) groups after oral administration of SR extracts. OPLS-DA in negative (A1) and positive (B1) ion modes in colon; OPLS-DA in negative (C1) and positive (D1) ion modes in lungs; S-plot of the OPLS-DA model in negative (A2) and positive (B2) ion modes in colon; S-plot of the OPLS-DA model in negative (C2) and positive (D2) ion modes in lungs. | ||
Results and discussion
Strategy for structural elucidation
MS analysis and fragmentation mechanisms of various aglycones (such as flavone, flavonol, and flavanone) have been studied.18,19 Nomenclature and the fragmentation behavior of flavonoids are illustrated for flavone C, O-glycosides and flavones (Fig. 3). The 1,3A0, 1,4A0, 1,3B0, and 0,4B0 fragments were often the major fragment ions of flavones, while the 0,3B0 ion was the major peak and characteristic ion for isoflavones.20 The first fragmentation of 6-/8-methoxyflavone involved loss of a CH3˙ free radical to form a strong peak, which in turn lost CO.21 Information on the glycosylation position and the glycosidic linkage position could be obtained from the Target-SIM/dd-MS2 method. All flavonoid O-glycosides were characterized by the loss of 162 Da (hexosyl), 146 Da (deoxyhexosyl), and 176 Da (uronyl), owing to cleavage at the glycosidic O-linkages.22 In flavonoid C-glycosides, the sugar was directly linked to the aglycone via a C–C bond. The MS2 analysis allows the characterization of C-glycosides in both negative and positive ion mode. As far as we know, there are two types of flavonoid C-glycoside: 6-C-glycoside and 8-C-glycoside. 6-C-glycosyl flavonoids lost water molecules more easily than 8-C-glycosyl flavonoids. For flavonoid C-glycosides, the characteristic neutral losses of 90 Da, 120 Da, 134 Da or 60 Da, 90 Da, and 104 Da formed by cross-ring cleavages indicate a hexose or pentose residue.22 Phenylethanoid glycosides were composed of saccharide and phenylethanoid aglycone. Some substituents, such as feruloyl or caffeoyl groups, usually replaced the hydroxyl groups at the 4- or 6-carbon of the central saccharide. The neutral losses of 162 Da, 152 Da, or 146 Da were related to caffeic acid/glucose, phenethanol aglycon, and rhamnose.23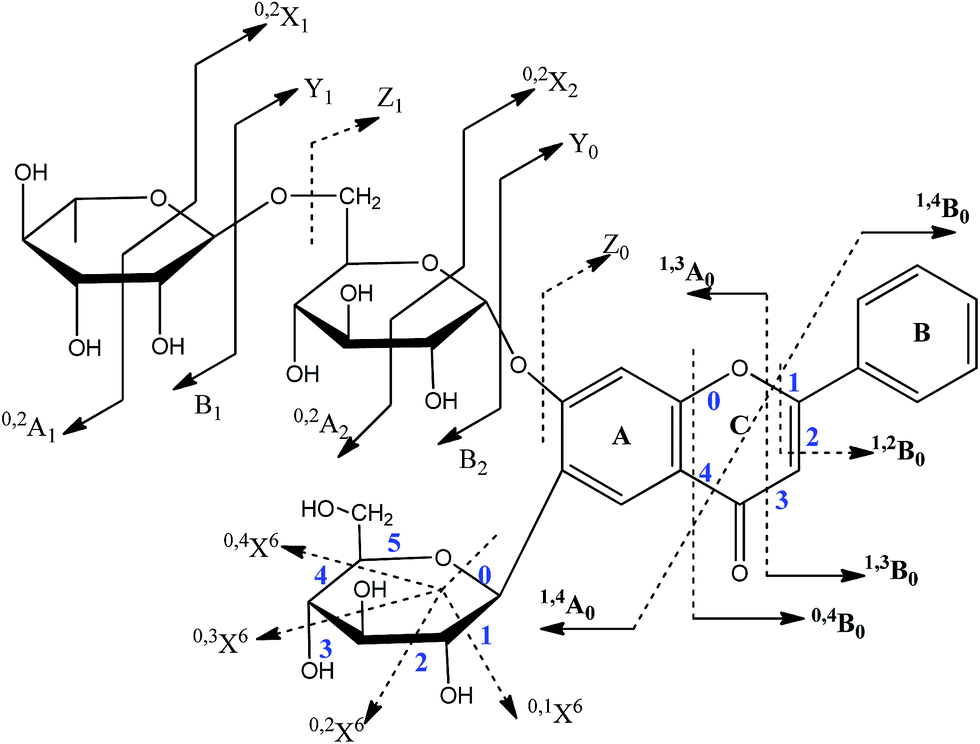 | ||
| Fig. 3 Nomenclature and diagnostic fragmentations of flavonoids. | ||
Identification of prototype SR constituents by comparison with reference compounds
Baicalein (S59), wogonin (S60), oroxylin A (S62), scutellarein (S58), apigenin (S67), chrysin (S78), viscidulin III (S57), 4′-hydroxywogonin (S76), baicalin (S39), wogonoside (S25), oroxylin A 7-O-glucuronide (S21), scutellarin (S22), chrysin 6-C-arabinoside 8-C-glucoside (S40) and chrysin 6-C-glucoside 8-C-arabinoside (S46) were identified in KQ and ZQ using their reference compounds (Table S3†), and their extracted ion chromatograms (EICs) are shown in Fig. S3.†Identification of prototype SR constituents by comparison with the literature
S19 was identified as chrysin 7-O-glucuronide with an [M + H]+ ion at m/z 431.09677 (C21H19O10) and a fragment ion at [M + H − 176]+.26 S24 showed an [M − H]− ion at m/z 477.10424 (C22H21O12) with an MS2 base peak at m/z 286.04889 ([M − H − 176 − CH3˙]˙−)1,3 and A− at m/z 181.01442. It was, therefore, identified as 5,7,2′-trihydroxy-6-methoxyflavanone 7-O-glucuronide.26
Based on [M − H]− ions at m/z 475.08834, m/z 475.08809, m/z 475.08836, and m/z 475.08832, the molecular formulae of S26, S27, S36, and S37 were determined to be C22H20O12. The MS2 spectra of m/z 475.09 showed [aglycone − H]− at m/z 299.06 and [aglycone−H–CH3˙]˙− at m/z 284.03, identifying S37 as 5,7,2′-trihydroxy-6-methoxyflavone 7-O-glucuronide26 and S26, S27, and S36 as its isomers.
Apart from the glycosylation position, the glycan sequence (link type: 1 → 2 or 1 → 6) also has a significant effect on the relative abundances of Y0− (or Y0+), [Y0 − H]− (or [Y0 + H]+), and Y1− (or Y1+) ions.27 The Y0−/Y1− ratio is always larger for a 1 → 2 linkage compared with a 1 → 6 linkage, where Y1− corresponds to loss of 162 Da or 176 Da, indicating that the terminal monosaccharide was glucose or glucuronic acid.28 The Y0−/Y1− ratio of S12 and S32 was larger than that of S30. They were, therefore, tentatively identified as trihydroxyflavone O-glucoside-(1 → 2)-O-glucuronide (S12), trihydroxyflavone O-glucuronide-(1 → 2)-O-glucoside (S32), and dihydroxy-methoxyflavone O-glucuronide-(1 → 6)-O-glucoside (S30), and they are reported in SR for the first time.
S99, S100, S103, S106 and S110 possessed a malonyl hexose group and formed their aglycone ions by losing a characteristic neutral unit of 248 Da in MS2 spectra, and were tentatively identified as dimethoxyflavone O-6′′-malonyl glucoside (S99), trihydroxy-methoxyflavone O-6′′-malonyl glucoside (S100), apigenin 7-6′′-malonyl glucoside or its isomer (S103 and S106), and dihydroxy-methoxyflavone O-6′′-malonyl glucoside (S110),29 and they are reported in SR for the first time. On the basis of a literature survey,21,24,26,30–35 all of the other flavonoid O-glycosides were putatively identified.
The MS2 characteristics of S40 and S46 were a series of fragment ions of [M − H − (60/90/120)]− formed by cross-ring cleavages of the glycosyl moiety and higher abundance of 0,2X6 or 8. S40 showed a higher abundance of [M − H − 90]− ions at m/z 457.11 (0,2X6, 22%) compared with [M − H − 120]− ions at m/z 427.10 (0,2X8, 15%), indicating that a 6-C-pentosyl unit was present. For S46, the [M − H − 120]− ion at m/z 427.10 (0,2X6, 66%) showed higher abundance compared with the [M − H − 90]− ion at m/z 457.11 (0,2X8, 40%), indicating the presence of a 6-C-hexosyl unit.36 Therefore, S40 and S46 were characterized as chrysin 6-C-arabinoside 8-C-glycoside and chrysin 6-C-glycoside 8-C-arabinoside, respectively.
S68, S74, S79, and S81 showed [M − H]− ions at m/z 283.06122, m/z 283.06137, m/z 283.06165, and m/z 283.06149, and their molecular formulae were C16H12O5. In their MS2 spectra, [M − CH3˙]˙− could be observed. They were tentatively identified to be dihydroxy-methoxyflavone (an isomer of S60).
S65 and S73 presented [M − H]− ions at m/z 299.05618 and m/z 299.05616, which indicated that their molecular formulae were C16H12O6. [M − H − CH3˙]˙− ions at m/z 284.0329 were observed in the MS2 spectra of S73 and S65. The [M − H]− ion of S73 fragmented to m/z 151.00368 due to RDA fragmentation of the C ring, which indicated the presence of three hydroxyls and one methoxyl on the A ring. Hence, S73 was identified as trihydroxy-methoxyflavone, with trihydroxyl and methoxyl groups on the A ring. S65 was identified as an isomer of 4′-hydroxy wogonin.
S52, S55, S61, S63, and S69 showed [M − H]− ions at m/z 313.07190, m/z 313.07188, m/z 313.07224, m/z 313.07211, and m/z 313.07190, respectively, which indicated that their molecular formulae were C17H14O6. In their MS2 spectra, [M − H − 2 × CH3˙]˙− ions could be observed. S61 displayed characteristic fragmentation ions at m/z 195.0301 and m/z 117.03396 formed by cleavage of the C ring. Therefore, S61 was tentatively identified as 5,8-dihydroxy-6,7-dimethoxyflavone.24,26 S63 was identified as skullcapflavone I.26 S52, S55, and S69 were tentatively identified as isomers of 6-methoxywogonin (dihydroxy-dimethoxyflavone).
S50 and S72 had [M − H]− ions at m/z 409.02370 and m/z 349.00236 and their molecular formulae were predicted to be C17H14O10S and C15H10O8S, respectively. S50 and S72 produced a neutral loss of 79.9563 Da which was predicted to be SO3. In MS2 spectra, [M − H − 80 − 2 × CH3˙]− at m/z 299.01993 was observed for S50 but not for S72. The [M − H]− of S50 and S72 fragmented into m/z 195.03003 (C9H7O5) and m/z 139.00328 (C6H3O4) due to RDA fragmentation of the C ring, indicating the presence of two hydroxyls and two methoxyls on the A ring and three hydroxyls on the A ring, respectively. Thus, S50 and S72 was tentatively identified as 2′,5,6-trihydroxy-7,8-dimethoxyflavone 6-O-sulfate and baicalein 6-O-sulfate, respectively.30
According to [M − H]− ions at m/z 287.05625 and m/z 287.05622, the molecular formulae of S64 and S71 were determined to be C15H12O6. In their MS2 spectra, [M − H − H2O]− at m/z 269.05 was observed, which indicated that they might have adjacent hydroxyl groups. In addition, the characteristic fragmentation ions of S71 at m/z 243.06630 ([M − H − CO2]−), m/z 225.05594 ([M − H − CO2 − H2O]−), and m/z 179.0350, m/z 125.02432, and m/z 135.04514, generated from RDA fragmentation of the C ring, were detected. Thus, S71 was tentatively identified as eriodictyol,24,37 and S64 was identified as an isomer of eriodictyol. According to the literature,21,24,26,30–35 all of the other aglycones were putatively identified.
Based on the untargeted metabolomics approach, 114 constituents were detected in different amounts between KQ and ZQ. They were tentatively identified, and 35 constituents were identified for the first time in SR. S30 was identified as a new compound named dihydroxy-methoxyflavone O-glucoside-(1 → 6)-O-glucuronide.
As an example (SR samples no. 7591-1 and no. 7593-1), the peak areas of 49 constituents were larger in KQ than in ZQ, and 26 of them in KQ were 2.0–18.2 times as large as those in ZQ. The peak areas of 65 constituents in ZQ were larger than those in KQ, and 39 of them in ZQ were 2.0–18.2 times larger than those in KQ (Fig. S4 and S5†). We also found the peak areas of 68.4% of aglycones were larger in KQ than those in ZQ. In contrast, the peak areas of 72.4% of glycosides in ZQ were larger than those in KQ. Such differences in flavonoid aglycones and glycosides between KQ and ZQ may be responsible for the difference in their efficacy.
The bioactivities of the 114 constituents with differential content between KQ and ZQ were summarized by literature review. Twenty-eight constituents (S1–S5, S17, S19, S21, S22, S24, S25, S39, S40, S45, S46, S56–S60, S62, S63, S66, S67, S71, S77, S78, and S114) have anti-inflammatory activity in vitro and in vivo. Among these, the peak areas of 13 constituents (S2–S5, S24, S62, S63, S66, S67, S71, S77, S78, and S114) in the KQ group were higher than those in the ZQ group. Eleven constituents (S1, S22, S25, S39, S58–S60, S62, S67, S77, and S78) can protect against ALI in rodents, and the peak areas of S62, S67, S77, and S78 in the KQ group were higher than those in the ZQ group. Eight constituents (S1, S25, S39, S59, S60, S62, S67, and S78) are able to alleviate colitis in rodents, and the peak areas of S1, S25, S39, S59, and S60 in the ZQ group were higher than those in the KQ group (Table S4†). These literature-based results indicate that flavonoids in KQ and ZQ are bioactive (30 of 114 constituents are bioactive, 25 of which are flavonoids) and might provide an essential link between KQ, ZQ and inflammatory diseases and might play important beneficial roles in clearing lungs and colon heat symptoms.
Establishment of a differentiation index for KQ and ZQ crude drug samples
According to multivariate statistical analysis (OPLS-DA), the above-identified constituents (VIP ≥ 3) in SR were used to evaluate SR. A differentiation index was established using the ratio of peak areas and applied to 23 ZQ and 28 KQ samples. For known samples, the EIC peak area ratio (PAR) of S40 plus S46 to S78 was above 1.60 in all ZQ samples, but in 75.0% (21/28) of KQ samples the PAR was below 1.60. Similarly, the PAR of S25 to S60 was not more than 0.90 in 89.3% (25/28) of KQ samples, but in only 69.6% (16/23) of ZQ samples was the PAR above 0.90. The PAR of S39 to S71 was the best for distinguishing KQ and ZQ samples (Table S5†). The PAR of S39 to S71 (<9.0) can be used as a differentiation index of 28 KQ samples with prediction accuracy of 96.4%, and a PAR ≥ 9.0 was a differentiation index for 23 ZQ samples with prediction accuracy of 95.7% (Fig. 4). For unknown SR samples, it must be ensured that the degree of difference between KQ and ZQ samples should be satisfactory. As a result, the PAR of S39 (baicalin) to S71 (eriodictyol) could be used as a differentiation index of KQ and ZQ samples with a low false negative rate (3.6%).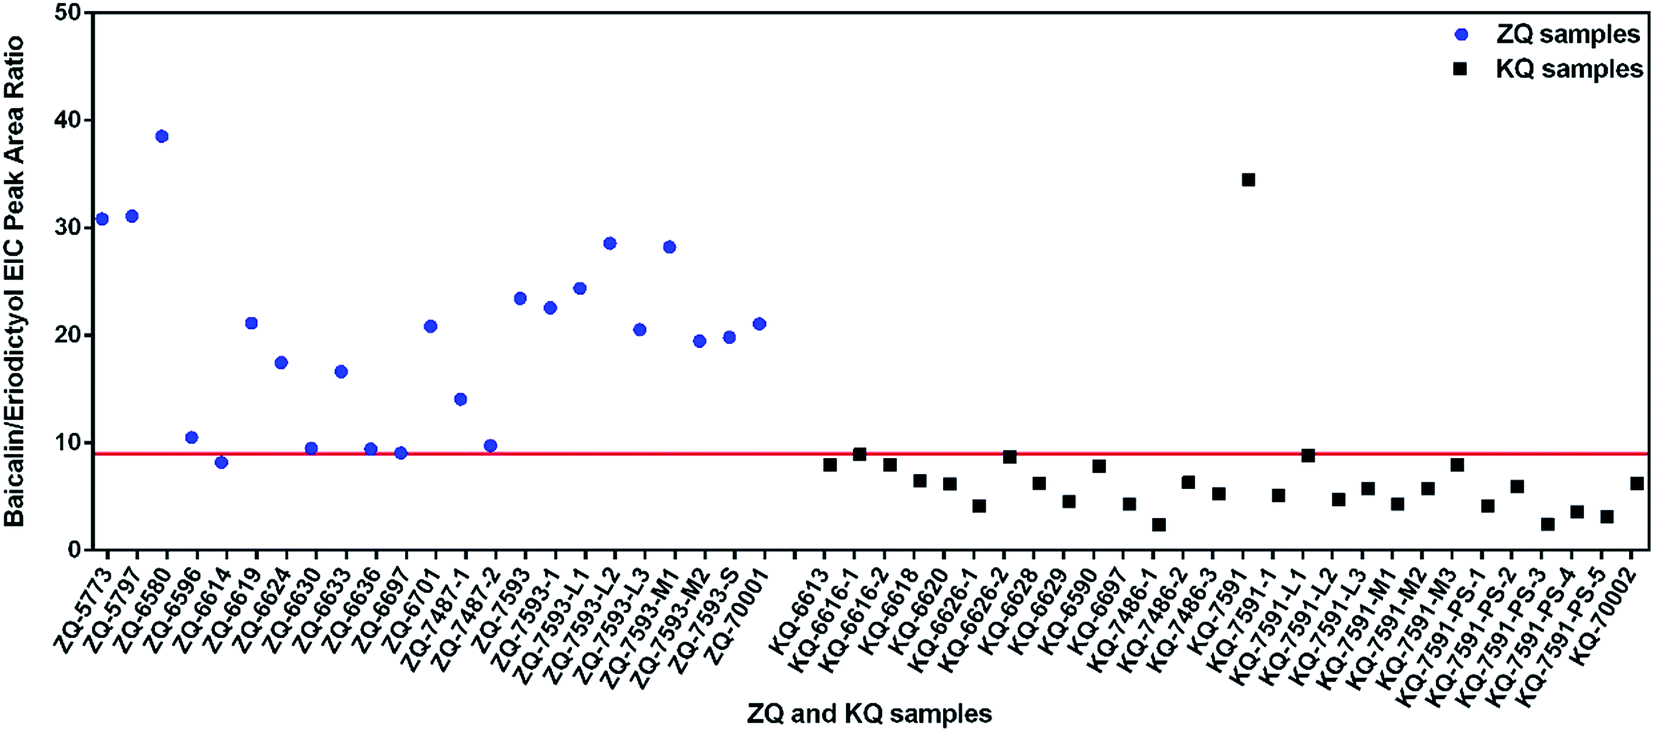 | ||
| Fig. 4 Extracted ion chromatogram peak area ratios of baicalin (S39) to eriodictyol (S71) in KQ and ZQ. | ||
Identification of prototype constituents and metabolites in colon and lungs
Nineteen prototype SR constituents (S13, S21, S25, S39, S40, S46, S57, S59–S62, S64–S67, S71, S76, S78, and S80) and 16 metabolites (M1–M16) were tentatively identified in colon and lungs (Fig. 5). Among them, four prototype constituents (S64, S65, S71, and S80) and 12 metabolites (M5–M16) were identified in vivo for the first time after oral administration of SR extracts. M12 was identified in colon as a new compound named 5,7-dihydroxy-flavonone 6-C-arabinoside. The LC/MS data of KQ and ZQ prototype constituents and metabolites detected in lungs and colon are shown in Tables 1 and 2.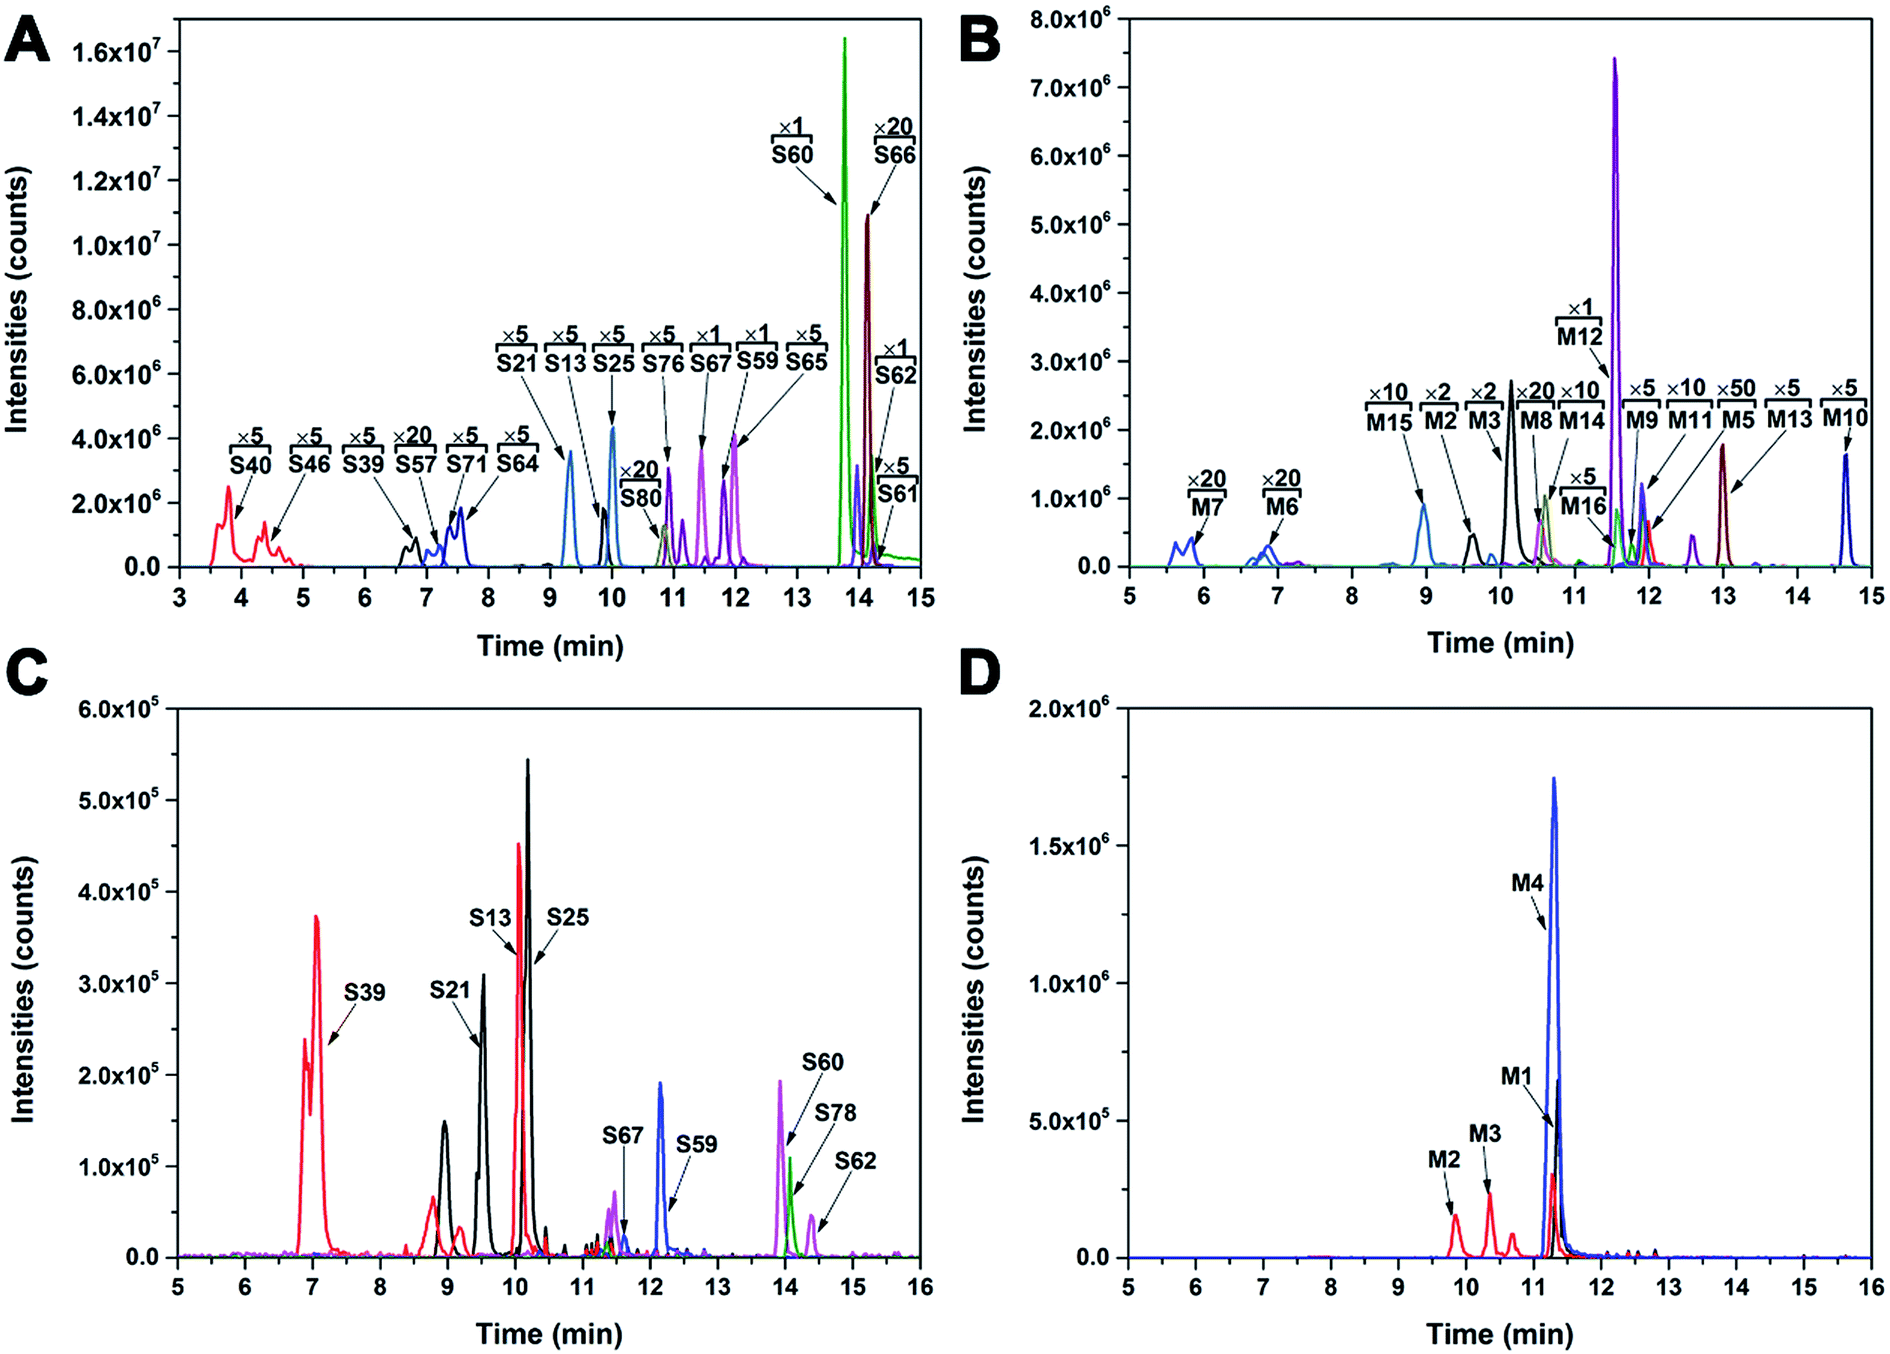 | ||
| Fig. 5 Extracted ion chromatograms of prototype constituents and metabolites in colon and lungs in SR sample (batch no. 7591-1). (A) prototype constituents in colon; (B) metabolites in colon; (C) prototype constituents in lungs; (D) metabolites in lungs (×1, ×2, ×5, ×10, and ×20 denote amplification factor). | ||
| ID | tR (min) | [M − H]−/[M − H]+ m/z | Ion mode | ESI-MS2 m/z (% relative) | Predicted formula | Diff (ppm) | Identification | Structure type |
|---|---|---|---|---|---|---|---|---|
| a #, Identification by comparing the retention time, UV spectra, and MS data with authentic standards. | ||||||||
| S13 | 9.9 | 445.07672 | − | 269.04588 (100) | C21H18O11 | −2.055 | Baicalein 6-O-glucuronide | Flavone O-glycoside |
| #S21 | 9.9 | 459.09278 | − | 283.06142 (31.05), 268.03806 (100) | C22H20O11 | −1.099 | Oroxylin A 7-O-glucuronide | Flavone O-glycoside |
| #S25 | 10.0 | 461.10779 | + | 285.07513 (100), 270.05173 (12) | C22H20O11 | −0.104 | Wogonoside | Flavone O-glycoside |
| #S39 | 6.6 | 445.07698 | − | 269.04602 (100) | C21H18O11 | −1.471 | Baicalin | Flavone O-glycoside |
| #S59 | 11.9 | 269.04525 | − | 269.04612 (100), 251.03522 (3.93), 241.05328 (3.70), 223.04423 (1.16) | C15H10O5 | −1.103 | Baicalein | Flavone |
| #S60 | 13.7 | 283.06062 | − | 269.04105 (20.10), 268.03806 (100), 221.19221 (4.80) | C16H12O5 | −2.037 | Wogonin | Flavone |
| #S62 | 14.1 | 283.06063 | − | 269.04114 (17.87), 268.03809 (100) | C16H12O5 | −2.002 | Oroxylin A | Flavone |
| #S67 | 11.3 | 283.06054 | − | 269.04580 (100), 225.0551 (3.73), 197.06120 (4.06) | C15H10O5 | −1.474 | Apigenin | Flavone |
| #S78 | 13.8 | 253.05005 | − | 253.05109 (100), 209.15492 (2.53) | C15H10O4 | −2.300 | Chrysin | Flavone |
| M1 | 11.1 | 333.00798 | − | 253.05118 (100) | C15H10O7S | 1.602 | Chrysin O-sulfate | Flavone |
| M2 | 10.1 | 349.00292 | − | 269.04642 (100), 225.05632 (1) | C15H10O8S | 1.601 | Apigenin O-sulfate | Flavone |
| M3 | 10.5 | 349.00290 | − | 269.04636 (100), 251.03532 (0.3), 197.06163 (0.1) | C15H10O8S | 1.544 | Baicalein O-sulfate | Flavone |
| M4 | 11.1 | 363.01881 | − | 283.06204 (96), 268.03854 (100) | C16H12O8S | 2.200 | Wogonin O-sulfate | Flavone |
| ID | tR (min) | [M − H]−/[M − H]+ m/z | Ion mode | ESI-MS2 m/z (% relative) | Formula | Diff (ppm) | Identification | Structure type |
|---|---|---|---|---|---|---|---|---|
| a #, Identification by comparing the retention time, UV spectra, and MS data with authentic standards. *, first report of compound after oral administration of SR extracts. | ||||||||
| S13 | 9.9 | 445.07796 | − | 269.04630 (100), 251.03685 (0.6) | C21H18O11 | 0.731 | Baicalein 6-O-glucuronide | Flavone O-glycoside |
| #S21 | 9.1 | 459.09374 | − | 283.06137 (47), 268.03900 (100) | C22H20O11 | 0.992 | Oroxylin A 7-O-glucuronide | Flavone O-glycoside |
| #S25 | 9.8 | 459.09363 | − | 283.06137 (75), 268.03836 (100), 85.02944 (28) | C22H20O11 | 0.752 | Wogonoside | Flavone O-glycoside |
| #S39 | 6.6 | 445.07788 | − | 269.04642 (100), 251.03580 (1), 241.05072 (1), 225.0602 (0.4) | C21H18O11 | 0.552 | Baicalin | Flavone O-glycoside |
| #S40 | 3.7 | 547.14611 | − | 547.14618 (30), 529.13562 (3), 487.12500 (2), 469.11435 (4), 457.11453 (40), 439.10385 (4), 427.10352 (66), 409.09323 (4), 397.09296 (9), 367.08307 (83), 349.07202 (7), 337.07214 (100) | C26H28O13 | 0.724 | Chrysin 6-C-arabinoside 8-C-glucoside | Flavone C-glycoside |
| #S46 | 4.3 | 547.14609 | − | 547.14642 (17), 529.13593 (3), 487.12570 (14), 457.11572 (40), 439.1 (4), 427.10434 (66), 409.09360 (10), 397.09317 (8), 367.08246 (64), 367.08258 (83), 337.07224 (100) | C26H28O13 | 0.687 | Chrysin 6-C-glucoside 8-C-arabinoside | Flavone C-glycoside |
| *,#S57 | 7.0 | 347.07574 | + | 347.07541 (63), 332.05203 (100), 314.04147 (35), 286.04645 (2), 183.02850 (3), 169.01292 (7), 142.02594 (3) | C17H14O8 | −1.164 | Viscidulin III | Flavone |
| #S59 | 11.9 | 271.05975 | + | 271.06064 (100), 253.05013 (1) | C15H10O5 | −1.291 | Baicalein | Flavone |
| #S60 | 13.7 | 283.06125 | − | 268.03845 (100), 283.06198 (3) | C16H12O5 | 0.188 | Wogonin | Flavone |
| *S61 | 14.2 | 313.07193 | − | 313.07281 (13), 298.04904 (58), 283.02554 (100) | C17H14O6 | 0.539 | 5,8-Dihydroxy-6,7-dimethoxyflavone | Flavone |
| 315.08590 | + | 315.08585 (100), 300.06247 (40), 285.03897 (5) | C17H14O6 | −1.316 | ||||
| #S62 | 14.2 | 283.06129 | − | 268.03854 (100), 283.06201 (6) | C16H12O5 | 0.330 | Oroxylin A | Flavone |
| *S64 | 7.7 | 287.05625 | − | 287.05680 (4), 269.04592 (3), 225.05589 (1), 215.03502 (9), 161.02478 (17), 125.02463 (100) | C15H12O6 | 0.483 | Isomer of S71 (tetrahydroxyflavanone) | Flavanone |
| *S65 | 12.1 | 299.05618 | − | 299.005698 (5), 284.03354 (100) | C16H12O6 | 0.230 | Trihydroxy-methoxyflavone | Flavone |
| S66 | 14.5 | 373.09289 | − | 358.07050 (22), 343.04675 (100), 328.02344 (23) | C19H18O8 | −0.002 | Scullcapflavone II | Flavone |
| #S67 | 11.4 | 269.04552 | − | 269.04636 (100), 241.05702 (4), 225.05634 (8), 197.06136 (12) | C15H10O5 | −0.099 | Apigenin | Flavone |
| *S71 | 7.2 | 287.05622 | − | 161.02477 (25), 125.02464 (100) | C15H12O6 | 0.379 | Eriodictyol | Flavanone |
| *S76 | 10.7 | 299.05611 | − | 299.05692 (13), 284.03333 (100) | C16H12O6 | −0.004 | 4′-Hydroxy wogonin | Flavone |
| *S80 | 10.7 | 301.07175 | − | 301.07175 (10), 286.04865 (100), 283.02444 (4), 258.05128 (3), 255.23323 (10), 185.06107 (5), 181.01100 (8), 18000667 (16), 166.99010 (14), 165.99078 (45), 152.01132 (5), 137.99594 (9), 119.05031 (8), 110.00878 (8) | C16H14O6 | −0.038 | Trihydroxy-methoxyflavanone | Flavanone |
| M2 | 9.5 | 349.00297 | − | 269.04642 (100), 225.05632 (1) | C15H10O8S | 1.744 | Apigenin O-sulfate | Flavone |
| M3 | 10.1 | 349.00301 | − | 269.04636 (100), 251.03532 (0.3), 197.06163 (0.1) | C15H10O8S | 1.859 | Baicalein O-sulfate | Flavone |
| *M5 | 11.9 | 267.03054 | − | 239.03534 (100), 211.04114 (1.14), 136.98807 (13.85) | C15H8O5 | 2.409 | 6,7-Dehydrobaicalein | Flavone |
| *M6 | 6.9 | 285.04126 | − | 285.04123 (100), 151.08276 (1) | C15H10O6 | 2.802 | Isomer of hydroxylation of baicalin | Flavone |
| *M7 | 5.8 | 285.04125 | − | 285.04132 (100), 241.05148 (20), 199.04099 (15), 151.00395 (66) | C15H10O6 | 2.767 | Hydroxylation of baicalin | Flavone |
| *M8 | 10.5 | 327.05179 | − | — | C17H12O7 | 2.336 | Isomer of kanzakiflavone I | Flavone |
| *M9 | 11.8 | 329.06732 | − | 329.06747 (5), 314.04416 (97), 299.02051 (100), 271.02548 (4), 227.03551 (11), 199.04102 (4) | C17H14O7 | 1.957 | Trihydroxy-dimethoxyflavone | Flavone |
| *M10 | 14.6 | 343.08295 | − | 328.05975 (27), 313.03641 (100), 298.01288 (14), 271.01740 (2), 209.00899 (0.5), 194.99405 (2) | C18H16O7 | 1.819 | Dihydroxy-trimethoxyflavone | Flavone |
| *M11 | 11.8 | 359.07789 | − | 344.05469 (60), 329.03140 (100), 314.00830 (2), 311.02087 (2), 301.03745 (6), 297.00381 (2), 285.04218 (1), 242.02234 (1), 198.03300 (3), 154.99925 (2) | C18H16O8 | 1.808 | Trihydroxy-trimethoxyflavone | Flavone |
| *M12 | 11.4 | 387.10951 | − | 369.09869 (0.4), 351.08817 (1), 327.08862 (4), 309.08862 (3), 297.07758 (100), 269.08313 (5), 255.06735 (2), 191.03568 (5) | C20H20O8 | 2.504 | 2,5-Dihydroxyflavonone 6-C-arabinoside | Flavone C-glycoside |
| *M13 | 12.9 | 389.08871 | − | 374.06497 (100), 359.04156 (84), 344.01788 (25), 316.02380 (4), 300.02774 (7), 285.00543 (1), 183.03052 (1) | C19H18O9 | 2.325 | Trihydroxy-tetramethoxyflavone | Flavone |
| *M14 | 10.5 | 419.13573 | − | 329.10379 (17), 299.09293 (100), 257.08221 (32), 197.04630 (9), 195.77 (2), 167.03508 (55) | C21H24O9 | 2.325 | Phlorizin c | Flavone C-glycoside |
| *M15 | 8.8 | 445.07863 | − | 269.04626 (100), 197.06091 (0.6), 171.04570 (0.7), 113.02453 (2) | C21H18O11 | 2.237 | Trihydroxyflavone O-glucuronide | Flavone O-glycoside |
| *M16 | 11.5 | 469.04555 | − | 389.08881 (19), 374.06531 (100), 359.04163 (25) | C19H18O12S | 1.983 | Trihydroxy-tetramethoxyflavone O-sulfate | Flavone |
M1 exhibited [M − H]− ions at m/z 333.00798, which indicated that its molecular formula was C15H10O7S. In MS2 spectra, a base peak [M − H − 80]− ion at m/z 253.05118 was observed, tentatively identifying M1 as chrysin O-sulfate. M2 and M3 showed [M − H]− ions at m/z 349.00, which indicated that their molecular formulae were C15H10O8S. In their MS2 spectra, [M − H − 80]− ions at m/z 269.05 were observed, and [M − H − 80 − H2O]− ions could only be observed in M3. These data indicate that M3 contains adjacent hydroxyl groups. Thus, M3 was identified as baicalein O-sulfate, and M2 was identified as apigenin O-sulfate. M4 presented [M − H]− ions at m/z 363.01881 (C16H12O8S) with MS2 peaks at m/z 283.06204 ([M − H − 80]−) and m/z 268.03584 ([M − H − 80 −CH3˙]˙−); therefore, M4 was identified as wogonin O-sulfate. M5 showed [M − H]− ions at m/z 267.03054 (C15H7O5) with MS2 peaks at m/z 239.03534 ([M − H − CO]−) and m/z 211.04114 ([M − H − 2 × CO]−), and it was identified as 6,7-dehydrobaicalein. M6 and M7 showed [M − H]− ions at m/z 285.0412 (C15H9O6), which was 16 Da larger than that of baicalein or scutellarein (C15H9O5), thus they were hydroxylated baicalein or scutellarein. M7 showed 0,3A− ions at m/z 151.00395 resulting from cross-ring cleavage of the C-ring. Thus, M7 was tentatively identified as tetrahydroxyflavone. M6 was tentatively identified as hydroxylated baicalein or its isomer. M8 was identified as an isomer of kanzakiflavone I with [M − H]− ions at m/z 327.05179 (C17H11O7). By the same method, M9, M10, M11, M13, M15, and M16 were tentatively identified as trihydroxy-dimethoxyflavone, dihydroxy-trimethoxyflavone, trihydroxy-trimethoxyflavone, trihydroxy-tetramethoxyflavone, trihydroxyflavone O-glucuronide, and trihydroxy-tetramethoxyflavone O-sulfate, respectively.
M12 exhibited [M − H]− ions at m/z 387.10951, which suggested that its molecular formula was C20H20O8. M12 yielded 0,3X6− and 0,2X6− fragment ions at m/z 327.08862 ([M − H − 60]−) and 297.07758 ([M − H − 90]−), suggesting they were formed by cross-ring cleavages in a pentose residue. The [M − H − H2O]− ion at m/z 369.09869 indicated that the eliminated water was produced from the 2′′-hydroxyl of the sugar and the 5- or 7-hydroxyl of the aglycone,22 and [M − H − 2 × H2O]− at m/z 351.08817 suggested that the 3-hydroxyl and 2-hydrogen of flavanone were eliminated. Thus, M12 was tentatively identified as a new compound, 2,5-dihydroxyflavonone 6-C-arabinoside.
M14 showed [M − H]− ions at m/z 419.13573, which suggested that its molecular formula was C21H24O9. In MS2 spectra, 0,3X6− and 0,2X6− fragment ions at m/z 329.10379 ([M − H − 90]−) and 299.09293 ([M − H − 120]−) were observed, which are characteristic of cross-ring cleavages in a hexose residue. Furthermore, from the fragment ions at m/z 197.04630 and m/z 167.03580, its aglycone should contain three hydroxyl groups. Thus, M14 was tentatively identified to be phlorizin c and is reported as a metabolite of SR for the first time.
Exploring the basis of KQ and ZQ efficacy in vivo
To investigate the effect of KQ and ZQ samples from different places and batches on the distribution of chemical constituents in colon and lungs, the distribution experiment was repeated six times. The EIC peak areas of 13 prototype constituents (S13, S21, S25, S39, S40, S46, S59–S62, and S65–S67) and six metabolites (M2, M3, M9, M10, M12, M14) in the colon of KQ and ZQ groups are shown in Table S6.† Similarly, the EIC peak areas of nine prototype constituents (S13, S21, S25, S39, S59, S60, S62, S67, and S78) and four metabolites (M1–M4) in the lungs of KQ and ZQ groups are shown in Table S7.† From the results of these six separate experiments, we found that the peak areas of seven constituents (S21, S25, S39, S59, S60, S62, and S67) were larger in colon than in lungs. Furthermore, in colon, the peak areas of S25, S39, S60, and S62 in the ZQ groups were larger than those in the KQ groups. In lungs, the peak areas of S25, S39, S60, and S62 in the ZQ groups were smaller than those in the KQ groups.The peak area of baicalin (S39) in KQ groups was 0.66 times as large as that in ZQ groups for SR samples. In colon, the baicalin peak area in KQ groups was 0.86-fold as large as that in ZQ groups, but in lungs its peak area in KQ groups was 1.13 times as large as that in ZQ groups. The peak area of wogonoside (S25) of KQ groups was 0.66 times as large as that in ZQ groups in SR samples. In colon, the wogonoside peak area in KQ groups was 0.91 times as large as that in ZQ groups, but in lungs its peak area in KQ groups was 1.13 times as large as that in ZQ groups. In SR samples, the peak areas of wogonin (S60) and oroxylin A (S62) of KQ groups were 1.27 and 1.68 times as large as those in ZQ groups. In colon, the peak areas of wogonin (S60) and oroxylin A (S62) in KQ groups were 0.80 and 0.70 times as large as those in ZQ groups. In lungs, their peak areas in KQ groups were 1.50 and 1.08 times as large as those in ZQ groups (Fig. 6). In SR and colon, the peak areas of baicalin (S39) and wogonoside (S25) in KQ groups were smaller than those in ZQ groups, but in lungs their peak areas in KQ groups were larger than those in ZQ groups. Similarly, in SR and lungs, the peak areas of wogonin (S60) and oroxylin A (S62) in KQ groups were larger than those in ZQ groups, but in colon their peak areas in KQ groups were smaller than those in ZQ groups. In addition, the peak areas of wogonoside, baicalin, wogonin, and oroxylin A in colon were larger than those in lungs (Fig. 6). Therefore, these results indicate that metabolic conversion might occur in vivo, and that these constituents were much more easily distributed in colon than in lungs.
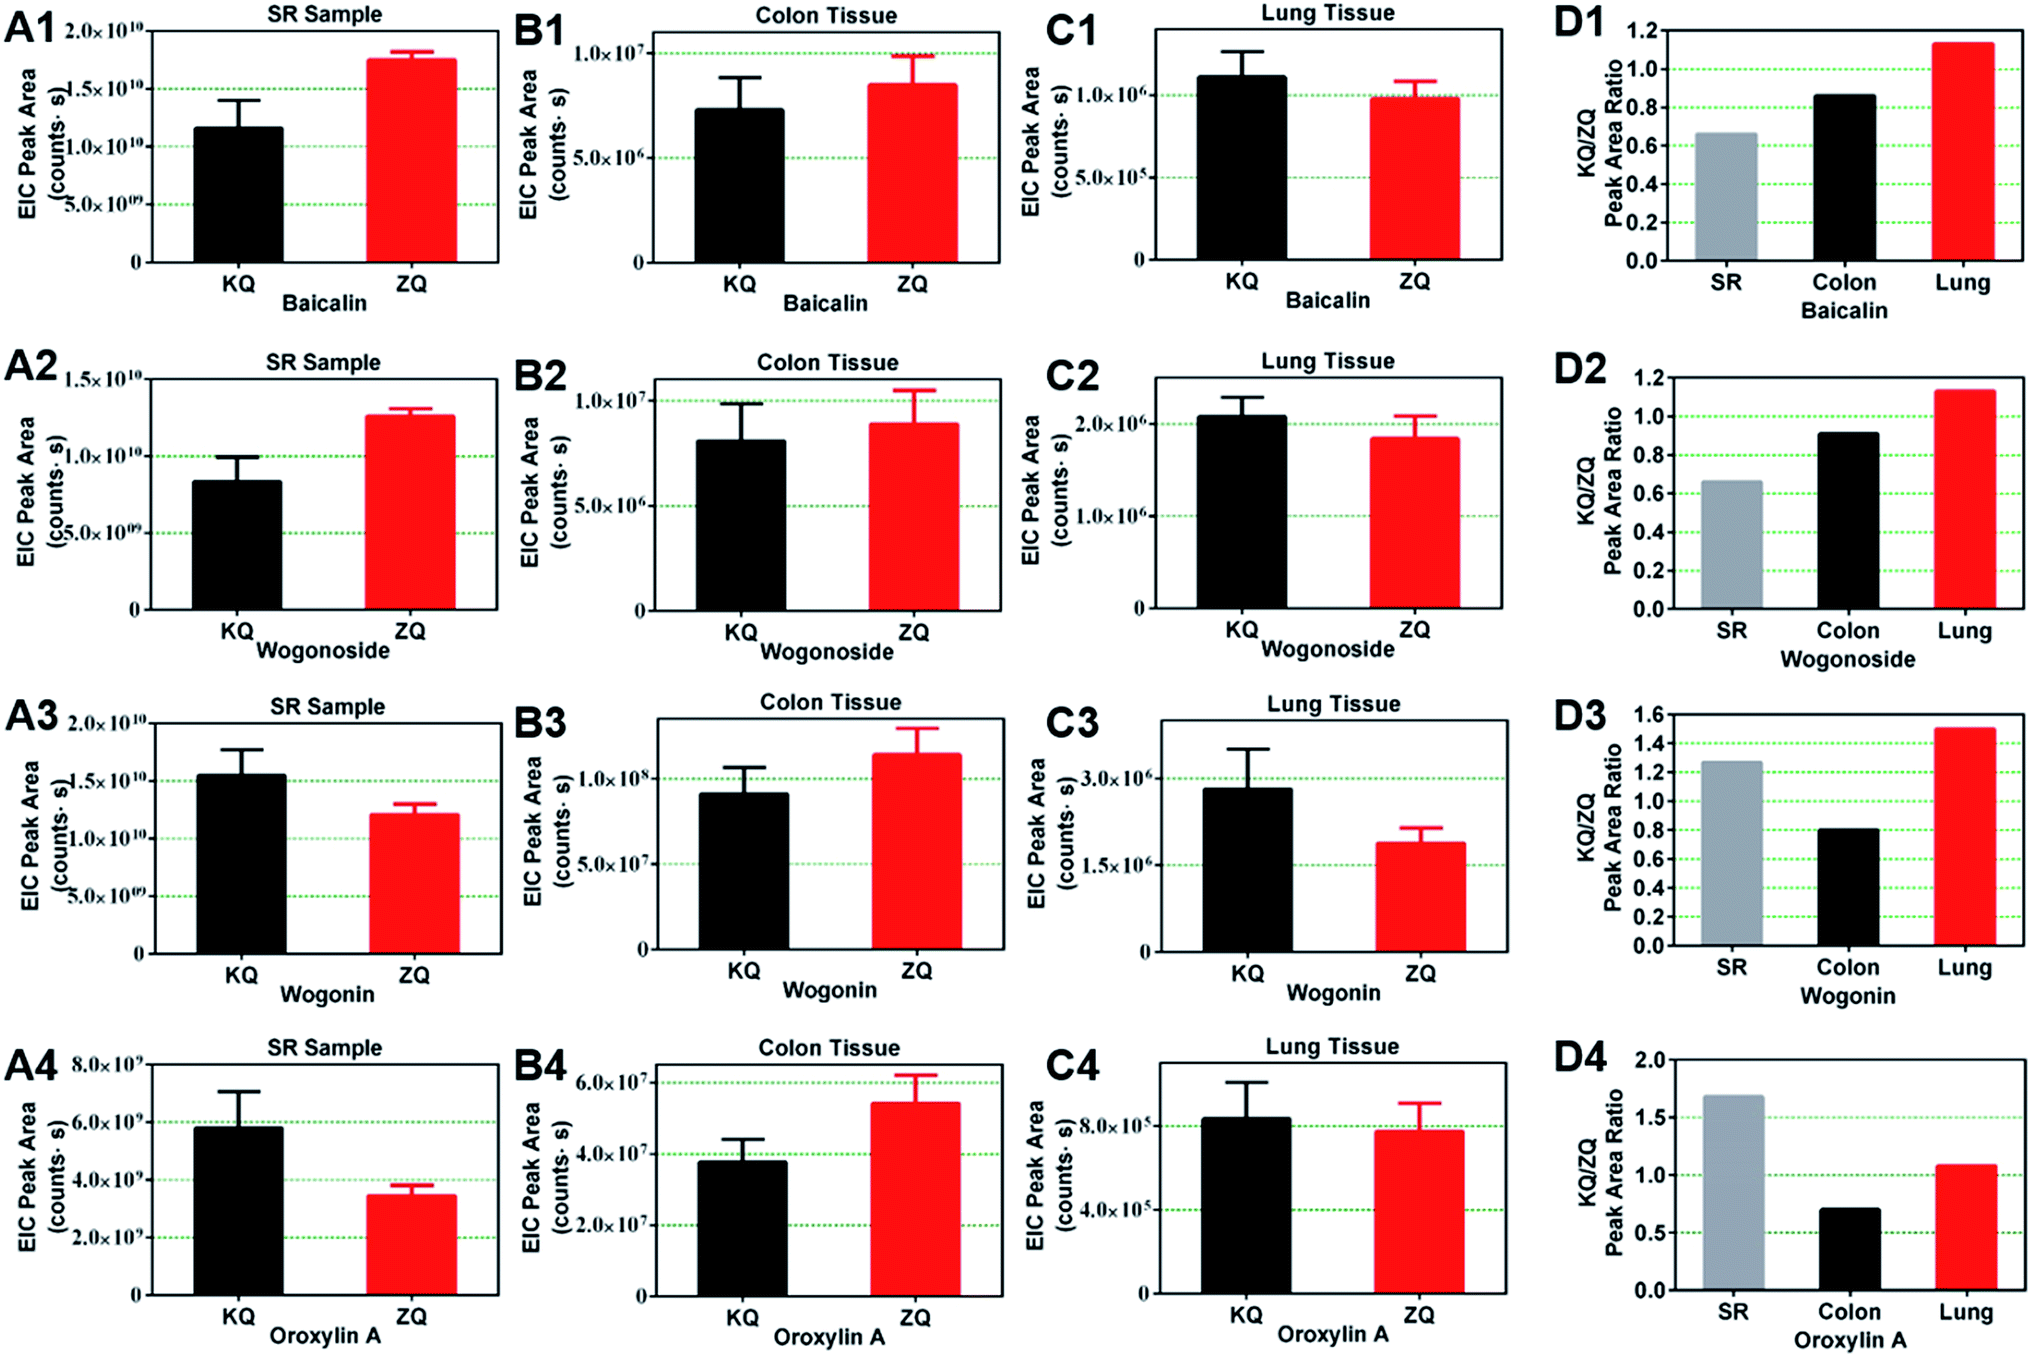 | ||
| Fig. 6 The peak areas of baicalin, wogonoside, wogonin, and oroxylin A in crude drug, colon, and lungs samples. A1–A4, the peak areas in SR samples; B1–B4, the peak areas in colon; C1–C4, the peak areas in lungs; D1–D4, the peak area ratios of KQ group to ZQ group in SR samples, colon, and lungs samples for the four constituents. Values are expressed as the mean ± SEM. SR samples, n = 6 in each group; colon and lungs samples, n = 36 in each group containing six repeated experiments (n = 6 in each experiment). | ||
These constituents had various biological activities. Baicalin (S39) and baicalein (S59) alleviate gut inflammation via the Cdx2/Pxr pathway in a mouse model of chemical colitis.40 Wogonoside (S25)41 and wogonin (S60)42 can protect against dextran sulfate sodium (DSS)-induced experimental colitis in mice. Oroxylin A (S62) can also inhibit colitis-associated carcinogenesis.43 In animal models of pulmonary inflammation, baicalin attenuates air embolism-induced ALI in rats.44 Baicalein can protect against LPS-induced ALI in rats.3 and wogonoside (S25) has a protective effect on LPS-induced ALI in mice.6 ALI induced in mice by LPS was inhibited by wogonin (S60) via reduction of Akt phosphorylation and RhoA activation.45 Oroxylin A (S62) can attenuate cigarette smoke-induced lung inflammation46 and rescue LPS-induced ALI in rodents.47
The constituents, S25, S39, S60, and S62, might work together to produce differences in efficacy, such that ZQ is used to treat lower energizer colon heat symptoms and KQ is effective for clearing upper energizer lung heat syndrome. Furthermore, they may be the basis for KQ and ZQ acting on colon and lungs. The characteristic distribution of S39 (baicalin), S25 (wogonoside), S60 (wogonin), and S62 (oroxylin A) in colon and lungs might be the basis for the different efficacies of KQ and ZQ. All of the above may cause the differences in efficacy between KQ and ZQ.
The relationship among constituents after oral administration of KQ and ZQ extracts
After oral administration, multiple components in KQ and ZQ samples might undergo intestinal flora metabolism, extensive first-pass effect and enterohepatic circulation, which may significantly contribute to the differences in exposure of these components between colon and lungs. Therefore, clarifying KQ and ZQ component metabolic pathways could contribute significantly to our understanding of metabolism in vivo and help us to interpret the distribution differences of S39, S25, S60, and S62 between colon and lungs. It will also provide a theoretical basis to explain efficacy differences between KQ and ZQ.It is well known that the main reactions involved in the metabolism of xenobiotics are: (de)hydroxylation, (de)methylation, (de)glycosylation, glucuronidation, and sulfation. For example, in vivo metabolic reactions of S39 include methylation, hydroxylation, glucuronidation, sulfation and their composite reactions.48 Based on these processes, 22 constituents might be converted into the constituents S21, S25, S39, S40, S46, S59, S60, and S62 via metabolic reactions.
As can be seen from Fig. 7, baicalin (S39) can be metabolized by intestinal microflora into baicalein (S59) and oroxylin A (S62).1,49 Oroxylin A 7-O-glucuronide (S21) can also be converted into S62 and S39 by deglucuronidation and demethylation reactions.50 Wogonoside (S25) can be metabolized to wogonin (S60) by fecal microflora.51 S25 can be metabolized to scutellarin (S17) by demethylation and then transformed into scutellarein (S58) by deglucuronidation. Dehydroxylation and hydroxylation reactions of flavonoids have also been reported.52–54 S60 might be converted into S58 and chrysin (S78) via demethylation and dehydroxylation reactions. S40 and S46 were deglycosylated to S48 and S101, and eventually converted into S78.55 S78 might be metabolized to S67 and S59 by hydroxylation.54
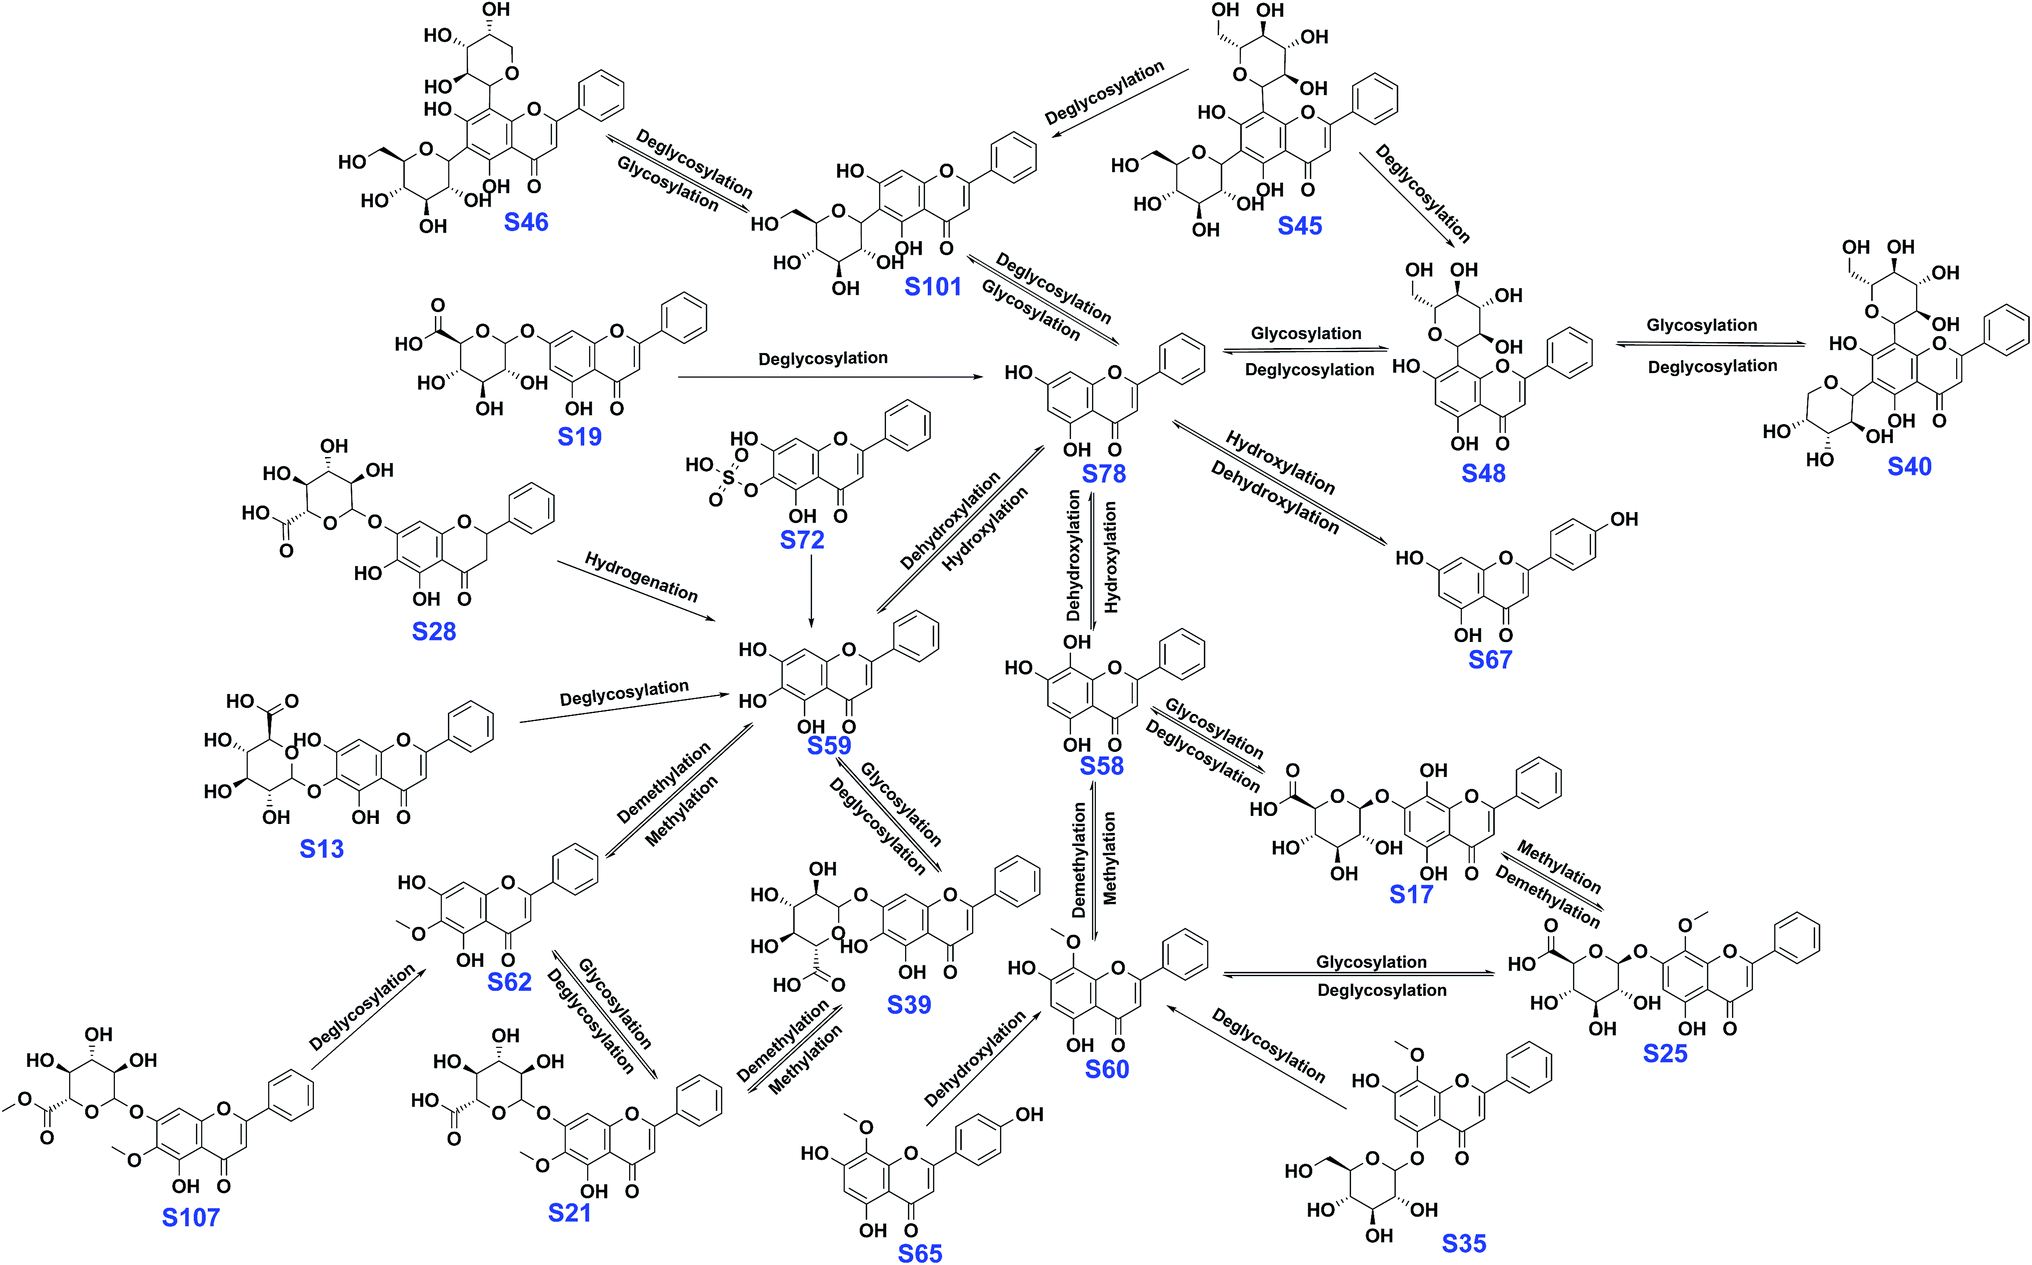 | ||
| Fig. 7 Proposed metabolic pathways of the main active constituents after oral administration of SR extracts to rats. | ||
Conclusions
To determine chemical differences and in vivo distribution differences between KQ and ZQ, we applied a metabolomics approach. A total of 114 constituents with peak area differences between KQ and ZQ crude drug samples were tentatively identified. Thirty-five of these constituents were identified in SR for the first time. Nineteen prototype constituents and 16 SR metabolites with peak area differences between KQ and ZQ were identified in colon and lungs. Among these, four constituents and 12 metabolites were reported for the first time after oral administration of SR extracts. According to the results of six repeated in vivo experiments, baicalin, wogonoside, oroxylin A 7-O-glucuroside, chrysin 6-C-arabinoside 8-C-glucoside, chrysin 6-C-glucoside 8-C-arabinoside, baicalein, wogonin, and oroxylin A were indicated to be the basis of KQ and ZQ efficacy. The differences in distribution among baicalin, wogonoside, wogonin and oroxylin A, which have anti-inflammation activities in colon and lungs, provides a theoretical foundation for explaining the differences in efficacy between KQ and ZQ. In addition, the PAR of baicalin/eriodictyol was proposed as a differentiation index for the quality control or classification of KQ (ratio <9.0 with 96.4% prediction accuracy) and ZQ (ratio ≥ 9.0 with 95.7% prediction accuracy) crude drug samples with good prediction accuracy. These results may provide a theoretical explanation for the differences in efficacy between KQ and ZQ.Conflicts of interest
There are no conflicts to declare.Acknowledgements
This study was supported by the National Nature Science Foundation (No. 81373921, No. 81573593, and No. 81673395), the National Science and Technology Major Project for Major New Drugs Innovation and Development of China (No. 2013ZX09508104). Thanks are due to Yu-Zhen Zhou, Jie Liu for assistance with the experiments and to Yao-Li Li, Chao-Qun Wang, Qiu-Yan Zhang for valuable discussions.References
- L. Du, D. Qian, E. Shang, P. Liu, S. Jiang, J. Guo, S. Su, J. Duan, J. Xu and M. Zhao, J. Ethnopharmacol., 2015, 169, 156–162 CrossRef CAS PubMed.
- H. L. Chung, G. G. Yue, K. F. To, Y. L. Su, Y. Huang and W. H. Ko, World J. Gastroenterol., 2007, 13, 5605–5611 CrossRef PubMed.
- C. Tsai, Y. Lin, H. Wang and T. Chou, J. Ethnopharmacol., 2014, 153, 197–206 CrossRef CAS PubMed.
- K. Huang, C. Chen, C. Hsu, M. Li, H. Chang, S. Tsai and S. Chu, Am. J. Chin. Med., 2008, 36, 301–311 CrossRef CAS PubMed.
- J. Yao, D. Pan, Y. Zhao, L. Zhao, J. Sun, Y. Wang, Q. D. You, T. Xi, Q. L. Guo and N. Lu, Immunology, 2014, 143, 241–257 CrossRef CAS PubMed.
- L. Zhang, Y. Ren, C. Yang, Y. Guo, X. Zhang, G. Hou, X. Guo, N. Sun and Y. Liu, Inflammation, 2014, 37, 2006–2012 CrossRef CAS PubMed.
- P. Yang, S. Jin, L. Che, S. He and Y. Yuan, China J. Chin. Mater. Med., 2014, 39, 3359–3362 Search PubMed.
- D. H. Kim, M. A. Hossain, Y. J. Kang, J. Y. Jang, Y. J. Lee, E. Im, J. H. Yoon, H. S. Kim, H. Y. Chung and N. D. Kim, Int. J. Oncol., 2013, 43, 1652–1658 CrossRef CAS PubMed.
- Z. Zhang, W. Liua, L. Zhuang, J. Wang and S. Zhang, Iran. J. Pharm. Res., 2013, 12, 399–409 CAS.
- T. Hong, G. B. Jin, S. Cho and J. C. Cyong, Planta Med., 2002, 68, 268–271 CrossRef CAS PubMed.
- W. Jiang, G. S. Seo, Y. Kim, D. H. Sohn and S. H. Lee, Arch. Pharmacal Res., 2015, 38, 1127–1137 CrossRef CAS PubMed.
- G. Latella, R. Sferra, A. Vetuschi, G. Zanninelli, A. D. Angelo, V. Catitti, R. Caprilli and E. Gaudio, Eur. J. Clin. Invest., 2008, 38, 410–420 CrossRef CAS PubMed.
- Q. Chen, C. Wang, Z. Yang, Q. Tang, H. Tan, X. Wang and S. Cai, Chin. J. Nat. Med., 2017, 15, 515–524 Search PubMed.
- W. Dan, J. Yajie, L. Yan, Z. Lin, C. Shaoqing, S. Mingying, Y. Pengfei, Z. Yuying and W. Xuan, China J. Chin. Mater. Med., 2012, 37, 426–433 Search PubMed.
- H. Gowda, J. Ivanisevic, C. H. Johnson, M. E. Kurczy, H. P. Benton, D. Rinehart, T. Nguyen, J. Ray, J. Kuehl and B. Arevalo, Anal. Chem., 2014, 86, 6931–6939 CrossRef CAS PubMed.
- A. H. Zhang, P. Wang, H. Sun, G. L. Yan, Y. Han and X. J. Wang, Mol. BioSyst., 2013, 9, 2259–2265 RSC.
- P. Emond, S. Mavel, N. Aïdoud, L. Nadal-Desbarats, F. Montigny, F. Bonnet-Brilhault, C. Barthélémy, M. Merten, P. Sarda and F. Laumonnier, Anal. Bioanal. Chem., 2013, 405, 5291–5300 CrossRef CAS PubMed.
- G. C. Justino, C. M. Borges and M. H. Florêncio, Rapid Commun. Mass Spectrom., 2009, 23, 237–248 CrossRef CAS PubMed.
- N. Fabre, I. Rustan, E. de Hoffmann and J. Quetin-Leclercq, J. Am. Soc. Mass Spectrom., 2001, 12, 707–715 CrossRef CAS PubMed.
- R. J. Hughes, T. R. Croley, C. D. Metcalfe and R. E. March, Int. J. Mass Spectrom., 2001, 210, 371–385 CrossRef.
- V. M. Malikov and M. P. Yuldashev, Chem. Nat. Compd., 2002, 38, 358–406 CrossRef CAS.
- F. Cuyckens and M. Claeys, J. Mass Spectrom., 2004, 39, 1–15 CrossRef CAS PubMed.
- M. Qi, A. Xiong, F. Geng, L. Yang and Z. Wang, J. Sep. Sci., 2012, 35, 1470–1478 CrossRef CAS PubMed.
- X. Shang, X. He, X. He, M. Li, R. Zhang, P. Fan, Q. Zhang and Z. Jia, J. Ethnopharmacol., 2010, 128, 279–313 CrossRef CAS PubMed.
- C. Gousiadou, A. Karioti, J. Heilmann and H. Skaltsa, Phytochemistry, 2007, 68, 1799–1804 CrossRef CAS PubMed.
- X. Qiao, R. Li, W. Song, W. Miao, J. Liu, H. Chen, D. Guo and M. Ye, J. Chromatogr. A, 2016, 1441, 83–95 CrossRef CAS PubMed.
- K. Ablajan, Z. Abliz, X. Y. Shang, J. M. He, R. P. Zhang and J. G. Shi, J. Mass Spectrom., 2006, 41, 352–360 CrossRef CAS PubMed.
- F. Cuyckens, Y. L. Ma, G. Pocsfalvi and M. Claeysi, Analysis, 2000, 28, 888–895 CrossRef CAS.
- M. Martinez-Vazquez, R. Estrada-Reyes, A. Martinez-Laurrabaquio, C. Lopez-Rubalcava and G. Heinze, J. Ethnopharmacol., 2012, 141, 908–917 CrossRef CAS PubMed.
- H. Wang, J. Cao, S. Xu, D. Gu, Y. Wang and S. Xiao, J. Chromatogr. A, 2013, 1315, 107–117 CrossRef CAS PubMed.
- J. Han, M. Ye, M. Xu, J. Sun, B. Wang and D. Guo, J. Chromatogr. B: Anal. Technol. Biomed. Life Sci., 2007, 848, 355–362 CrossRef CAS PubMed.
- O. N. Seo, G. Kim, Y. Kim, S. Park, S. W. Jeong, S. J. Lee, J. S. Jin and S. C. Shin, J. Funct. Foods, 2013, 5, 1741–1750 CrossRef CAS.
- M. Arfan, G. A. Khan, N. Shafi, A. R. Khan and I. R. Khan, J. Chem. Soc. Pak., 2003, 25, 348–356 CAS.
- W. Lin, S. Liu and B. Wu, Aust. J. Chem., 2013, 25, 3799–3805 CAS.
- M. Ye, S. Liu, Z. Jiang, Y. Lee, R. Tilton and Y. Cheng, Rapid Commun. Mass Spectrom., 2007, 21, 3593–3607 CrossRef CAS PubMed.
- A. Singh, S. Kumar, V. Bajpai, T. J. Reddy, K. B. Rameshkumar and B. Kumar, Rapid Commun. Mass Spectrom., 2015, 29, 1095–1106 CrossRef CAS PubMed.
- J. Zhang, H. Park, J. Kim, G. Hong, A. Nagappan, K. Park and G. Kim, Am. J. Chin. Med., 2014, 42, 465–483 CrossRef CAS PubMed.
- M. A. Farag, S. T. Sakna, N. M. El-fiky, M. M. Shabana and L. A. Wessjohann, Phytochemistry, 2015, 119, 41–50 CrossRef CAS PubMed.
- F. Imperato, Chem. Ind., 1979, 525–526 CAS.
- W. Dou, S. Mukherjee, H. Li, M. Venkatesh and H. Wang, PLoS One, 2012, 7, e36075 CAS.
- Y. Sun, Y. Zhao, J. Yao, L. Zhao, Z. Wu, Y. Wang, D. Pan, H. Miao, Q. Guo and N. Lu, Biochem. Pharmacol., 2015, 94, 142–154 CrossRef CAS PubMed.
- J. Yao, L. Zhao, Q. Zhao, Y. Zhao, Y. Sun, Y. Zhang, H. Miao, Q. You, R. Hu and Q. Guo, Cell Death Dis., 2014, 5, e1283 CrossRef CAS PubMed.
- X. Yang, F. Zhang, Y. Wang, M. Cai and Q. Wang, Inflammatory Bowel Dis., 2013, 19, 1990–2000 Search PubMed.
- M. H. Li, K. L. Huang, S. Y. Wu, C. W. Chen, H. C. Yan, K. Hsu, C. W. Hsu, S. H. Tsai and S. J. Chu, Br. J. Pharmacol., 2009, 157, 244–251 CrossRef CAS PubMed.
- Y. C. Yeh, C. P. Yang, S. S. Lee, C. T. Horng, H. Y. Chen, T. H. Cho, M. L. Yang, C. Y. Lee, M. C. Li and Y. H. Kuan, J. Pharm. Pharmacol., 2016, 68, 257–263 CrossRef CAS PubMed.
- J. Li, D. Tong, J. Liu, F. Chen and Y. Shen, Int. Immunopharmacol., 2016, 40, 524 CrossRef CAS PubMed.
- T. L. Tseng, M. F. Chen, M. J. Tsai, Y. H. Hsu, C. P. Chen and T. J. Lee, PLoS One, 2012, 7, e47403 CAS.
- J. Zhang, W. Cai, Y. Zhou, Y. Liu, X. Wu, Y. Li, J. Lu and Y. Qiao, J. Chromatogr. B: Anal. Technol. Biomed. Life Sci., 2015, 985, 91–102 CrossRef CAS PubMed.
- J. Xu, M. Zhao, D. Qian, E. Shang, S. Jiang, J. Guo, J. Duan and L. Du, J. Ethnopharmacol., 2014, 153, 368–374 CrossRef CAS PubMed.
- L. Zhang, C. Li, G. Lin, P. Krajcsi and Z. Zuo, AAPS J., 2011, 13, 378–389 CrossRef CAS PubMed.
- H. Trinh, S. Jang, M. Han, H. Kawk, N. Baek and D. Kim, Biomol. Ther., 2009, 17, 211–216 CrossRef CAS.
- M. Zhao, L. Du, J. Tao, D. Qian and E. Shang, J. Agric. Food Chem., 2014, 62, 11441–11448 CrossRef CAS PubMed.
- A. Gradolatto, M. C. Canivenc-Lavier, J. P. Basly, M. H. Siess and C. Teyssier, Drug Metab. Dispos., 2004, 32, 58–65 CrossRef CAS PubMed.
- A. Braune and M. Blaut, Gut Microbes, 2016, 7, 216–234 CrossRef CAS PubMed.
- Y. Zhang, X. Tie, B. Bao, X. Wu and Y. Zhang, Br. J. Nutr., 2007, 97, 484 CrossRef CAS PubMed.
Footnote |
| † Electronic supplementary information (ESI) available. See DOI: 10.1039/c7ra10705f |
| This journal is © The Royal Society of Chemistry 2017 |