DOI:
10.1039/C7RA10736F
(Paper)
RSC Adv., 2017,
7, 54696-54705
Ammonia promoted barium sulfate catalyst for dehydration of lactic acid to acrylic acid†
Received
28th September 2017
, Accepted 24th November 2017
First published on 29th November 2017
Abstract
The dehydration of lactic acid (LA) to acrylic acid over ammonia promoted barium sulfate was studied under various conditions. Interplanar spacing (d) calculated from the enlarged (121) diffraction peak of XRD patterns with the Bragg equation is influenced by preparation conditions, which determines the acid–base properties of the prepared barium sulfate. The present work focused on the preparation conditions such as alkaline agents, pH values and calcination temperatures, which affected the d value. It was found that aqueous ammonia was used as an alkaline agent at pH = 5 to synthesize barium sulfate with an appropriate d value, which displayed an excellent catalytic performance for LA dehydration to acrylic acid. In the presence of the prepared barium sulfate with an appropriate d value, the dehydration reaction of lactic acid proceeded efficiently, with 100% lactic acid conversion and ∼82% acrylic acid selectivity. The unprecedented catalytic performance is due to a balance between acidic sites and basic sites existing on the surface of the prepared catalyst. The catalyst is very stable for at least 24 h. The deactivation catalyst can be easily regenerated as it is calcined at 500 °C for 10 h under the air atmosphere.
Introduction
Lactic acid (LA) derived from biomass attracts the interest of academia and industrial areas, since it is accessible, low cost and rich.1–5 For example, starch,6 cellulose,7,8 hemicellulose,9 lignin,10 wheat straw,11 glucose,12 xylose13 and glycerol7,14–16 can be efficiently converted to LA via microbiology fermentation and catalytic conversion. LA can be used as a platform molecule to produce a variety of chemicals such as acrylic acid (AA), 2,3-pentanedione, acetaldehyde, propionic acid, pyruvic acid and poly-lactic acid under the given conditions including appropriate catalysts and reaction conditions.17–20 For example, AA can be obtained through the dehydration reaction of LA,21,22 2,3-pentanedione obtained through the intermolecular condensation reaction of two molecules of LA,23–26 acetaldehyde obtained through a decarbonylation/decarboxylation reaction of LA,27–30 and propionic acid obtained through the deoxygenation reaction of LA.31,32 Among these chemicals, AA has the biggest market demand (around 5.1 × 10⁶ t per year), and is widely used to produce acrylates, dispersants, polymers, and so on.33,34
Research on AA obtained from LA via dehydration has made much progress in recent years. Hydroxyapatites offered an excellent activity for the dehydration of LA to AA, and were intensively investigated by several groups.35–37 These studies focused on regulating the acid–base properties of catalysts by controlling the preparation conditions of catalysts, and disclosing the relation between acid–base properties and activity. Modified zeolites with alkali metals were also investigated, and viewed as a class of catalytic materials with a high efficiency.18,22,38–42 Besides, oxysalt materials of alkali earth metals and rare earth metal such as BaSO4,43 Ba2P2O7,44 Sr2P2O7 modified with H3PO4 (ref. 45) and LaPO4 (ref. 46) were also used to catalyze the dehydration of LA, and offered an excellent performance. Very recently, the work47 has investigated the formation of BaSO4 crystal defects by means of ultrasound treatment and measured the acidity density of BaSO4 crystals with different defects, which related to catalytic activity for the dehydration of LA to AA. However, the research on constructing microstructure (especially in crystal defect) of catalyst by synthesis conditions and the relation between microstructure of catalyst and activity of catalytic dehydration of LA, is very rare.
Accordingly, we tried to construct the crystal defect of BaSO4 by controlling aqueous solution acid–base property and calcination temperature in the present work, and measured the acidity density and basicity density by NH3-TPD and CO2-TPD, respectively. Based on these characterizations, we further disclosed the relationship between acid–base property of catalyst induced by crystal defects and activity.
Results and discussion
Characterization
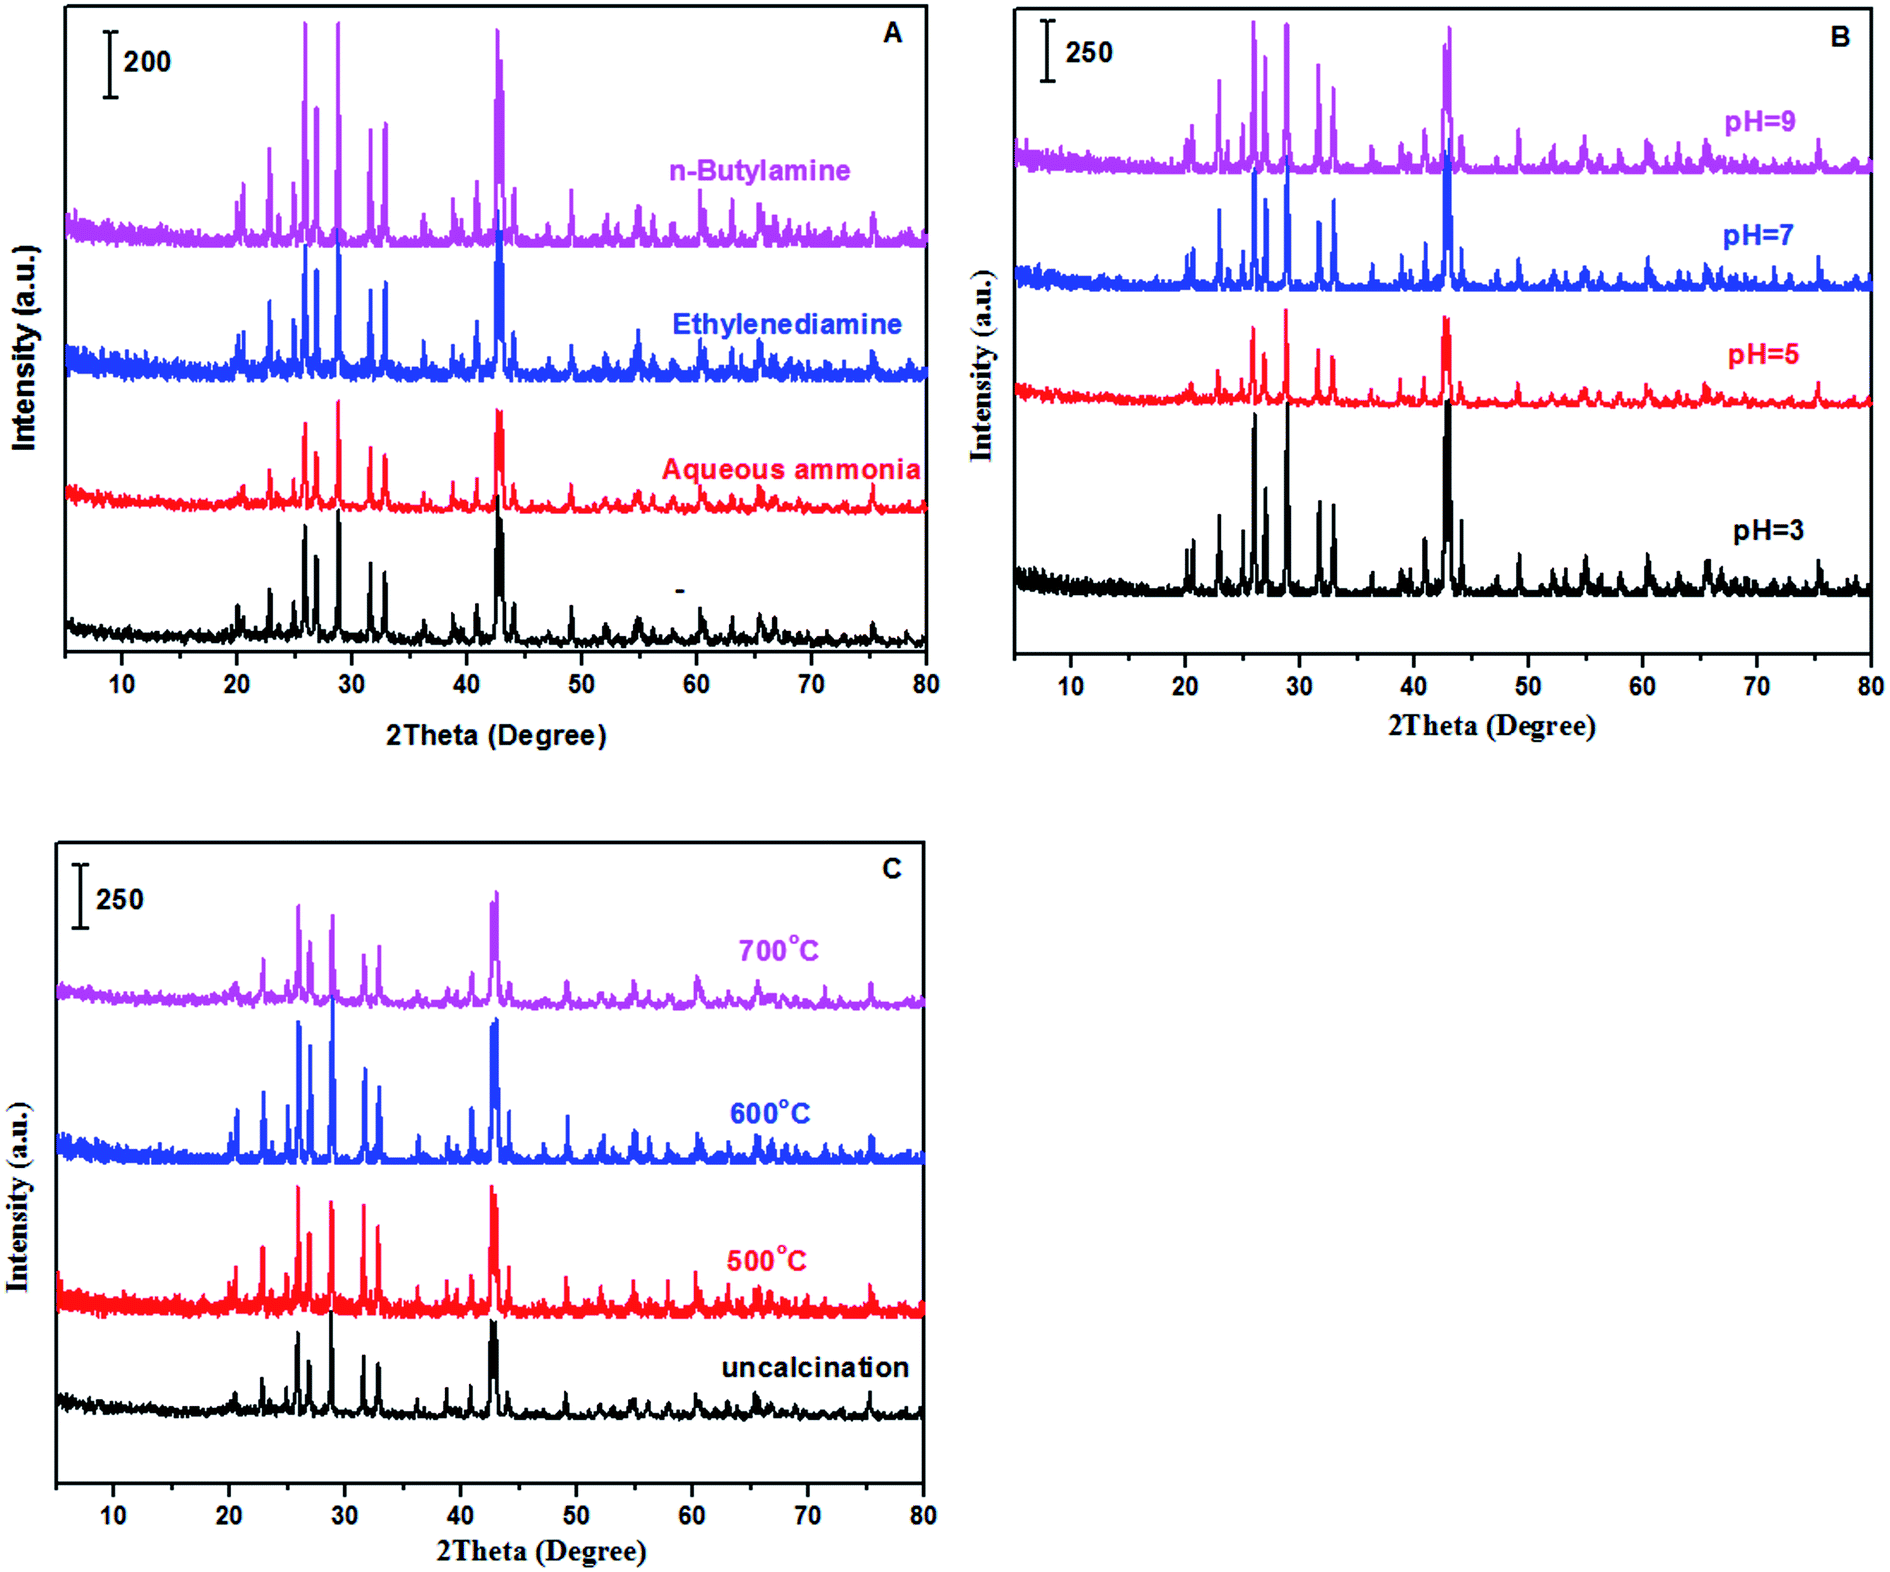
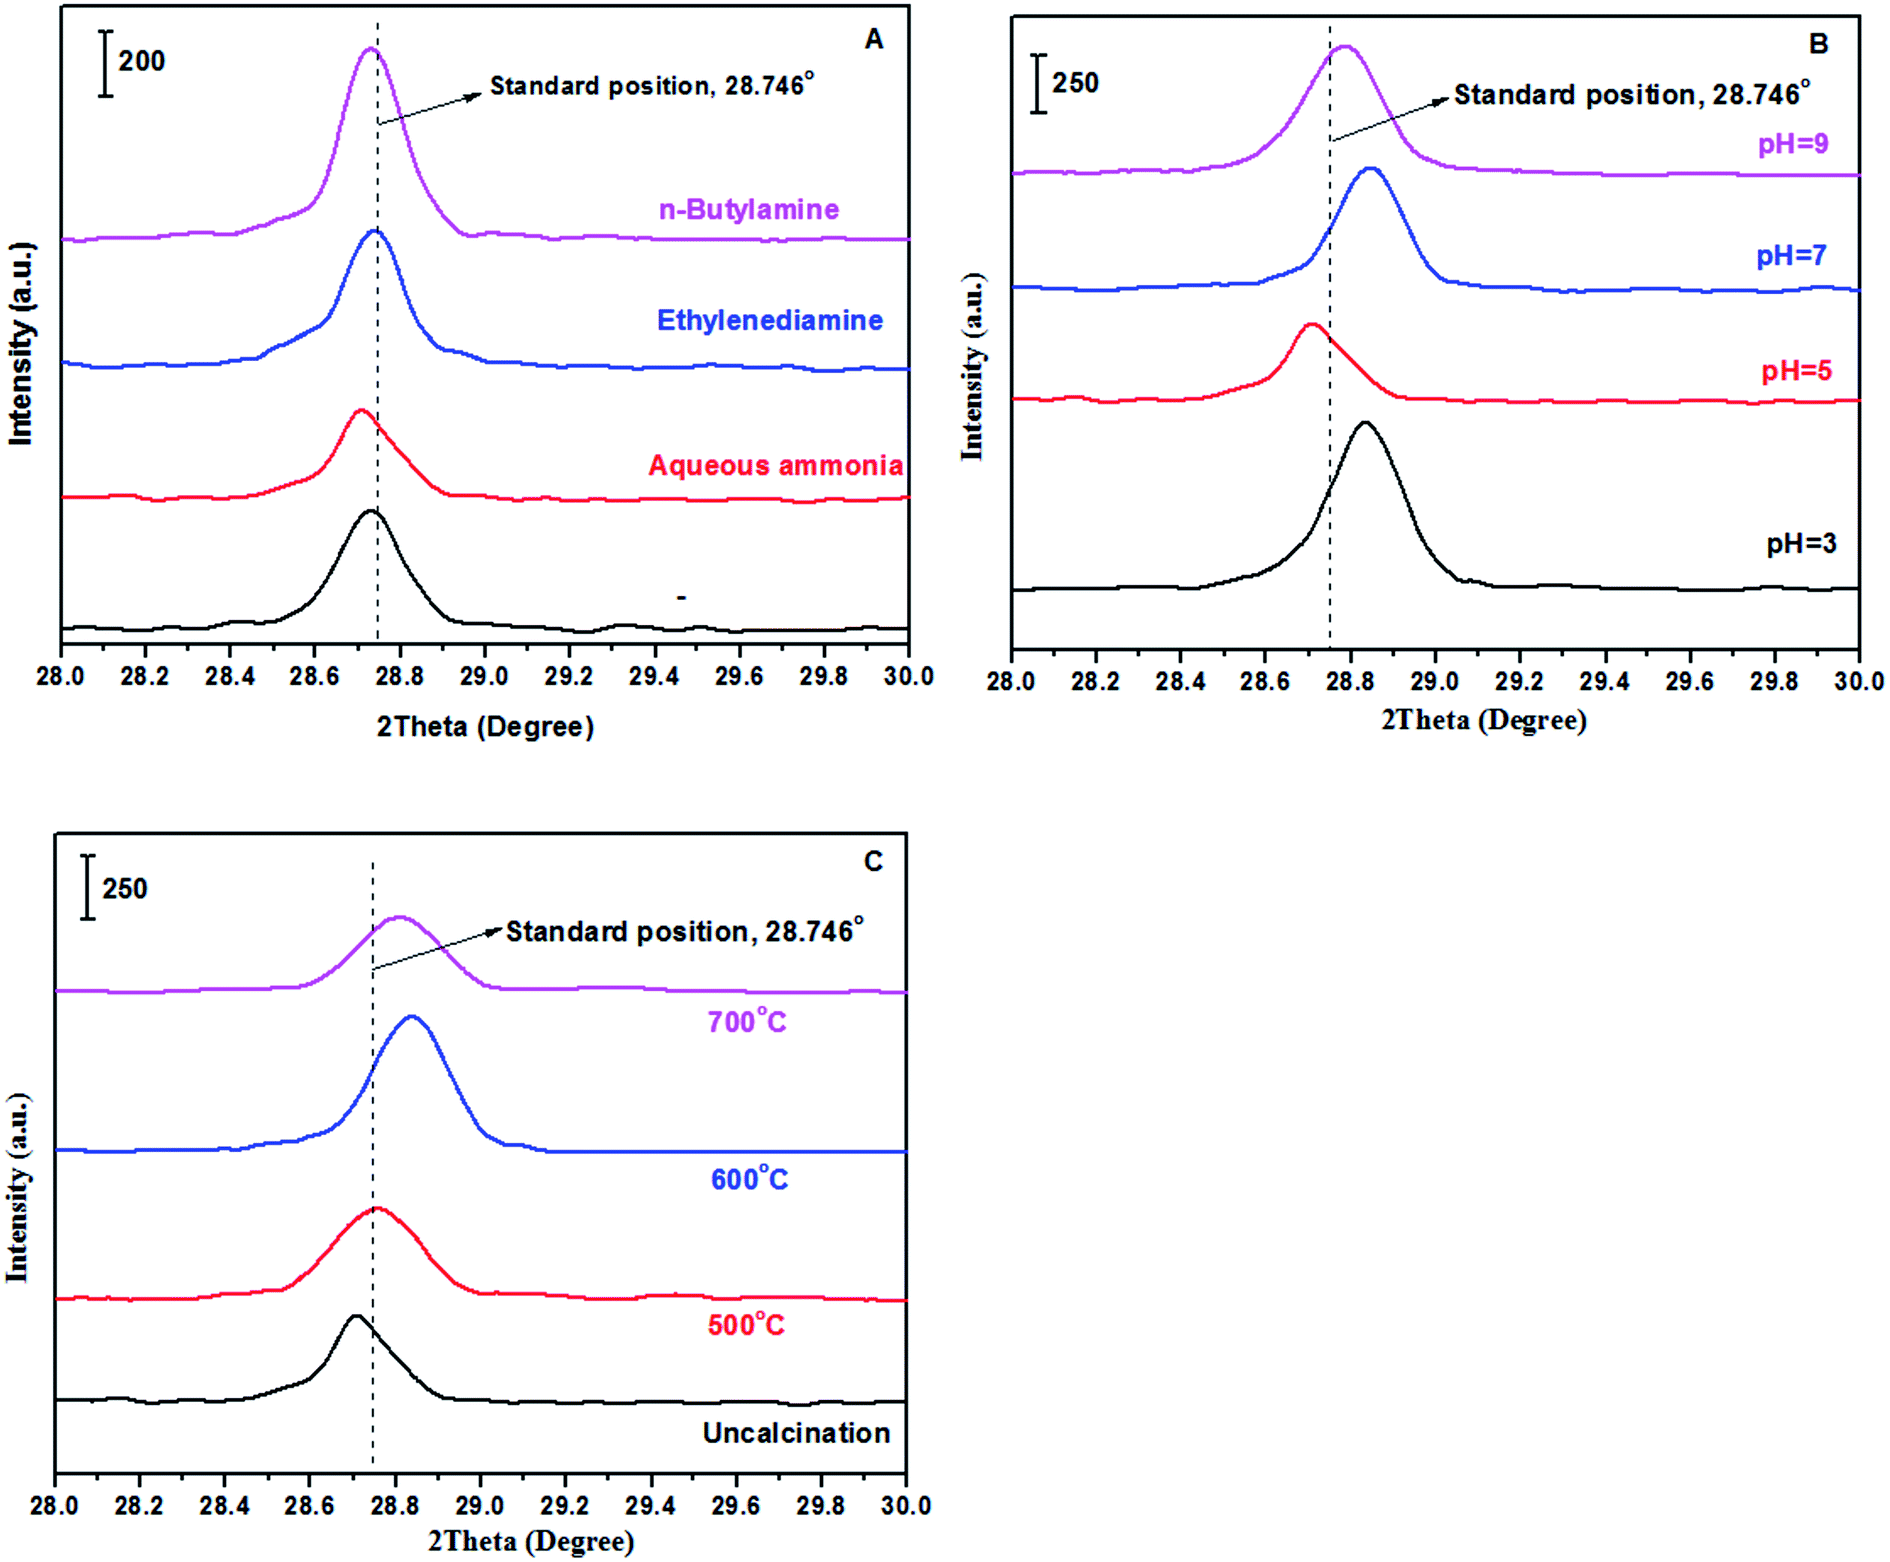
XRD, FT-IR and EDS. Fig. 1 showed the XRD patterns of samples prepared with different methods including alkaline reagents, pH values and calcination temperatures. According to recent report,47 the preparation methods involved in solvents and ultrasonic treatments in synthesis of BaSO4 crystals can efficiently produce crystal defects, generating some novel properties for improving catalytic performances. Based on the enlightenment of this work, it is expected that varying preparation parameters such as alkaline reagents, pH values and calcination temperatures can achieve a controllable synthesis of BaSO4 crystals with some defects. According to normal XRD patterns of the prepared samples, we can clearly observe the characteristic diffraction peaks, which matched well with the standard BaSO4 sample (JCPDS 24-1035). In other words, BaSO4 samples can be easily synthesized at different preparation conditions. However, the enlarged (121) diffraction peak for these samples differed each other (see Fig. 2), suggesting that preparation conditions had an impact on fine structure of BaSO4. For example, as for alkaline reagents, the peak (121) of the sample treated with aqueous ammonia moved toward left in the biggest distance, while it remained at the standard position (2θ = 28.746°) as the sample was treated with ethylenediamine (Fig. 2A). As for pH values, it was found that all samples displayed an right shift for (121) peak except for sample treated with pH = 5. For calcination temperatures, the peak (121) moved toward right gradually with an increase of calcination temperatures. According to previous work,47 the left or right shifts of the diffraction peak was attributed to the defect-induced lattice expansion or contraction, respectively. The interplanar spacing was calculated from Bragg equation, and the results were listed in Tables 1–3. According to the theory of point defects, cations escape from their normal sites in ionic crystal, become interstitial atoms and produce vacancies.48,49 Vacancies and interstitial atoms always form in pairs, and provide sites with unbalanced electrons. The escaped cations are electropositive and act as Lewis acid, and the electronegative vacancies can donate electrons and act as basic sites. As for dehydration reaction of LA to AA, it has been confirmed that acid–base properties of catalysts play a crucial role during the catalytic process.17,36,37,50
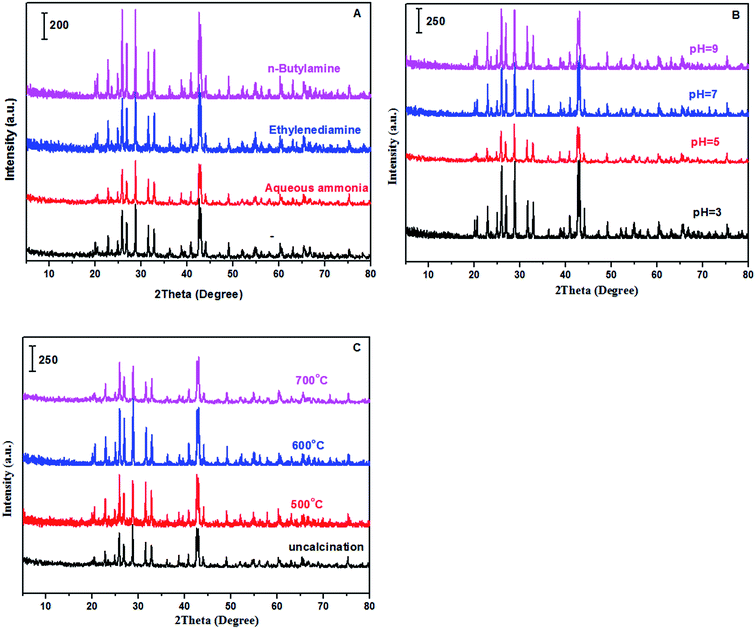 |
| | Fig. 1 XRD patterns of samples (A: treated with different alkaline reagents at pH = 5; B: treated with aqueous ammonia at different pH values; and C: treated with aqueous ammonia and pH = 5 at different calcination temperatures). | |
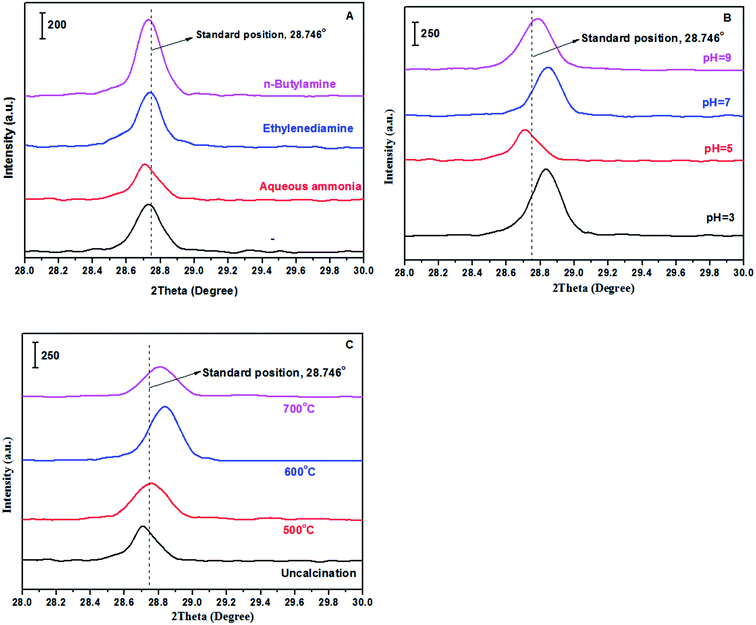 |
| | Fig. 2 The enlarged (121) diffraction peak of samples (A: treated with different alkaline reagents at pH = 5; B: treated with aqueous ammonia at different pH values; and C: treated with aqueous ammonia and pH = 5 at different calcination temperatures). | |
Table 1 Textural and acid–base properties of barium sulfate treated with different alkaline reagents at pH = 5
| Alkaline reagent |
SBET (m2 g−1) |
Vol (cm3 g−1) |
Pore sizea (nm) |
db (nm) |
Surface acidity (μmol g−1) |
Surface basicity (μmol g−1) |
| Calculated from desorption branch data on the Barrett–Joyner–Halenda (BJH) model. Interplanar spacing, determined by enlarged (121) diffraction peak of XRD patterns with Bragg equation. |
| — |
9.8 |
1.1 × 10⁻¹ |
3.0 |
0.3104 |
18.9 |
32.4 |
| Aqueous ammonia |
8.2 |
1.1 × 10⁻¹ |
3.4 |
0.3107 |
15.1 |
51.2 |
| Ethylenediamine |
7.3 |
1.4 × 10⁻¹ |
3.4 |
0.3103 |
23.3 |
94.4 |
| n-Butylamine |
7.4 |
1.2 × 10⁻¹ |
30.4 |
0.3105 |
15.2 |
90.1 |
Fig. 3 showed the FT-IR spectra of the prepared samples with different methods including alkaline reagents, pH values and calcination temperatures. The characteristic absorption bands occurred at 1077 cm−1, 1116 cm−1, 1208 cm−1, which are ascribed to S![[double bond, length as m-dash]](https://www.rsc.org/images/entities/char_e001.gif) O stretching vibration; occurred at 610 cm−1 and 646 cm−1, which are ascribed to OS–O bending mode. In addition, EDS measurement was also carried out, and showed in Fig. S1 and Table S1.† Ba, S and O elements were clearly observed in all samples, while other elements such as N were not observed, indicating a complete removal of impurity from samples.
O stretching vibration; occurred at 610 cm−1 and 646 cm−1, which are ascribed to OS–O bending mode. In addition, EDS measurement was also carried out, and showed in Fig. S1 and Table S1.† Ba, S and O elements were clearly observed in all samples, while other elements such as N were not observed, indicating a complete removal of impurity from samples.
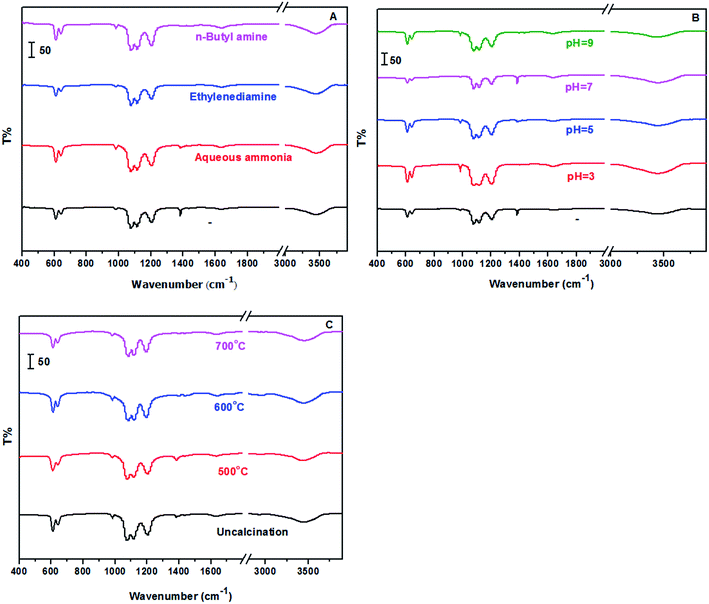 |
| | Fig. 3 FT-IR spectra of samples (A: treated with different alkaline reagents at pH = 5; B: treated with aqueous ammonia at different pH values; and C: treated with aqueous ammonia and pH = 5 at different calcination temperatures). | |
Textural and acid–base properties of samples. Textural and acid–base properties of samples were measured and the results were shown in Tables 1–3 and Fig. S2–S4.† From the results shown in Table 1, the specific surface area of samples treated with alkaline reagents during the aging process reduced in comparison with the sample treated without alkaline reagent. Organic bases such as ethylenediamine and n-butylamine have a greater effect than inorganic base (aqueous ammonia) for reducing the specific surface area of sample. Interplanar spacing determined by enlarged (121) diffraction peak of XRD patterns with Bragg equation varied from 0.3103 to 0.3107 nm, indicating that alkaline reagents can efficiently control the formation of crystal defect. Among these alkaline reagents, aqueous ammonia displayed the highest defect of crystal (corresponding d = 0.3107 nm). Compared with the sample treated without alkaline reagent, all samples treated with alkaline reagents decreased in acidity except for ethylenediamine, while they all increased in basicity.In the selected alkaline reagent of aqueous ammonia, effect of pH values on textural and acid–base properties of samples was shown in Table 2. Initially, the specific surface area of samples decreased with an increase of pH values, while it increased slightly with further increase of pH values. The lowest specific surface area of sample was achieved in 8.2 m2 g−1 as the pH value was adjusted to 5. It was noted that interplanar spacing determined by enlarged (121) diffraction peak of XRD patterns with Bragg equation increased compared to standard value as the pH value was adjusted to 5, and others decreased. The acidity density of samples decreased with an increase of pH values except for pH = 9, and their corresponding basicity density varied between 32.4 μmol g−1 and 96.3 μmol g−1.
Table 2 Textural and acid–base properties of barium sulfate treated with aqueous ammonia at different pH values
| pH value |
SBET (m2 g−1) |
Vol (cm3 g−1) |
Pore sizea (nm) |
db (nm) |
Surface acidity (μmol g−1) |
Surface basicity (μmol g−1) |
| Calculated from desorption branch data on the Barrett–Joyner–Halenda (BJH) model. Interplanar spacing, determined by enlarged (121) diffraction peak of XRD patterns with Bragg equation. |
| — |
9.8 |
1.1 × 10⁻¹ |
3.0 |
0.3104 |
18.9 |
32.4 |
| 3 |
9.5 |
1.0 × 10⁻¹ |
4.3 |
0.3094 |
18.8 |
56.3 |
| 5 |
8.2 |
1.1 × 10⁻¹ |
3.4 |
0.3107 |
15.1 |
51.2 |
| 7 |
9.0 |
1.1 × 10⁻¹ |
3.4 |
0.3092 |
9.2 |
96.3 |
| 9 |
8.9 |
1.4 × 10⁻¹ |
7.4 |
0.3098 |
13.0 |
57.3 |
Under the fixed pH = 5 with aqueous ammonia, effect of calcination temperature on textural and acid–base properties of samples was depicted in Table 3. The specific surface area, pore volume and interplanar spacing determined by enlarged (121) diffraction peak of XRD patterns with Bragg equation of samples decreased with an increase of calcination temperature. Interestingly, the acidity density of samples also decreased with an increase of calcination temperature while their corresponding basicity density varied between 28.3 μmol g−1 and 65.4 μmol g−1.
Table 3 Textural and acid–base properties of barium sulfate treated with aqueous ammonia and pH = 5 at different calcination temperatures
| Calc. temp. (°C) |
SBET (m2 g−1) |
Vol (cm3 g−1) |
Pore sizea (nm) |
db (nm) |
Surface acidity (μmol g−1) |
Surface basicity (μmol g−1) |
| Calculated from desorption branch data on the Barrett–Joyner–Halenda (BJH) model. Interplanar spacing, determined by enlarged (121) diffraction peak of XRD patterns with Bragg equation. |
| — |
8.2 |
1.1 × 10⁻¹ |
3.4 |
0.3107 |
15.1 |
51.2 |
| 500 |
8.6 |
1.4 × 10⁻¹ |
8.3 |
0.3102 |
14.0 |
65.4 |
| 600 |
4.1 |
9.5 × 10⁻² |
6.9 |
0.3093 |
8.4 |
28.3 |
| 700 |
3.7 |
2.6 × 10⁻² |
3.4 |
0.3096 |
3.7 |
56.1 |
Activity
Preparation conditions of catalyst.
Alkaline reagents vs. catalytic performance. Effect of alkaline reagents on catalytic performance of the dehydration reaction of LA was investigated, and the results were shown in Table 4. Initially, we measured the activity of the catalyst treated without alkaline reagents, and the performance including LA conversion = 90.9% and AA selectivity = 59.7% was acceptable. It was expected that further improvement of catalytic performance was achieved by controlling the acid–base environment in aging process of BaSO4 crystal. It was clearly seen that all the used alkaline reagents displayed a positive effect for improving the catalytic performance except for ethylenediamine. Especially, the aqueous ammonia offered the most excellent catalytic performance (LA conversion = 100% and AA selectivity = 81.2%). The area-specific catalytic rates were also measured, and shown in Table 4. LA consumption rate increased with using alkaline reagents, and AA formation rate occurred in increase or decrease, indicating that parallel side reactions existed. According to further observation, the selectivities to side reactions such as formation of propionic acid and acetic acid became higher, resulting in decrease of AA selectivity.
Table 4 Effect of alkaline reagents on catalytic performance of the dehydration reaction of LAa
| Alkaline reagents |
LA conv. [%] |
Sel.b [%] |
Carbon balance [%] |
Area-specific catalytic rate (μmol h−1 m−2) |
| AA |
AD |
PA |
AC |
PD |
LA consumption |
AA formation |
| Catalyst, 0.38 mL, 0.48–0.59 g, uncalcination, particle size: 20–40 meshes, carrier gas N2: 1.2 mL min−1, feed flow rate: 1.4 mL h−1, LA feedstock: 20 wt% in water, reaction temperature, 400 °C, TOS: 2–4 h. LA: lactic acid, AA: acrylic acid, AD: acetaldehyde, PA: propionic acid, AC: acetic acid, PD: 2,3-pentanedione. |
| — |
90.9 |
59.7 |
16.7 |
17.1 |
1.8 |
1.4 |
93.6 |
601 |
359 |
| Aqueous ammonia |
100 |
81.2 |
12.1 |
4.5 |
1.3 |
0.3 |
99.6 |
759 |
616 |
| Ethylenediamine |
89.1 |
48.6 |
21.1 |
23.1 |
4.8 |
1.0 |
89.3 |
678 |
330 |
| n-Butylamine |
99.5 |
69.1 |
20.9 |
7.1 |
1.6 |
0.6 |
99.7 |
709 |
490 |
Combined with characterizations by XRD, NH3-TPD and CO2-TPD, catalytic performance was found to relate to acid–base properties of BaSO4 crystals induced by microstructures. According to the measurements of interplanar spacing and acid–base properties, defects of BaSO4 crystals were produced by deviation of interplanar spacing to normal value, and caused different acid–base properties. Pioneering work has demonstrated that acid–base properties of catalysts are crucial to catalytic dehydration of LA to AA.17,22,36,37 Recently, the work has disclosed that both ultrasound treatment and aging time can efficiently control the formation of crystal defects, which result in different acidity.47 In the present work, alkaline reagents were used to control the acid–base environment of aqueous solution in which crystal formed and grew, and we observed the formation of crystal defects. Due to the crystal defects, the BaSO4 crystals treated with different alkaline reagents offered different acid–base properties. From the results shown in Table 4, catalytic performance decreased with an increase of acidity density; and it was also affected by basicity, and medium basicity density favored the catalytic performance for dehydration of LA to AA. For example, ethylenediamine treated sample displayed the poorest activity (LA conversion = 89.1% and AA selectivity = 48.6%) due to the highest acidity density (23.3 μmol g−1). Under the identical acidity conditions, aqueous ammonia treated sample has lower basicity density (51.2 μmol g−1) than n-butylamine (90.1 μmol g−1), while the former offered higher selectivity of AA (81.2%) than the latter (69.1%) although LA conversion was close to each other.
pH values vs. catalytic performance. In the screening of alkaline reagents, aqueous ammonia was the most excellent alkaline reagent for improving the catalytic performance. The pH values were adjusted using aqueous ammonia to observe effect of pH values on catalytic performance, and the results were shown in Table 5. From the results shown in Table 5, the selectivity to AA on the catalysts treated with aqueous ammonia in the range of pH = 3–5 has been improved in comparison with the catalyst treated without any alkaline reagent. Conspicuously, the selectivity to AA achieved as high as 81.2% when pH value was adjusted to 5 using aqueous ammonia. It was noted that the characteristic diffraction peak of crystal face (121) moved toward left direction from the standard position (2θ = 28.746°) with aqueous ammonia adjusting to pH = 5, while others with pH = 3, 7 and 9 moved toward right direction. Lyu and Wang also observed the characteristic diffraction peak crystal face (121) moved toward right direction as the BaSO4 crystals were treated with ultrasound means.47 Whether the characteristic diffraction peak of crystal face (121) moved toward left or right direction, these BaSO4 crystals produced defects, leading to different acid–base properties located on the catalyst surface. Compared with two catalysts treated with pH = 3 and 9, respectively, they have similar basic site densities (56.3 μmol g−1 and 57.3 μmol g−1), and different acidic site densities (18.8 μmol g−1 and 13.0 μmol g−1). Whereas, the latter had better catalytic performance (LA conversion = 97.5% and AA selectivity = 69.7%) than the former (LA conversion = 82.5% and AA selectivity = 60.4%), indicating that appropriately lowering acidic site density favored the catalytic dehydration reaction of LA to AA.
Table 5 Effect of pH values modulated with aqueous ammonia on catalytic performance of the dehydration reaction of LAa
| pH |
LA conv. [%] |
Sel.b [%] |
Carbon balance |
Area-specific catalytic rate (μmol h−1 m−2) |
| AA |
AD |
PA |
AC |
PD |
LA consumption |
AA formation |
| Catalyst, 0.38 mL, 0.48–0.55 g, uncalcination, particle size: 20–40 meshes, carrier gas N2: 1.2 mL min−1, feed flow rate: 1.4 mL h−1, LA feedstock: 20 wt% in water, reaction temperature, 400 °C, TOS: 2–4 h. LA: lactic acid, AA: acrylic acid, AD: acetaldehyde, PA: propionic acid, AC: acetic acid, PD: 2,3-pentanedione. |
| — |
90.9 |
59.7 |
16.7 |
17.1 |
1.8 |
1.4 |
93.6 |
601 |
359 |
| 3 |
82.5 |
60.4 |
22.1 |
13.1 |
2.5 |
0.5 |
82.7 |
491 |
297 |
| 5 |
100 |
81.2 |
12.1 |
4.5 |
1.3 |
0.3 |
99.6 |
759 |
616 |
| 7 |
92.5 |
67.8 |
22.0 |
7.5 |
1.5 |
0.9 |
84.9 |
615 |
417 |
| 9 |
97.5 |
69.7 |
17.5 |
9.4 |
1.6 |
1.2 |
100 |
668 |
466 |
Calcination temperature vs. catalytic performance. Table 6 showed effect of calcination temperature on the performance of catalysts. LA conversion decreased from 100% to 50.1% as the calcination temperature increased from uncalcination to 600 °C. With further increase of calcination temperature to 700 °C, LA conversion began to increase to 75.9%. Besides, AA selectivity also reduced with an increase of calcination temperature. Although area-specific catalytic rate (LA consumption: 1227 μmol h−1 m−2 and AA formation: 724 μmol h−1 m−2) on the catalyst calcined at 700 °C was the highest among all the catalysts calcined at different temperatures (ca. ∼700 °C), LA conversion as well as AA selectivity is relatively lower due to its low specific surface area (only 3.7 m2 g−1 far lower than others (∼8 m2 g−1)). In order to better understand the effect of calcination temperature on the catalytic performance, we can draw support from the XRD characterization shown in Fig. 2C and the acid–base site density shown in Table 3. With an increase of calcination temperature, characteristic diffraction peak of crystal face (121) also gradually moved toward right direction, suggesting that high temperature favored the formation of crystal defects. As a result, different acid–base properties of catalysts were achieved by calcination.
Table 6 Effect of calcination temperature on catalytic performance of the dehydration reaction of LAa
| Calc. temp. [°C] |
LA conv. [%] |
Sel.b [%] |
Carbon balance |
Area-specific catalytic rate (μmol h−1 m−2) |
| AA |
AD |
PA |
AC |
PD |
LA consumption |
AA formation |
| Catalyst, 0.38 mL, 0.45–0.57 g, particle size: 20–40 meshes, carrier gas N2: 1.2 mL min−1, feed flow rate: 1.4 mL h−1, LA feedstock: 20 wt% in water, reaction temperature, 400 °C, TOS: 2–4 h. LA: lactic acid, AA: acrylic acid, AD: acetaldehyde, PA: propionic acid, AC: acetic acid, PD: 2,3-pentanedione. |
| — |
100 |
81.2 |
12.1 |
4.5 |
1.3 |
0.3 |
99.6 |
759 |
616 |
| 500 |
100 |
70.8 |
20.1 |
6.8 |
1.5 |
0.50 |
99.9 |
804 |
569 |
| 600 |
50.1 |
56.3 |
17.8 |
20.7 |
4.0 |
0.9 |
85.1 |
667 |
375 |
| 700 |
75.9 |
59.0 |
26.1 |
10.1 |
1.8 |
2.2 |
82.3 |
1227 |
724 |
Furthermore, we correlated the catalytic performance of catalysts with acid–base properties of catalysts. Firstly, we compared the catalyst without calcination with the catalyst calcined at 700 °C, and found that they had similar basic site density (51.2 μmol g−1 and 56.1 μmol g−1), and different acidic site density (15.1 μmol g−1 vs. 3.7 μmol g−1). The catalytic performance of the former (LA conversion = 100% and AA selectivity = 82.1%) was obviously more excellent than the latter (LA conversion = 75.9% and AA selectivity = 59.0%), suggesting that too low acidic site density was unfavourable for the dehydration of LA to AA. The poorest performance (LA conversion = 50.1% and AA selectivity = 56.3%) was observed over the catalyst calcined at 600 °C, indicating that too low basic site density had also a disadvantage for the dehydration of LA to AA.
Reaction conditions.
Reaction temperature vs. reaction performance. According to the discussion on preparation conditions of catalysts in the preceding sections, we obtained the optimal preparation conditions for BaSO4 with crystal defects (alkaline reagent: aqueous ammonia, pH = 5.). Next, effect of reaction conditions on the dehydration of LA would be investigated. As an important factor determining the reaction rate and reaction selectivity, reaction temperature was firstly discussed.51 From effect of reaction temperature on dehydration of LA shown in Table 7, LA conversion increased with an increase of reaction temperature from 350 °C to 400 °C. For a given catalyst, area-specific catalytic rate also increased with an increase of reaction temperature. For this reason, LA conversion increased with an increase of reaction temperature. However, as the reaction temperature was above 400 °C, LA conversion remained constant (100%). As for AA selectivity, it gradually decreased with an increase of reaction temperature while byproduct selectivity increased, indicating that the side reactions were accelerated at higher reaction temperature. For example, propionic acid selectivity and acetic acid selectivity achieved 13.2% and 4.1%, respectively, far higher than those obtained at 350 °C (4.5% and 0.9%).
Table 7 Effect of reaction temperature on performance of the dehydration reaction of LAa
| Reaction temp. [°C] |
LA conv. [%] |
Sel.b [%] |
Carbon balance |
Area-specific catalytic rate (μmol h−1 m−2) |
| AA |
AD |
PA |
AC |
PD |
LA consumption |
AA formation |
| Catalyst, 0.38 mL, 0.49–0.53 g, uncalcination, particle size: 20–40 meshes, carrier gas N2: 1.2 mL min−1, feed flow rate: 1.4 mL h−1, LA feedstock: 20 wt% in water, TOS: 2–4 h. LA: lactic acid, AA: acrylic acid, AD: acetaldehyde, PA: propionic acid, AC: acetic acid, PD: 2,3-pentanedione. |
| 350 |
69.7 |
82.1 |
9.2 |
4.5 |
0.9 |
0.2 |
95.5 |
499 |
410 |
| 370 |
98.5 |
81.7 |
10.9 |
4.8 |
1.1 |
0.2 |
99.8 |
705 |
576 |
| 400 |
100 |
81.2 |
12.1 |
4.5 |
1.3 |
0.3 |
99.6 |
759 |
616 |
| 420 |
100 |
68.8 |
14.2 |
10.1 |
3.1 |
1.1 |
96.3 |
774 |
533 |
| 440 |
100 |
53.9 |
19.7 |
13.2 |
4.1 |
1.7 |
91.5 |
759 |
409 |
Catalyst colour became darker with an increase of reaction temperature, and displayed a black colour especially at 440 °C (shown in Fig. S5†), and these used catalysts were calcined under the air atmosphere at 500 °C for 10 h to obtain light colour again, suggesting that the substance formed on the catalyst surface may be carbon or coke, which covered the active sites, leading to decrease of AA selectivity.
Weight hourly space velocity (WHSV) vs. reaction performance. Weight hourly space velocity (WHSV) is generally used to evaluate the performance of heterogeneous catalyst.52,53 Table 8 showed the influence of LA WHSV on reaction performance. The reaction was conducted at 400 °C with LA flow rate changed from 1.0 to 8.4 mL h−1 (corresponding WHSV = 2.0–16.8 h−1). For LA conversion, it almost remained at 100% when LA WHSV was lower than 2.8 h−1. As LA WHSV increased from 2.8 h−1 to 16.8 h−1, LA conversion gradually decreased from 100% to 70.5%. AA selectivity, unlike LA conversion, increased fast from 71.3% to 81.2% with an increase of LA WHSV from 2.0 h−1 to 2.8 h−1. It is known that LA contact time on the surface of BaSO4 catalyst shortens with the enhancement of LA WHSV.28 The appropriately shortened contact time favored the selective formation of AA, indicating that dehydration reaction of LA is relatively faster than other side reactions. Area-specific catalytic rate quickly increased with an increase of LA solution WHSV. For example, LA consumption rate was 542 μmol h−1 m−2 at LA solution WHSV = 2.0 h−1 while it attained to 3210 μmol h−1 m−2 at LA solution WHSV = 16.8 h−1. For that reason, 70.5% of LA conversion was obtained at high WHSV of 16.8 h−1.
Table 8 Effect of weight hourly space velocity (WHSV) on performance of the dehydration reaction of LAa
| WHSV (h−1) |
LA conv. [%] |
Sel.b [%] |
Carbon balance |
Area-specific catalytic rate (μmol h−1 m−2) |
| AA |
AD |
PA |
AC |
PD |
LA consumption |
AA formation |
| Catalyst, 0.38 mL, 0.5 g, uncalcination, particle size: 20–40 meshes, carrier gas N2: 1.2 mL min−1, LA feedstock: 20 wt% in water, reaction temperature, 400 °C, TOS: 2–4 h. LA: lactic acid, AA: acrylic acid, AD: acetaldehyde, PA: propionic acid, AC: acetic acid, PD: 2,3-pentanedione. |
| 2.0 |
100 |
71.3 |
15.1 |
8.6 |
1.9 |
0.5 |
98.5 |
542 |
386 |
| 2.8 |
100 |
81.2 |
12.1 |
4.5 |
1.3 |
0.3 |
99.6 |
759 |
616 |
| 5.6 |
92.2 |
78.2 |
11.7 |
6.1 |
1.4 |
0.4 |
90.2 |
1399 |
1094 |
| 8.4 |
80.5 |
77.8 |
12.5 |
7.1 |
1.4 |
0.4 |
97.1 |
1833 |
1426 |
| 16.8 |
70.5 |
77.7 |
12.6 |
7.2 |
1.6 |
0.3 |
97.3 |
3210 |
2494 |
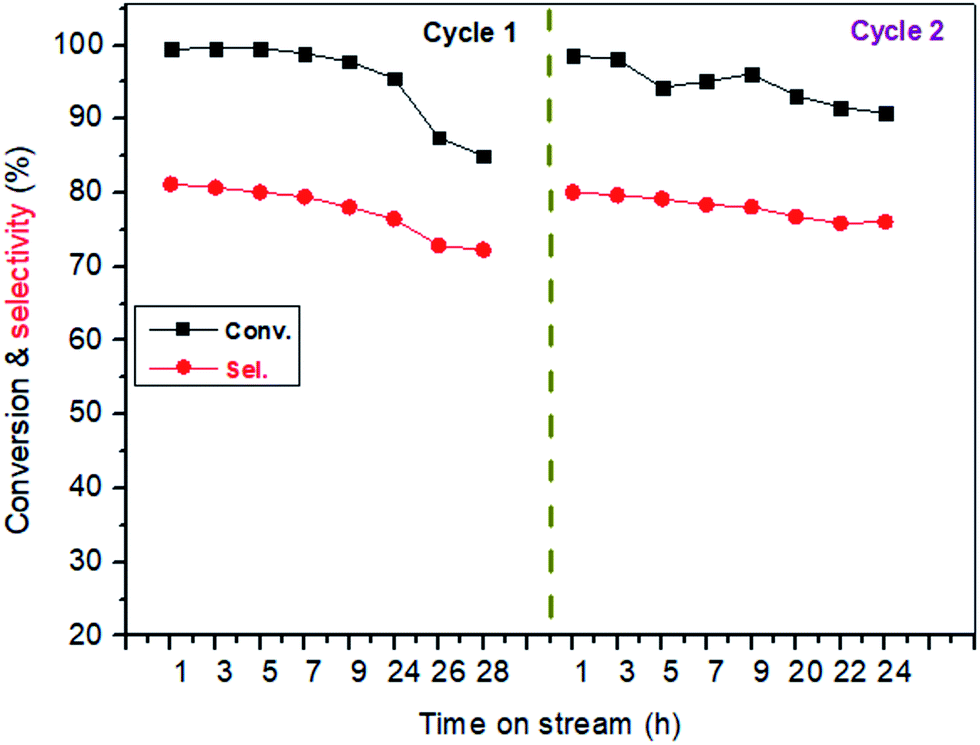
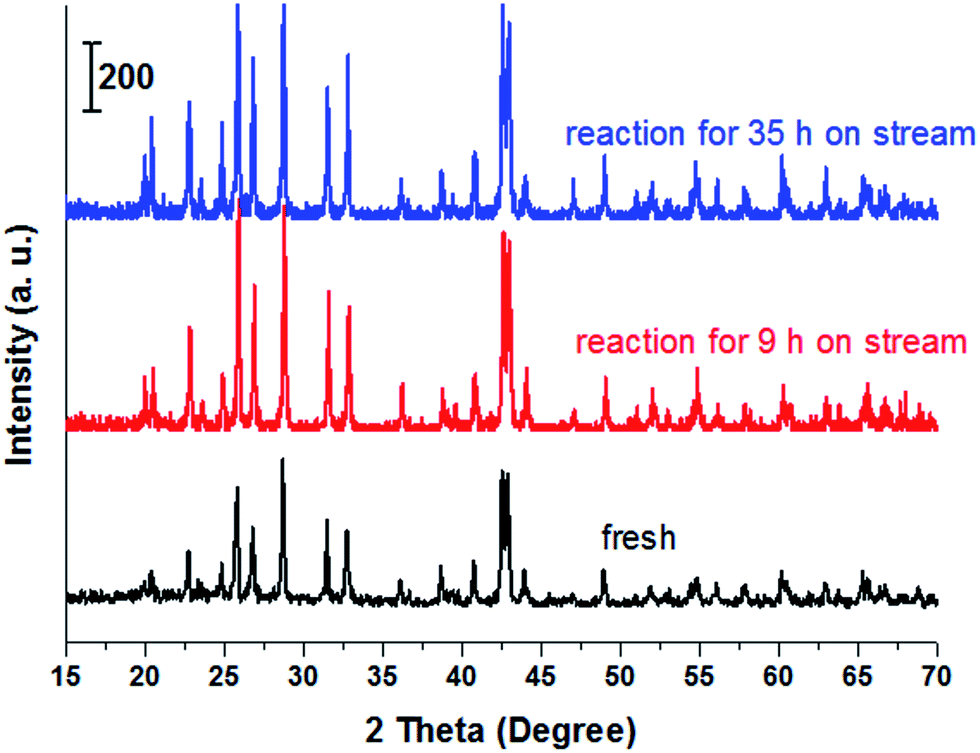
Stability of catalyst. Fig. 4 showed the stability of the catalyst with time on stream. The experiment was performed at 400 °C with LA concentration of 20 wt% and feed flow rate of 1.4 mL h−1. It is known that long-term stability is a very important characteristic for a heterogeneous catalyst.54 From the cycle 1 of Fig. 4, LA conversion slightly decreased within initial 24 h on stream while after experienced 24 h on stream, LA conversion drastically reduced to near 85%. Similarly, AA selectivity was influenced by the time on stream. For example, AA selectivity also slightly decreased from about 81.2% to 76.5% within the initial reaction time (1–24 h). Catalytic performance reduced with time on stream, indicating a deactivation of catalyst. However, the deactivated catalyst can be easily regenerated after a simple calcination at 500 °C for 10 h under the air atmosphere because the resultants on the catalyst surface causing in deactivation are carbon or coke (also shown in Fig. 4, cycle 2). In addition, XRD, FT-IR and TG characterizations of the spent catalyst and the fresh catalyst was performed, and the results were shown in Fig. 5, S6 and S7.† It was clearly seen that the structure of BaSO4 crystal remained well during the catalytic reaction.
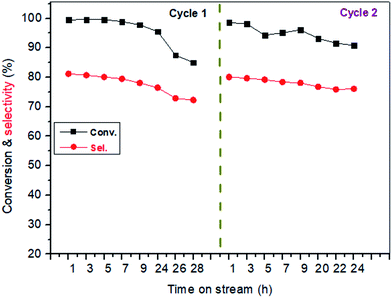 |
| | Fig. 4 The stability of catalyst with time on stream. Catalyst, 0.38 mL, 0.5 g, uncalcination, particle size: 20–40 meshes, carrier gas N2: 1.2 mL min−1, feed flow rate: 1.4 mL h−1, LA feedstock: 20 wt% in water, reaction temperature, 400 °C. The used catalyst in cycle 1 was calcined at 500 °C for 10 h to remove the carbon deposits from its surface, and then was used again in cycle 2. | |
 |
| | Fig. 5 XRD patterns of fresh BaSO4 catalyst and spent BaSO4 catalysts. | |
Experimental
Materials
Lactic acid (85–90 wt%), was purchased from Chengdu Kelong Chemical Reagent Co. and was used for the dehydration reaction of lactic acid to synthesize AA without further purification. Sulphuric acid (H2SO4), barium hydroxide (Ba(OH)2), aqueous ammonia, n-butylamine, and ethylenediamine were purchased from Energy Chemical Company. Acrylic acid, propionic acid, acetic acid, acetaldehyde, 2,3-pentanedione and n-butanol, together with hydroquinone were obtained from Sigma-Aldrich. Acrylic acid, propionic acid, acetic acid, 2,3-pentanedione and acetaldehyde were used for gas chromatograph reference materials, and n-butanol was adopted as internal standard material. Hydroquinone (0.3 wt%) was used as a polymerization inhibitor.
Preparation of catalysts
BaSO4 catalyst (blank): firstly, 25.20 g of Ba(OH)2 was fully dissolved in 150 mL distilled water. Under stirring at room temperature, diluted H2SO4 solution with 0.2 mol L−1 was dropwisely added to the obtained Ba(OH)2 aqueous solution to form a white precipitate of barium sulfate at pH = 2, and aged for 15 h. Subsequently, the white precipitate was rinsed at least three times to remove dissociative H2SO4 using distilled water and dried at 120 °C in the air circulating oven for 3 h.
BaSO4 catalyst treated with alkaline agents: the obtained BaSO4 precipitates with above preparation method were aged for 15 h at pH = 5 using different alkaline agents. Specially, using aqueous ammonia to adjust pH values, BaSO4 precipitates were aged at pH = 3, 7, and 9 for 15 h, respectively.
Catalyst characterization
Powder X-ray diffraction measurement was conducted on a Dmax/Ultima IV diffractometer operated at 40 kV and 20 mA with Cu-Kα radiation. The FTIR spectra of the catalysts were recorded in the range of 500–4000 cm−1 on a Nicolet 6700 spectrometer. The EDS measurements of the catalysts were performed using a scanning electron microscope (SEM, JSM-6510). The specific surface areas of catalysts were measured through nitrogen adsorption at 77 K using Autosorb IQ instrument. Prior to adsorption, the samples were treated at 250 °C under vacuum for 6 h and the specific surface area was calculated according to the Brunauer–Emmett–Teller (BET) method. Surface acid and base properties of the samples were estimated by NH3-TPD and CO2-TPD, respectively, on a Quantachrome Instrument. The sample (ca. 50–60 mg) was purged with dry Ar (50 mL min−1, purity >99.999 vol%) at 400 °C for 1.0 h, followed by reducing the furnace temperature to room temperature, and switching to a flow of 8 vol% NH3/Ar or 10 vol% CO2/Ar for 1 h to execute NH3 or CO2 adsorption. Then, NH3 or CO2 adsorbed on the sample is desorbed in the range of 80–800 °C at a rate of 10 °C min−1.
Catalyst evaluation
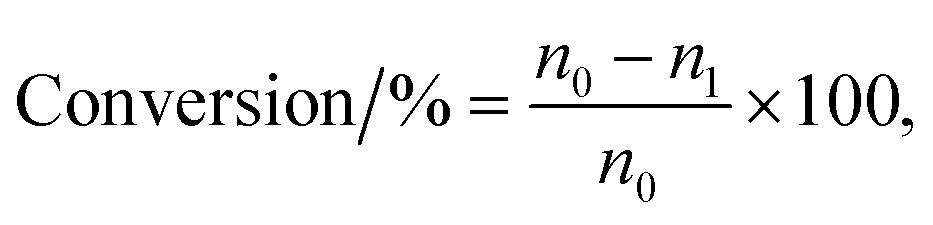
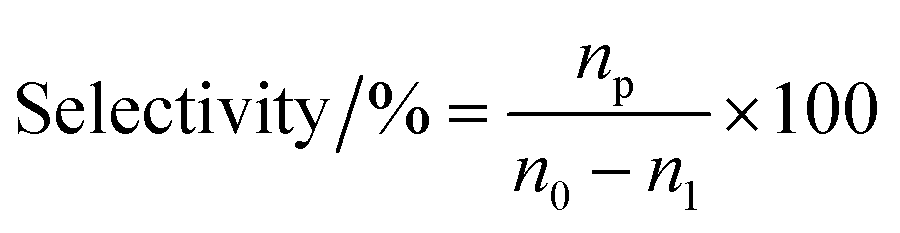
The vapor-phase dehydration reaction of lactic acid to acrylic acid over the catalysts was carried out at 350–440 °C under atmospheric pressure in a vertical fixed-bed tubular quartz reactor (40 cm × 4 mm (i.d.)), mounted in a cylindrical electrical furnace. The catalyst (0.50–0.60 g, 20–40 meshes) was placed in the middle of the reactor and quartz wool was placed in both ends. Before catalyst evaluation, the catalyst was pretreated at the required reaction temperature (ca. 400 °C) for 1.0 h under high purity N2 (0.1 MPa, 1.2 mL min−1). The feedstock (20 wt% solution of lactic acid) was then pumped into the preheating zone (lactic acid aqueous solution flow rate, 1.4 mL h−1) and driven through the catalyst bed by nitrogen. The liquid products were condensed using ice-water bath and analyzed off-line using a SP-6890 gas chromatograph with a FFAP capillary column connected to a FID. Quantitative analysis of the products was carried out by the internal standard method using n-butanol as the internal standard material. GC-MS analyses of the samples were performed using Agilent 5973N Mass Selective Detector attachment. The conversion of lactic acid and the selectivity toward acrylic acid or other by-products are calculated as follows with eqn (1) and (2), respectively.| |
 | (1) |
| |
 | (2) |
where n0 is the molar quantity of lactic acid fed into reactor, n1 is the molar quantity of lactic acid in the effluent, and np is the molar quantity of lactic acid converted to acrylic acid or other byproducts such as acetaldehyde, propionic acid, acetic acid, 2,3-pentanedione.
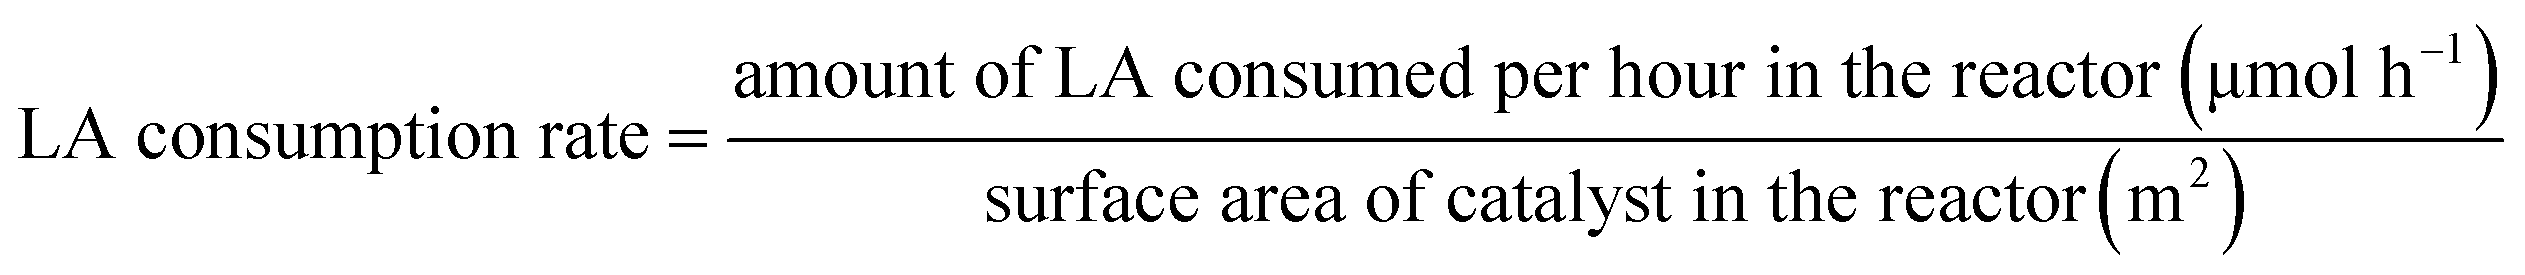
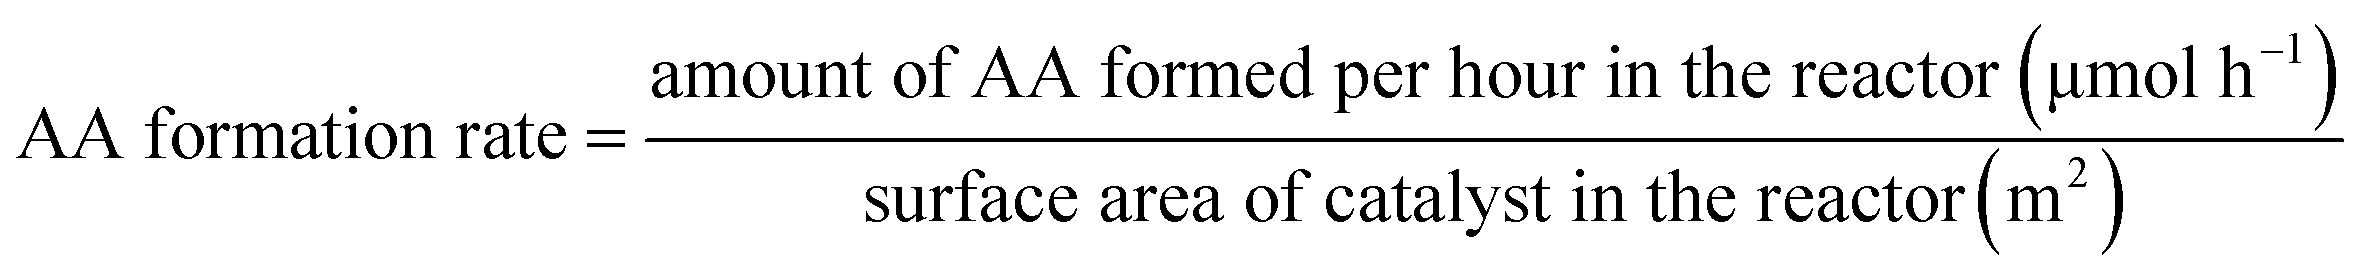
Area-specific catalytic rate is defined as previous references reported,22,28 and is determined with eqn (3) and (4).
| |
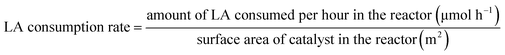 | (3) |
| |
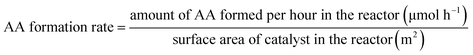 | (4) |
Conclusions
BaSO4 crystals with different defects were prepared by controlling the preparation conditions such as alkaline reagents, pH values and calcination temperature. It was found that these BaSO4 crystals with different defects offered different activities. Among the tested alkaline reagents, aqueous ammonia displayed an evidently promotional effect for dehydration of LA to AA since the BaSO4 crystal had an appropriate acid–base property caused by crystal defect. Besides, pH values and calcination temperature can also control the formation of crystal defect, which determined the acid–base property of catalyst. Relatively less acidity density and enhanced basicity density favored the dehydration of LA to AA. Under the optimal reaction conditions, the stability of BaSO4 catalyst treated with aqueous ammonia at pH = 5 was evaluated. Encouragingly, LA conversion reduced in 15% (from 100% to 85%) within 28 h on stream.
Conflicts of interest
There are no conflicts to declare.
Acknowledgements
This work was supported by Sichuan Province Science and Technology Department application foundation project (2017JY0188), and the opening foundation of Jiangsu Key Laboratory of Vehicle Emissions Control (OVEC 032).
Notes and references
- P. Maki-Arvela, I. L. Simakova, T. Salmi and D. Y. Murzin, Chem. Rev., 2014, 114, 1909–1971 CrossRef CAS PubMed.
- J. C. Serrano-Ruiz, R. Luque and A. Sepulveda-Escribano, Chem. Soc. Rev., 2011, 40, 5266–5281 RSC.
- A. Corma, S. Iborra and A. Velty, Chem. Rev., 2007, 107, 2411–2502 CrossRef CAS PubMed.
- W. P. Deng, Y. Wang and N. Yan, Current Opinion in Green and Sustainable Chemistry, 2016, 2, 54–58 CrossRef.
- S. Siankevich, S. Mozzettini, F. Bobbink, S. Ding, Z. Fei, N. Yan and P. J. Dyson, ChemPlusChem DOI:10.1002/cplu.201700344.
- G. Juodeikiene, D. Vidmantiene, L. Basinskiene, D. Cernauskas, E. Bartkiene and D. Cizeikiene, Catal. Today, 2015, 239, 11–16 CrossRef CAS.
- P. Wattanapaphawong, P. Reubroycharoen and A. Yamaguchi, RSC Adv., 2017, 7, 18561–18568 RSC.
- Y. L. Wang, W. P. Deng, B. J. Wang, Q. H. Zhang, X. Y. Wan, Z. C. Tang, Y. Wang, C. Zhu, Z. X. Cao, G. C. Wang and H. L. Wan, Nat. Commun., 2013, 4, 2141 Search PubMed.
- C. Gao, C. Q. Ma and P. Xu, Biotechnol. Adv., 2011, 29, 930–939 CrossRef CAS PubMed.
- I. Delidovich, P. J. C. Hausoul, L. Deng, R. Pfutzenreuter, M. Rose and R. Palkovits, Chem. Rev., 2016, 116, 1540–1599 CrossRef CAS PubMed.
- Y. M. Zhang, X. R. Chen, J. Q. Luo, B. K. Qi and Y. H. Wan, Bioresour. Technol., 2014, 158, 396–399 CrossRef CAS PubMed.
- X. C. Wang, Y. L. Song, C. P. Huang, F. B. Liang and B. H. Chen, Green Chem., 2014, 16, 4234–4240 RSC.
- L. D. Ye, X. D. Zhou, M. S. Bin Hudari, Z. Li and J. C. Wu, Bioresour. Technol., 2013, 132, 38–44 CrossRef CAS PubMed.
- C. A. Ramirez-Lopez, J. R. Ochoa-Gomez, M. Fernandez-Santos, O. Gomez-Jimenez-Aberasturi, A. Aonso-Vicario and J. Torrecilla-Soria, Ind. Eng. Chem. Res., 2010, 49, 6270–6278 CrossRef CAS.
- H. X. Yin, H. B. Yin, A. L. Wang, L. Q. Shen, Y. Liu and Y. Zheng, J. Nanosci. Nanotechnol., 2017, 17, 1255–1266 CrossRef CAS.
- G. Y. Yang, Y. H. Ke, H. F. Ren, C. L. Liu, R. Z. Yang and W. S. Dong, Chem. Eng. J., 2016, 283, 759–767 CrossRef CAS.
- B. Yan, L. Z. Tao, A. Mahmood, Y. Liang and B. Q. Xu, ACS Catal., 2017, 7, 538–550 CrossRef CAS.
- X. H. Zhang, L. Lin, T. Zhang, H. O. Liu and X. F. Zhang, Chem. Eng. J., 2016, 284, 934–941 CrossRef CAS.
- C. M. Tang, J. S. Peng, X. L. Li, Z. J. Zhai, W. Bai, N. Jiang, H. J. Gao and Y. W. Liao, Green Chem., 2015, 17, 1159–1166 RSC.
- S. Lomate, T. Bonnotte, S. Paul, F. Dumeignil and B. Katryniok, J. Mol.
Catal. A: Chem., 2013, 377, 123–128 CrossRef CAS.
- J. F. Zhang, J. P. Lin and P. L. Cen, Can. J. Chem. Eng., 2008, 86, 1047–1053 CrossRef CAS.
- J. F. Zhang, Y. L. Zhao, M. Pan, X. Z. Feng, W. J. Ji and C. T. Au, ACS Catal., 2011, 1, 32–41 CrossRef CAS.
- G. C. Gunter, D. J. Miller and J. E. Jackson, J. Catal., 1994, 148, 252–260 CrossRef CAS.
- M. S. Tam, J. E. Jackson and D. J. Miller, Ind. Eng. Chem. Res., 1999, 38, 3873–3877 CrossRef CAS.
- X. L. Li, L. W. Sun, W. X. Zou, P. Cao, Z. Chen, C. M. Tang and L. Dong, ChemCatChem DOI:10.1002/cctc.201701332.
- L. W. Sun, X. L. Li and C. M. Tang, Acta Phys.-Chim. Sin., 2016, 32, 2327–2336 CAS.
- M. E. Sad, L. F. González Peña, C. L. Padró and C. R. Apesteguía, Catal. Today DOI:10.1016/j.cattod.2017.03.024.
- C. M. Tang, Z. J. Zhai, X. L. Li, L. W. Sun and W. Bai, J. Catal., 2015, 329, 206–217 CrossRef CAS.
- C. M. Tang, Z. J. Zhai, X. L. Li, L. W. Sun and W. Bai, J. Taiwan Inst. Chem. Eng., 2016, 58, 97–106 CrossRef CAS.
- B. Katryniok, S. Paul and F. Dumeignil, Green Chem., 2010, 12, 1910–1913 RSC.
- T. J. Korstanje, H. Kleijn, J. Jastrzebski and R. Gebbink, Green Chem., 2013, 15, 982–988 RSC.
- X. L. Li, Z. J. Zhai, C. M. Tang, L. W. Sun, Y. Zhang and W. Bai, RSC Adv., 2016, 6, 62252–62262 RSC.
- R. Beerthuis, G. Rothenberg and N. R. Shiju, Green Chem., 2015, 17, 1341–1361 RSC.
- C. M. Tang, Y. Zeng, X. G. Yang, Y. C. Lei and G. Y. Wang, J. Mol. Catal. A: Chem., 2009, 314, 15–20 CrossRef CAS.
- B. Yan, L. Z. Tao, Y. Liang and B. Q. Xu, ACS Catal., 2014, 4, 1931–1943 CrossRef CAS.
- Y. Matsuura, A. Onda and K. Yanagisawa, Catal. Commun., 2014, 48, 5–10 CrossRef CAS.
- V. C. Ghantani, S. T. Lomate, M. K. Dongare and S. B. Umbarkar, Green Chem., 2013, 15, 1211–1217 RSC.
- G. M. Lari, B. Puertolas, M. S. Frei, C. Mondelli and J. Perez-Ramirez, ChemCatChem, 2016, 8, 1507–1514 CrossRef CAS.
- C. Yuan, H. Y. Liu, Z. K. Zhang, H. F. Lu, Q. L. Zhu and Y. F. Chen, Chin. J. Catal., 2015, 36, 1861–1866 CrossRef CAS.
- J. F. Zhang, Y. L. Zhao, X. Z. Feng, M. Pan, J. Zhao, W. J. Ji and C. T. Au, Catal. Sci. Technol., 2014, 4, 1376–1385 CAS.
- H. J. Wang, D. H. Yu, P. Sun, J. Yan, Y. Wang and H. Huang, Catal. Commun., 2008, 9, 1799–1803 CrossRef CAS.
- P. Sun, D. H. Yu, K. M. Fu, M. Y. Gu, Y. Wang, H. Huang and H. H. Ying, Catal. Commun., 2009, 10, 1345–1349 CrossRef CAS.
- J. S. Peng, X. L. Li, C. M. Tang and W. Bai, Green Chem., 2014, 16, 108–111 RSC.
- C. M. Tang, J. S. Peng, G. Fan, X. L. Li, X. L. Pu and W. Bai, Catal. Commun., 2014, 43, 231–234 CrossRef CAS.
- C. M. Tang, J. S. Peng, X. L. Li, Z. J. Zhai, N. Jiang, W. Bai, H. J. Gao and Y. W. Liao, RSC Adv., 2014, 4, 28875–28882 RSC.
- Z. Guo, D. S. Theng, K. Y. Tang, L. L. Zhang, L. Huang, A. Borgna and C. Wang, Phys. Chem. Chem. Phys., 2016, 18, 23746–23754 RSC.
- S. Lyu and T. F. Wang, RSC Adv., 2017, 7, 10278–10286 RSC.
- A. Linsebigler, G. Q. Lu and J. T. Yates, J. Chem. Phys., 1995, 103, 9438–9443 CrossRef CAS.
- G. Q. Lu, A. Linsebigler and J. T. Yates, J. Chem. Phys., 1995, 102, 3005–3008 CrossRef CAS.
- Y. Matsuura, A. Onda, S. Ogo and K. Yanagisawa, Catal. Today, 2014, 226, 192–197 CrossRef CAS.
- M. Behrens, F. Studt, I. Kasatkin, S. Kuhl, M. Havecker, F. Abild-Pedersen, S. Zander, F. Girgsdies, P. Kurr, B. L. Kniep, M. Tovar, R. W. Fischer, J. K. Norskov and R. Schlogl, Science, 2012, 336, 893–897 CrossRef CAS PubMed.
- C. Li, B. Wang, Q. Q. Zhu and T. W. Tan, Appl. Catal., A, 2014, 487, 219–225 CrossRef CAS.
- B. Wang, C. Li, Q. Q. Zhu and T. W. Tan, RSC Adv., 2014, 4, 45679–45686 RSC.
- M. S. Holm, S. Saravanamurugan and E. Taarning, Science, 2010, 328, 602–605 CrossRef CAS PubMed.
Footnote |
| † Electronic supplementary information (ESI) available. See DOI: 10.1039/c7ra10736f |
|
| This journal is © The Royal Society of Chemistry 2017 |
Click here to see how this site uses Cookies. View our privacy policy here. 
 Open Access Article
 This Open Access Article is licensed under a Creative Commons Attribution-Non Commercial 3.0 Unported Licence
 *a and
Lin Dong
*a and
Lin Dong