 Open Access Article
Template-free synthesis of nitrogen doped carbon materials from an organic ionic dye (murexide) for supercapacitor application†
Monazza Serwarab,
Usman Ali Rana *c,
Humaira M. Siddiqi*a,
Salah Ud-Din Khanc,
Fekri A. Ahmed Alid,
Ahmed Al-Fateshd,
Arturas Adomkeviciusb,
Jose A. Coca-Clementeb,
Laura Cabo-Fernandezb,
Filipe Bragab and
Laurence J. Hardwick
 b
b
aDepartment of Chemistry, Quaid-I-Azam University, Islamabad, Pakistan. E-mail: humairas@qau.edu.pk
bStephenson Institute for Renewable Energy, Department of Chemistry, University of Liverpool, L69 7ZF, UK
cSustainable Energy Technologies (SET) Centre, College of Engineering, King Saud University, PO-Box 800, Riyadh 11421, Saudi Arabia. E-mail: urana@ksu.edu.sa
dChemical Engineering Department, College of Engineering, King Saud University, PO-Box 800, Riyadh 11421, Saudi Arabia
First published on 28th November 2017
Abstract
The present study describes a template-free single step carbonization route to prepare hierarchically structured nitrogen-doped carbon materials (NCMs) by using an organic ionic dye (OID), ammonium purpurate (murexide). These NCMs exhibited moderate specific surface area (307 m2 g−1 for NCM(MDE)-900) and hierarchical macro/meso/microporous structures with abundant nitrogenous functionalities that contributed towards the high specific capacitance displayed by pseudocapacitive contribution. In particular, the NCM(MDE)-800 displayed superior specific capacitance (222 F g−1 at 3 A g−1) and excellent cyclic stability of ∼10![[thin space (1/6-em)]](https://www.rsc.org/images/entities/char_2009.gif) 000 cycles at 10 A g−1 in 1 M 1.0 M H2SO4(aq). The material prepared at higher temperature, viz. NCM(MDE)-900, exhibited high rate capability at 50 A g−1, which is 92% of their specific capacitances at 10 A g−1. Further systematic investigations of NCM(MDE)-800 in three different electrolytes, viz. 1.0 M H2SO4(aq), 6 M KOH(aq) and 0.5 M Na2SO4(aq), revealed that 1.0 M H2SO4(aq) is a promising electrolyte for achieving good specific capacitance, high capacitive retention and long term cyclic stability, which might have its origins in the formation of ionic interactions between the active protons in 1.0 M H2SO4(aq) and the alpha carbon atoms with Lewis basic character next to the nitrogen in these NCMs.
000 cycles at 10 A g−1 in 1 M 1.0 M H2SO4(aq). The material prepared at higher temperature, viz. NCM(MDE)-900, exhibited high rate capability at 50 A g−1, which is 92% of their specific capacitances at 10 A g−1. Further systematic investigations of NCM(MDE)-800 in three different electrolytes, viz. 1.0 M H2SO4(aq), 6 M KOH(aq) and 0.5 M Na2SO4(aq), revealed that 1.0 M H2SO4(aq) is a promising electrolyte for achieving good specific capacitance, high capacitive retention and long term cyclic stability, which might have its origins in the formation of ionic interactions between the active protons in 1.0 M H2SO4(aq) and the alpha carbon atoms with Lewis basic character next to the nitrogen in these NCMs.
Introduction
Electrochemical capacitors (ECs), also known as ultracapacitors or supercapacitors1 belong to the class of electrochemical energy storage (EES) devices that find applications in electric vehicles2 and several small to medium power electronic systems.3–5 Based on the charge storage mechanisms, ECs can be categorized into two types: (1) the electrochemical double layer capacitors (EDLC), which are capable of storing energy electrostatically by the simple non-faradaic adsorption of ions from the electrolyte onto the large surface area electrodes; (2) the pseudocapacitors that benefit from the phenomenon of electrostatic charge storage, like EDLC, accompanied by a sequence of fast, reversible redox processes, electrosorption or intercalation.2 In general, the performance of ECs largely depends on the physical and chemical nature of the active electrode material.6 For EDLC applications, different varieties of carbon materials such as carbon black, graphene,7 carbon nanotubes,8 and carbon onions9 have been extensively exploited due to their high electrical conductivity, high surface area and excellent cyclic stability.2One possible way to achieve high energy density and power density along with high specific capacitance and long cyclic life in EDLCs is to introduce a foreign heteroatom functionality such as nitrogen,10 oxygen,11 sulphur, boron and phosphorous12 into the carbon framework.11,13 Typically, nitrogen is found to be the most suitable heteroatom that upon doping in the carbon framework leads to superior capacitance, electronic conductivity,14 surface wettability15 and cycle life, due to its pseudo-capacitive contribution.16,17 Though the actual role of doped nitrogen content and its types (pyridinic-N, pyrrolic-N or graphitic-N) for the capacitive performance of nitrogen doped carbon materials (NCMs) is still unclear, a recent study by J. Nakamura and co-workers18 describes how the conjugation between the nitrogen lone pair and the π-bonding network of the carbon lattice dramatically change the physiochemical properties of the NCMs. Both the amount of doped nitrogen content and the type of nitrogen functionality can make remarkable improvements in achieving superior capacitive performance and better cyclic stability.19 Moreover, the Lewis basicity of carbon atoms adjacent to the nitrogen and the lone pair of electrons on the doped nitrogen atoms offer active sites to develop ionic interactions in the electrolyte, which therefore induce reversible fast redox reactions during potential cycling and make pseudocapacitive contributions to the overall charge storage by these materials.20,21 For high energy and high power density applications, the supercapacitor electrode material must contain hierarchical porous structures with abundant micropores (accumulate charge effectively), interconnected mesopores (reduce the ion diffusion distance) and appropriate macropores (serve as ion buffering reservoirs for electrolyte ions) to facilitate fast trafficking of ions and their interactions with the active sites of the electrode material.22,23
To obtain the desired properties in the nitrogen doped carbon materials, most of the strategies involve using hard or soft templates to achieve high surface area and highly porous structures. The use of any of these template methods has its disadvantages, which therefore make the overall process of synthesis quite complicated, with the final product containing small fractions of impurities coming from the template itself.19,24,25 In some cases, the removal of template requires harsh experimental conditions (use of HF to remove SiO2 template) and trace amounts of template are found to have significant impact on the properties of such materials prepared by template assisted routes.26 More recently, Watanabe and co-workers reported a new strategy of using protic ionic salt (PIS) based precursors containing aromatic heteroatoms or π-conjugated systems that impart special thermal stability to the PIS. This high thermal stability plays a major role in producing highly graphitized nitrogen rich carbon networks during high temperature carbonization.27 Like PISs, organic ionic dyes (OIDs), commonly used in the pigment industry, are also highly conjugated carbon networks with a variety of structurally bound nitrogen atoms. These OIDs are cheap and commercially available in large quantities, due to their simple synthesis route making them potential candidates to synthesize NCMs for electrochemical device applications.28 Moreover, the use of OIDs as a precursor for NCMs is in its infancy and further investigation of these systems is required to produce NCMs with desired properties for supercapacitor application.
The present work describes a simple template-free route for the synthesis of nitrogen doped carbon materials (NCMs) by using the OID (ammonium purpurate aka murexide with formula [NH4+][C8H4N5O6−]). The unique chemical nature of this dye (ammonium cation and purpurate anion) and the molecular structure of the organic anion (abundant carbonyl groups) make this precursor a suitable candidate for high temperature carbonization, since the in situ release of gaseous products (CO2 and NH3) may act as an internal porogen to form hierarchical porous structures in the final NCMs. The detailed investigation of the newly synthesized NCMs, particularly NCM(MDE)-800, reveals the superior specific capacitance (222 F g−1 at 3 A g−1), rate capability and cyclic stability (10![[thin space (1/6-em)]](https://www.rsc.org/images/entities/char_2009.gif) 000 cycles at 10 A g−1) of this material, outperforming several known NCMs reported to date.4,29–32
000 cycles at 10 A g−1) of this material, outperforming several known NCMs reported to date.4,29–32
Materials and methods
Synthesis of NCM(MDE)-X
Nitrogen-doped carbon materials (NCMs) were synthesized from murexide (ammonium purpurate, [NH4+][C8H4N5O6−]) by a simple one step carbonization method in a vacuum furnace (MTI model: VBF-1200X). In brief, 10 g of murexide were placed into the furnace in a ceramic crucible covered with a lid. The material was annealed under inert Ar environment (flow rate of 150 cm3 min−1) at 700–900 °C (heating rate of 10 °C min−1) for 2 h. Afterwards, the fine carbon powder formed was first washed with dilute hydrochloric acid (0.1 M) to remove any possible impurities formed during the carbonization process, followed by washing with water to neutralize the pH. The pyrolysis products formed at X °C were denoted as NCM(MDE)-X, where X represents the pyrolysis temperature (being X = 700, 800 or 900). Finally, the synthesized NCMs were dried overnight in a vacuum oven at 80 °C.Physiochemical characterization
Thermogravimetric analysis (TGA) was performed on the pure murexide to examine the thermal degradation of the precursor using a thermogravimetric analyser (Linseis STA PT-1000) at a 10 °C min−1 temperature ramp under Ar flow. For morphological characterization, a Quanta FEG 450 field emission scanning electron microscope (FE-SEM) and JEOL 3010 transmission electron microscope (TEM) operating at 300 kV, and JEOL 2100F (200 kV) were used. The X-ray powder diffraction (XRD) patterns were recorded using a STOE Theta/theta X-ray Diffractometer System with monochromatic Cu Kα radiation of wavelength, λ = 1.54060 nm operating at 20 kV and 5 mA within 20–60 (2θ). Raman spectra were recorded for NCMs with a Renishaw in Via Reflex system with a He–Ne laser (632.8 nm) to measure the extent of graphitization, and ATR-FTIR spectra were recorded (Bruker-Tensor II) to examine the functional groups attached to the synthesized NCMs. An X-ray photoelectron spectrometer (PSP Electron Energy Analyzer) with Mg Kα radiation (hν = 1253.6 eV, 12 kV, 144 W) under a base pressure of <2 × 10⁻¹⁰ mbar with H2 as the main residual gas was employed for surface elemental compositional analysis of carbon and other heteroatoms present in the newly synthesized NCMs. The specific surface area of the catalysts was determined from N2 adsorption–desorption data at 77 K by using a Micromeritics Tristar II 3020 surface area and porosity analyzer. For each analysis, 0.3 g of sample was degassed at 300 °C for 3 h to remove any possible moisture content from the NCMs surface as well as other adsorbed gases. The pore size distribution (PSD) plot was recorded based on the Barret–Joyner–Halenda (BJH) model.Electrochemical studies
The working electrodes for electrochemical characterization were prepared by mixing 80% of the as synthesized carbon material NCM(MDE)-X with 10% carbon black (Super C 65, TIMCAL) and 10% polyvinylidene fluoride (PVDF) in N-methylpyrrolidinone to form a homogeneous ink by ultrasonication for 1.5 h. This ink was coated onto a monolith substrate (1 cm2) and dried under an infrared lamp; the electrodes were dried at 80 °C in an oven overnight. The mass loading of active material on each current collector was 2 mg.The electrochemical behaviour of NCM(MDE)-X materials was investigated using three electrode systems on a potentiostat/galvanostat (VMP Biologic) at room temperature (25 °C). The working electrode was fabricated as described above. Ag/AgCl(saturated) was used as the reference electrode and Pt as the counter electrode. Aqueous 1 M H2SO4, 6 M KOH and 0.5 M Na2SO4 solutions were used as electrolytes in this study. Prior to electrochemical studies, all electrolytes were thoroughly purged with highly pure nitrogen for half an hour to remove oxygen, while a nitrogen blanket was kept above the solution during measurements. Cyclic voltammetry (CV) studies were performed at scan rate of 5–200 mV s−1 in the −0.8 V to +0.2 V voltage window. The current densities applied in the galvanostatic charge–discharge (CD) experiments were between 1–50 A g−1. Electrochemical impedance spectroscopy (EIS) was performed in the 10 mHz to 100 kHz frequency range under the influence of 5 mV AC frequency amplitude.
The specific or gravimetric capacitance (Cs) was calculated from CD measurements, using the following equation:
 | (1) |
Results and discussion
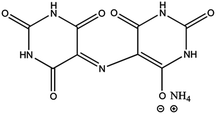
A brief overview of the present literature on the developments of heteroatom-doped carbon materials, particularly NCMs, shows that most of the efforts remain focused on using templating strategies to achieve high surface areas in these materials.19,33–35 However, the use of either a hard template such as nanosized silica particles,19 or soft templates such as use of molten salts,36 have their own drawbacks37 and there is a huge controversy about calling such doped carbon materials true metal free systems.26 In the present work, an ammonium based organic ionic dye ([NH4+][C8H4N5O6−]) is used to exploit the benefits of the in situ release of gaseous products (CO2 and NH3) that produce highly porous carbon structures without involving a foreign additive as a template.Ammonium purpurate (ammonium 2,6-dioxo-5-[(2,4,6-trioxo-5-hexahydropyrimidinylidene)amino]-3H-pyrimidin-4-olate), commonly known as murexide, is a commercially available OID with molecular formula C8H8N6O6 as shown in Fig. 1. It is frequently used as an indicator for complexometric titrations in water hardness measurements as well as a colorant/pigment in the dye industry. Fig. S1 (ESI†) displays the typical trace for thermogravimetric analysis (TGA) of murexide that was recorded from room temperature to 1000 °C under Ar atmosphere. The initial weight loss of about 6–7% up to 230 °C can be attributed to the loss of moisture in this material. The major weight loss (up to 90%) occurred in two steps from 230 °C to 440 °C, leaving 10% carbon residue at temperatures over 600 °C. The high thermal stability of the ammonium purpurate has been reported to be due to several solid–solid phase transitions arising from the mobile ammonium ion, which forms hydrogen bonding networks in different ways.38 All NCMs were therefore prepared at temperatures over 600 °C (i.e. 700, 800 and 900 °C) to ensure the complete carbonization of the template free precursor.
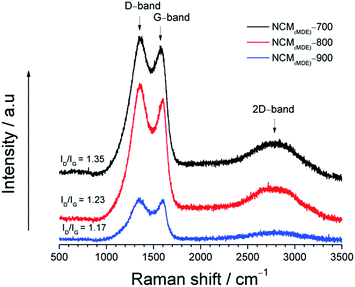
Fig. 2 shows Raman spectra collected for the newly synthesized NCMs with increasing annealing temperature from 700 °C to 800 °C to 900 °C (NCM(MDE)-700, NCM(MDE)-800 and NCM(MDE)-900, respectively). All samples have two distinct peaks at 1358 cm−1 and 1590 cm−1, designated as D and G bands, respectively. In general, the D band arises from the breathing mode of sp2 carbons on edges or defects indicating a degree of disorder, whereas the stretching motion of sp2 carbons generates the graphitic G band.39,40 The level of disorder in the carbon structure due to the incorporation of dopant heteroatoms can be determined from the intensity ratio of D and G bands.41
The Raman spectra of these NCMs showed a typical trend of decreasing ID/IG intensity ratio from NCM(MDE)-700 → NCM(MDE)-800 → NCM(MDE)-900. This in turn suggests that the NCMs synthesized at higher carbonization temperatures achieve higher degree of graphitization as indicated by the lower ID/IG intensity ratio42 values as shown in Table 1.
| Sample ID | NCM(MDE)-700 | NCM(MDE)-800 | NCM(MDE)-900 |
|---|---|---|---|
| ID/IG ratio | 1.35 | 1.23 | 1.17 |
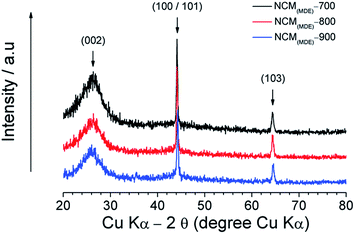
The formation of graphitic phases and the level of disorder in the carbon structure introduced by the nitrogen heteroatom were also investigated by XRD. From Fig. 3, it can be seen that the XRD patterns of all three NCMs (i.e., NCM(MDE)-700, NCM(MDE)-800 and NCM(MDE)-900) display a diffuse peak centred around ca. 2θ = 26° and two sharp peaks ca. 2θ = 44°, and 2θ = 64.2°. In the case of the former, the diffuse peak at ca. 2θ = 26° corresponds to the (002) plane, while the sharp XRD reflection at 2θ = 44° is consistent with the (100/101) set of planes, and the 2θ = 64.2° peak is consistent with the (103) plane of hexagonal graphitic carbon.43,44 The presence of the broad (002) peak together with the sharp peaks (100/101) and (103) in the XRD patterns of these NCMs indicates the co-existence of amorphous and crystalline phases. The former phase is related to the disordered structure, manifesting heteroatom (nitrogen) doping, while the latter phase confirms the level of ordered structure maintained by these NCMs even at high nitrogen content. The existence of a crystalline zone is further evidenced by SAED patterns (Fig. S3†). It has been reported that the 002 peak broadens upon high nitrogen doping in the graphitic carbon framework.45 The full width at half maximum (FWHM) of this peak (5.9 for NCM(MDE)-700, 5.3 for NCM(MDE)-800 and 4.8 for NCM(MDE)-900) decreases with the increase in annealing temperature from 700 °C to 800 °C to 900 °C. This observation suggests that the high temperature carbonization leads to a high degree of graphitization (due to low nitrogen content).4 A number of previously reported heteroatom doped carbon materials (such as nitrogen-doped,46 nitrogen/sulphur co-doped47 and nitrogen/phosphorous co-doped19) display XRD patterns with only broad diffuse peaks, indicating highly disordered structures with amorphous carbon as the dominant phase. It is important to note that the NCMs synthesized in the present study were washed with dilute HCl, thus excluding any possibility of the presence of metallic components in them. In this scenario, the emergence of crystalline phases indicates a very distinct feature of these materials, which might have an influence on the superior electrochemical performances displayed by these NCMs as discussed later.
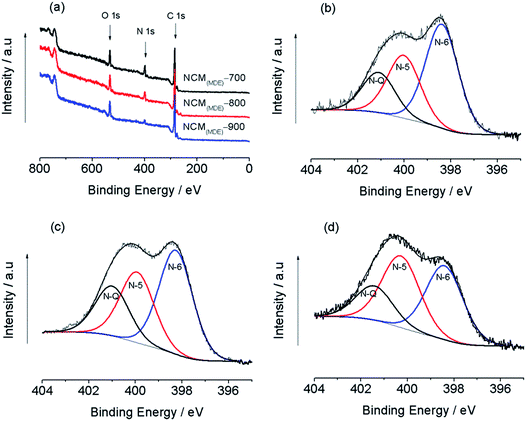
Fig. 4(a) displays the comparison of typical X-ray photoelectron spectroscopy (XPS) survey scans for NCM(MDE)-700, NCM(MDE)-800 and NCM(MDE)-900, indicating the presence of C 1s, N 1s, and O 1s in these newly synthesized NCMs.
Table 2 shows the amount of nitrogen, carbon and oxygen as determined from the core level XPS spectra of NCM(MDE)-700, NCM(MDE)-800 and NCM(MDE)-900. As expected, the atomic percentage of doped nitrogen content decreased consistently from 12.17 to 9.40 to 4.72% as temperature increased for NCM(MDE)-700 to NCM(MDE)-800 to NCM(MDE)-900 materials, respectively. The elemental analysis given in Table S1 (in the ESI†) is also in agreement with this trend. This clearly indicates that high annealing temperature has a detrimental effect on the content of nitrogen doped in these materials. To identify the nature of nitrogen functionalities, the N 1s peak region in the XPS survey spectra of all NCMs was deconvoluted and fitted with three component peaks, ca. (398.27 ± 0.1 eV), (399.93 ± 0.1 eV) and (401.00 ± 0.1 eV), which are ascribed to pyridinic-N (N-6), pyrrolic-N (N-5) and quaternary-N (N-Q), respectively for NCM(MDE)-800 (Fig. 4(b–d)).48,49 These nitrogen functionalities are involved in different types of chemical bonding with their neighbouring carbon atoms, which play a major role in the superior electrochemical performances of these materials. Table 3 shows that the NCM(MDE)-700 has the highest amount of pyridinic nitrogen (N-6) content (50.19%), compared to NCM(MDE)-800 (46.33%) and NCM(MDE)-900 (41.06%). An opposite trend is observed for pyrrolic-N (N-5) content in these NCMs with increasing carbonization temperature, where the XPS data in Table 3 shows that the NCM(MDE)-900 contains the highest proportion of pyrrolic-N (N-5) (39.88%) compared to NCM(MDE)-800 (31.46%) and NCM(MDE)-700 (30.34%). Interestingly, the change in carbonization temperature does not show much impact on the amount of quaternary-N (N-Q) in these NCMs. The XPS data in Table 3 also reveals that the NCM(MDE)-700 and NCM(MDE)-900 have nearly the same proportion of quaternary-N (N-Q) content (19.47 ± 0.05% and 19.07 ± 0.05%, respectively) and the highest content of quaternary-N (N-Q) is present in the NCM(MDE)-800 sample (22.2%). It has been previously reported that the pyridinic-N (N-6) and pyrrolic-N (N-5) type nitrogen functionalities can deliver free electrons to the conduction band, which contribute in the pseudocapacitive faradaic reactions.50,51 The most stable nitrogen configuration compared to other nitrogen functionalities, quaternary-N (N-Q), accounts for the graphitic component intrinsically displaying high electronic conductivity and enhancing capacitance by creating active sites and helping electron transportation.19,52,53 The NCM(MDE)-800 material, having the highest quaternary-N (N-Q) content in addition to a reasonable proportion of the pyridinic-N (N-6) content, presents superior performance for supercapacitor application.
| Sample ID | N 1s (%) | C 1s (%) | O 1s (%) |
|---|---|---|---|
| NCM(MDE)-700 | 12.17 | 73.14 | 14.69 |
| NCM(MDE)-800 | 9.40 | 75.63 | 14.97 |
| NCM(MDE)-900 | 4.72 | 79.42 | 15.86 |
| Sample ID | Pyridinic-N (N-6) (%) | Pyrrolic-N (N-5) (%) | Quaternary-N (N-Q) (%) |
|---|---|---|---|
| NCM(MDE)-700 | 50.19 | 30.34 | 19.47 |
| NCM(MDE)-800 | 46.33 | 31.46 | 22.20 |
| NCM(MDE)-900 | 41.06 | 39.88 | 19.07 |
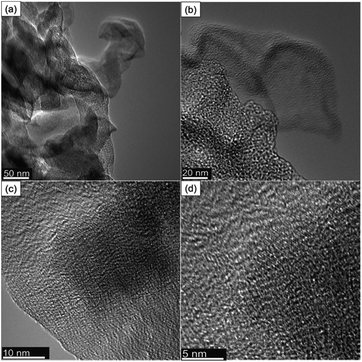
Field emission scanning electron microscopy (FE-SEM) was used to examine the morphology of the synthesized NCM(MDE)-X materials. The SEM micrographs at low and high magnification in Fig. 5 show loosely stacked graphitic sheet-like morphology for all materials; in addition to sheets, some globular structures were also formed. Fig. S2 (in the ESI†) displays the energy-dispersive X-ray spectroscopy elemental mapping of NCM(MDE)-800, indicating the homogeneous distribution of nitrogen doping throughout the material. For charge transfer on the large electrode/electrolyte interface, the nanosheet architecture offers minimum resistance to mass transport, which is an important parameter for supercapacitor materials because shorter diffusion traveling distances ease ion transport.54–56,56–58 HRTEM images for NCM(MDE)-800 show that the material has nano graphitic sheets as shown in Fig. 6. The images also show the rough texture due to the porosity of the material, as confirmed by the surface area and porosity analysis described later. Selected area electron diffraction (SAED) images show the crystalline and amorphous nature of the material, depending on the region (Fig. S3(b and d) in ESI†). The SAED pattern of the crystalline phase presents defined rings with bright spots from the diffraction of the lattice. The average d-spacing values calculated from the SAED pattern are 0.22 nm (101), 0.15 nm and 0.12 nm. The conductive graphitic layers provide paths for fast electron transport while nanopores serve as active sites for ions.59 All these characteristics are important for excellent supercapacitive electrode materials.
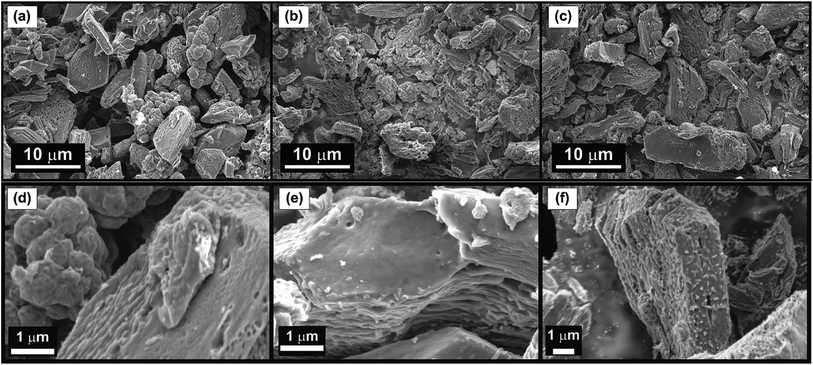 | ||
| Fig. 5 Low and high magnification FE-SEM images of NCM(MDE)-700 (a, d), NCM(MDE)-800 (b, e) and NCM(MDE)-900 (c, f). | ||
The surface area and porosity characteristics of the synthesized NCM(MDE)-X were investigated by N2 adsorption–desorption isotherms Fig. S4 (in the ESI†). It can be seen that the shapes of the isotherms were nearly identical for all NCM(MDE)-X materials and can be categorized as type IV with a characteristic type H4 hysteresis loop at p/po > 0.4, which is indicative of the presence of micropores and mesopores.60,61 The nearly linear middle portion in these isotherms signifies multilayer adsorption, while the hysteresis shows capillary condensation in the mesopores.62 Interestingly, in NCM(MDE)-700, the steep region of the desorption branch reached a non-closure point at lower relative pressure, indicating irreversible interaction between N2 and the absorbent. However, at higher relative pressure, the almost linear uptake indicates the existence of macropores.62 The BET data shown in Table S2† reveal that the NCM(MDE)-700, NCM(MDE)-800, NCM(MDE)-900 exhibited a surface area ∼128, 287 and 307 m2 g−1 and average pore diameters of 11.46, 10.09 and 9.39 nm, respectively. Fig. S5 (in the ESI†) shows the pore size distribution (PSD) profiles for NCM(MDE)-700, NCM(MDE)-800, NCM(MDE)-900, with the inset displaying the PSD profiles for these materials up to the 10 nm scale, indicating the porosity of all NCMs lying in the mesoporous region (pore diameter < 50 nm). Macropores and mesopores serve as ion buffering reservoirs and decrease ion transportation distance, while micropores contribute to energy storage.60,63,64 The detailed porosity analysis results of NCM(MDE)-X are summarized in Table S2.†
The BET results (Table S2†) show that in going from NCM-700 → NCM-800, the increase in surface area is around 160 m2 g−1, whereas the reduction in particle size is around 26 nm. At further high annealing temperature, in going from NCM-800 → NCM-900, the increase in the surface area was about 20 m2 g−1, whereas the reduction in particle size was only 1.38 nm. This comparison suggests that the particle size reduction was smaller in going from NCM-800 → NCM-900 when compared to particle size reduction in going from NCM-700 → NCM-800. Table S2† also shows that the total pore volume shows a similar incremental change of 0.03 cm3 g−1 in going from NCM-700 → NCM-800 and further from NCM-800 → NCM-900. From this observation, it can be concluded that the increase in pore volume in going from NCM-800 → NCM-900 contributed more to the increase in surface area of about 20 m2 g−1 in NCM-900 sample, which in other cases could not be explained based on the particle size reduction. There is another correlation that can be seen between the total pore volume and the ID/IG values from Raman studies, where an increase in annealing temperature causes a low ID/IG value and corresponding high total pore volume in these NCMs. The loss of entrapped nitrogen at elevated temperature causes increased porosity and improves the graphitic character as indicated by the low ID/IG value.
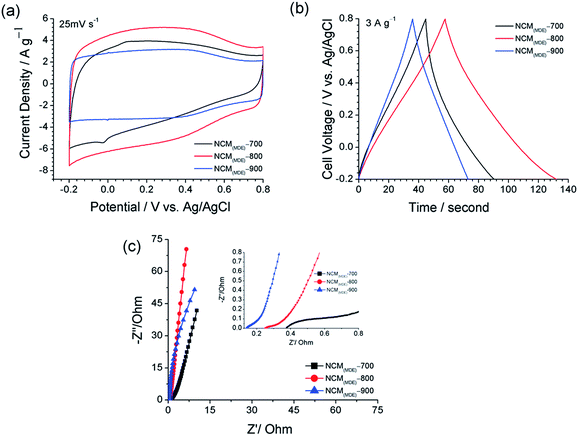
The electrochemical performances of the NCM(MDE)-700, NCM(MDE)-800 and NCM(MDE)-900 were tested as electrode materials for supercapacitor application in a three-electrode configuration cell using Ag/AgCl(saturated) as the reference electrode and Pt as the counter electrode. In brief, the working electrodes were cast with 2 mg of electroactive material loaded on a graphite monolith substrate (details in the Experimental section). The initial set of electrochemical studies was performed in 1.0 M H2SO4(aq) within the voltage window from −0.2 and +0.8 V vs. Ag/AgCl. Fig. 7(a) shows the CV profiles recorded for NCM(MDE)-700, NCM(MDE)-800 and NCM(MDE)-900 at the scan rate of 25 mV s−1, where all the materials exhibited nearly rectangular shapes, which typically represent the contribution from electrical double layer capacitance (EDLC). In Fig. 7(a), the NCM(MDE)-700 and NCM(MDE)-800 exhibit slightly curved CV profiles indicating redox reactions possibly coming from the interactions between the doped nitrogen functionalities and the H+ in the acidic electrolyte media.1 From CV profiles, the current densities of NCM(MDE)-X electrodes increase in the following order: NCM(MDE)-800 > NCM(MDE)-700 > NCM(MDE)-900. The high current density displayed by NCM(MDE)-800 can be attributed to the overall high nitrogen content (9.40%) and moderate surface area (287 m2 g−1) of this material.
The capacitance performances of the NCM(MDE)-X materials were further investigated by carrying out the galvanostatic charge–discharge (GCD) experiments at different current densities in the voltage window between −0.2 and +0.8 V vs. Ag/AgCl. Fig. 7(b) shows the GCD profiles for NCM(MDE)-700, NCM(MDE)-800 and NCM(MDE)-900 at the current density of 3 A g−1. These GCD curves display a negligible ohmic drop (iR), which is indicative of low internal resistance in these materials. According to eqn (1), the calculated specific capacitance (Cs) value at 3 A g−1 for NCM(MDE)-800 is 222 F g−1, which is higher than 138, and 111 F g−1 for NCM(MDE)-700 and NCM(MDE)-900, respectively. There are a number of factors that contribute to the superior capacitive performance of NCM(MDE)-800 compared to NCM(MDE)-700 and NCM(MDE)-900; these can be broadly categorized as high surface area (287 m2 g−1), appreciable pore volume (0.13 cm3 g−1), high doped nitrogen content of 9.4% with highest quaternary nitrogen functionality, and the highest micropore to total pore volume ratio (0.85). All these factors have their own influence on the capacitive performance of the materials: high surface area offers more charge storage platform, high nitrogen content offers more pseudocapcitive contribution in the overall charge storage, quaternary nitrogen functionality is the most stable and conductive type among other nitrogen functionalities, and lastly, the highest micropore to total pore volume ratio (0.85), which suggests ease of mass transport of ions from electrolyte through porous carbon network with greater access to ion-accessible surface area and number of electroactive sites. The supercapacitor performances of recently reported nitrogen doped carbon materials synthesized from different precursors are given in Table 4 for comparison purposes.
| Carbon precursor | Surface area (m2 g−1) | N (at%) | Capacitance (F g−1) | Current density (A g−1) | Electrolyte | References |
|---|---|---|---|---|---|---|
| Murexide | 307 | 9.40 | 222 | 3 | 1.0 M H2SO4 | Current work |
| Lecithin | 1803 | 9.2 | 285 | 0.5 | 1.0 M KOH | 1 |
| Copolymer P123 | 2144 | 8.25 | 537 | 0.5 | 0.5 M H2SO4 | 70 |
| Sucrose | 518 | 3 | 277 | 0.5 | 1.0 M H2SO4 | 71 |
| Tobacco waste | 1104 | 19 | 170 | 0.5 | 6.0 M KOH | 30 |
| Chicken feather | 2515 | 2.46 | 351 | 0.1 | 6.0 M KOH | 44 |
| Fermented rice | 2106 | — | 219 | 15 | KOH | 72 |
| Human hair | 451 | 2.82 | 192 | 0.3 | KOH | 73 |
| Disodium magnesium EDTA | 1258 | 5.43 | 281 | 0.05 | 6 M KOH | 5 |
| Chicken egg shells | 221 | 8 | 297 | 0.2 | 1.0 M KOH | 74 |
Electrochemical impedance spectroscopy (EIS) is a very powerful technique to investigate the electronic and electrochemical responses of an electrode in contact with an electrolyte. From Fig. 7(c), we can see that the Nyquist plots for all NCMs exhibit quasi-semicircles in the high-frequency region followed by linear traits at low-frequencies. The quasi-semicircle at high-frequencies is visible for NCM(MDE)-700, and is significantly reduced in NCM(MDE)-800 and it is practically absent in the case of the NCM(MDE)-900 plot. Meanwhile, the near-linear spike in the case of both NCM(MDE)-800 and NCM(MDE)-900, with slope approaching closer to 90° in the low frequency region, suggests an improvement in the capacitive behaviour with fast charge carrier diffusion (high electronic conductivity) in these materials upon electrode polarization.65–67 The lowest ESR value for NCM(MDE)-900 indicates high electronic conductivity and low overall cell resistance for this material, which might have its origin in the higher degree of graphitization due to low levels of heteroatom doping.44 The Bode plots display the dependence of the phase angle on the frequency. In general, the phase angle between 90° and 45° is caused by the capacitive behaviour of a system; values close to 90° are observed in the response of an ideal capacitor. Fig. S6† shows that the NCM(MDE)-800 electrode has the highest phase angle, almost 86° at 10 mHz AC frequency, close to the ideal capacitor behaviour.
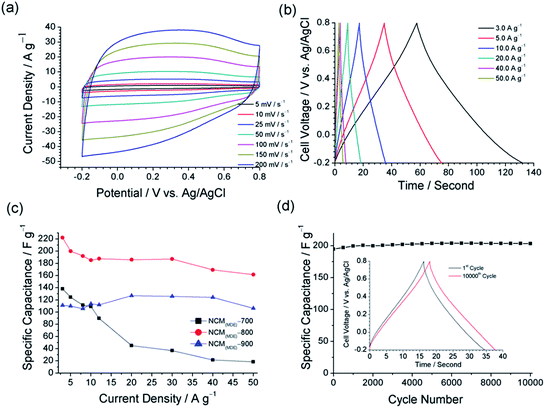
Since high power demanding applications require the charging and discharging of electrode material at high current densities, high capacitance retention at high scan rates or at high current densities is key for practical applications. From Fig. 8(a), we can see that the CV curves for NCM(MDE)-800 in 1 M H2SO4(aq) exhibit a linear increase in current density with increasing scan rate from 5 mV s−1 to 200 mV s−1. Fig. 8(b) displays the galvanostatic charge–discharge (CD) curves for NCM(MDE)-800 with increasing current density values from 3 A g−1 to 50 A g−1. The charging and discharging segments of GCD curves display symmetrical triangles, even at high current density values, indicating fast charge–discharge dynamics and good capacitive performances. Fig. 8(c) displays the values of specific capacitance for all NCMs as a function of the current density. From Fig. 8(c), a rapid decrease in the specific capacitance of NCM(MDE)-700 can be observed with an increase in current density from 3 to 50 A g−1. The poor micropore/total pore volume ratio for this material indicates fewer micropores in this material, which could be one reason for the decreasing specific capacitance at high current density. In general, fast electrolyte dynamics at high density require adequate levels of micropores in the material to allow facile trafficking of electrolyte ions and their interactions with the active sites at the material interface. The other high temperature materials, viz. NCM(MDE)-800 and NCM(MDE)-900, display specific capacitances of 161 F g−1 and 106 F g−1 at a higher current density of 50 A g−1, which is 87% and 92% of their specific capacitances at 10 A g−1, respectively. From Fig. S7 (ESI†), the CV profiles for NCM(MDE)-800 and NCM(MDE)-900 NCM(MDE)-X also exhibit high rate capability, since no distortion was observed in the CV curves for these materials with increasing the scan rate from 5 to 200 mV s−1. High capacitance retention of NCM(MDE)-800 and NCM(MDE)-900 might have its origin in the adequate size distribution of micro/mesopores in the material, providing better access for the electrolyte and allowing fast ion trafficking at high scan rates.68 The long term cycling stability of NCM(MDE)-800 was also tested by carrying out the GCD experiment up to 10![[thin space (1/6-em)]](https://www.rsc.org/images/entities/char_2009.gif) 000 cycles at the current density of 10 A g−1. Fig. 8(d) shows the corresponding plot of specific capacitance versus cycle number for NCM(MDE)-800 within the −0.2 V to 0.8 V potential window and exhibiting 100% capacitive retention for this material. From this plot, it is evident that the initial value of the specific capacitance of 195 F g−1 progressively increased with GCD cycling and reached a value of 203 F g−1 after 10
000 cycles at the current density of 10 A g−1. Fig. 8(d) shows the corresponding plot of specific capacitance versus cycle number for NCM(MDE)-800 within the −0.2 V to 0.8 V potential window and exhibiting 100% capacitive retention for this material. From this plot, it is evident that the initial value of the specific capacitance of 195 F g−1 progressively increased with GCD cycling and reached a value of 203 F g−1 after 10![[thin space (1/6-em)]](https://www.rsc.org/images/entities/char_2009.gif) 000 cycles. Moreover, the triangular shape of the 10,000th GCD cycle, shown in Fig. 8(d) inset, also indicates that the NCM(MDE)-800 electrode has good charge propagation and exhibits stable performance over extended periods of time.69
000 cycles. Moreover, the triangular shape of the 10,000th GCD cycle, shown in Fig. 8(d) inset, also indicates that the NCM(MDE)-800 electrode has good charge propagation and exhibits stable performance over extended periods of time.69
In Fig. S8,† the EIS measurements on NCM(MDE)-800 before and after 10![[thin space (1/6-em)]](https://www.rsc.org/images/entities/char_2009.gif) 000 GCD cycles shows an improvement in the capacitance as indicated by the increase in phase angle (Bode plot). Overall, it can be concluded that long term cycling serves as a means of electrochemical activation under the influence of an electric field, which may allow better penetration of the hydrated electrolyte ions into the micropores.75,76
000 GCD cycles shows an improvement in the capacitance as indicated by the increase in phase angle (Bode plot). Overall, it can be concluded that long term cycling serves as a means of electrochemical activation under the influence of an electric field, which may allow better penetration of the hydrated electrolyte ions into the micropores.75,76
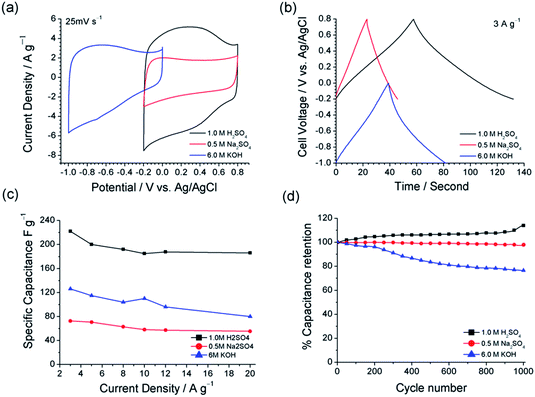
As a potential electrode material for supercapacitor application, further electrochemical studies were carried out for NCM(MDE)-800 in three different electrolyte solutions to investigate the effect of solution pH and the nature of ions from the electrolyte. Fig. 9(a) displays the CV profiles for NCM(MDE)-800 recorded in 1 M H2SO4(aq), 6 M KOH(aq) and 0.5 M Na2SO4(aq) electrolytes with respective pH values of 0.87, 13.8 and 7.9, at the scan rate of 25 mV s−1. The CV profiles recorded in 1 M H2SO4(aq) and 6 M KOH(aq) have the rectangular shaped curves with superimposed redox peaks due to surface functionalities. These redox peaks are associated with different types of chemical interactions formed between the surface nitrogen functionalities and the active ions in the electrolyte media. Fig. 10 shows an illustration of possible types of ionic interactions that can occur between the surface nitrogen functionalities (N6/N5) and the ions in the acidic and basic media during potential cycling, which in turn explain the pseudocapacitive contribution of the nitrogen moieties in these materials.19,61 In contrast, the CV curve recorded for NCM(MDE)-800 in neutral electrolyte (0.5 M Na2SO4(aq)) exhibits the double layer capacitance with the absence of redox peaks. Moreover, NCM(MDE)-800 achieves higher current density in 1 M H2SO4(aq) compared to 6 M KOH(aq), while the lowest current density is observed in 0.5 M Na2SO4(aq) electrolyte. The redox peaks from the CV profiles of NCM(MDE)-800 in 1 M H2SO4(aq) and 6 M KOH(aq) indicate that the carbon atoms with Lewis basicity next to nitrogen and the lone pair of electrons on doped nitrogen itself likely develop coulombic interactions with the active proton (H+) in the acidic media or hydroxide (OH−) in the basic media at the initial stage. Later on, these ionic interactions may lead to reversible redox reactions, as evident from the CV profiles of NCM(MDE)-800 in acidic and basic media,26 as shown in Fig. 10. The corresponding CV curves for these materials at the scan rates of 5, 50, 100 and 200 mV s−1 are shown in Fig. S9.†
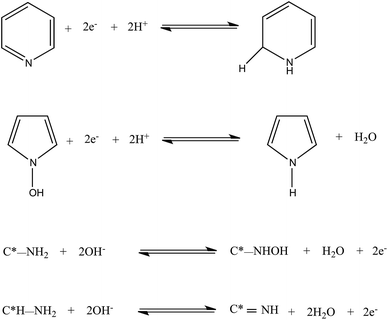 | ||
| Fig. 10 Illustration of possible types of ionic interactions between the surface nitrogen functionalities (N6/N5) and the ions in the acidic and basic media during potential cycling. | ||
In Fig. 9(b), the GCD curves recorded for NCM(MDE)-800 in these three different electrolyte media at current density ∼3 A g−1 also support the results from CV measurements with much longer discharging time observed in 1 M H2SO4(aq), compared to 6 M KOH(aq) and 0.5 M Na2SO4(aq). The values of specific capacitance calculated for NCM(MDE)-800 at 3 A g−1 in 1 M H2SO4(aq), 6 M KOH(aq) and 0.5 M Na2SO4(aq) electrolytes are 222, 126 and 73 F g−1, respectively.
The specific capacitance values recorded for NCM(MDE)-800 in 1 M H2SO4(aq), 6 M KOH(aq) and 0.5 M Na2SO4(aq) electrolytes at different current densities (from 3 to 20 A g−1) are shown in Fig. 9(c). Interestingly, the NCM(MDE)-800 exhibits a notable decrease in Cs from 3 A g−1 to 5 A g−1 in the case of both acidic (1 M H2SO4(aq)) and basic (6 M KOH(aq)) electrolytes, whereas a less rapid decrease in Cs was observed for the CD profiles recorded in 0.5 M Na2SO4(aq) electrolyte within the same current density range. However, if we compare the rate capability of NCM(MDE)-800 in the three electrolytes with current density between 5 and 20 A g−1, this material achieved the highest capacitance retention of ∼91% in 1 M H2SO4(aq), compared to 78% in 0.5 M Na2SO4(aq) and 68% in 6 M KOH(aq).
Fig. 9(d) displays the cyclic stability test for NCM(MDE)-800 up to 1000 GCD cycles in all three electrolytes, viz. 1 M H2SO4(aq), 6 M KOH(aq) and 0.5 M Na2SO4(aq) at a current density of 5 A g−1. The results reveal that the NCM(MDE)-800 has excellent capacitive retention (98%) in 0.5 M Na2SO4, up to 1000 cycles. In contrast, a notable decay in Cs with almost 96% capacitance retention was observed after 200 cycles for the GCD measurements carried out in 6 M KOH. Interestingly, Fig. 9(d) shows a gradual improvement in the specific capacitance (194 to 220 F g−1) for NCM(MDE)-800 in 1 M H2SO4(aq), which is nearly 114% of the value of the capacitance of this material after 1000 cycles. These long cycle stability tests indicate that the ionic strengths, electrolyte pH and the nature of ions involved in the charge storage mechanism, all contribute to the superior capacitive retention displayed by NCM(MDE)-800.
The H+ ion has the smallest hydrated ionic radius (1.0 Å) and highest ionic mobility in water (μ = 36.23 × 10⁻⁸ m2 s−1 V−1 at 298 K) compared to K+ (ionic radius (3.31 Å) and ionic mobility (μ = 7.62 × 10⁻⁸ m2 s−1 V−1 at 298 K)) and Na+ (ionic radius (3.58 Å) and ionic mobility (μ = 5.19 × 10⁻⁸ m2 s−1 V−1 at 298 K)).77,78 Due to the small ionic size and ultra-fast mobility, the H+ can penetrate deep into the pores of NCM(MDE)-800, thereby, contributing to the high rate capability of this material at all scan rates. In summary, the H2SO4(aq) electrolyte is a suitable choice for NCM type supercapacitor materials, due to the presence of active protons with small ionic radius and ultra-fast mobility, in addition to the capability to develop ionic interactions with the carbon atoms with Lewis basicity adjacent to the nitrogen and the nitrogen itself.
Conclusions
The present work has shown that without the requirement of an expensive template, murexide is a good precursor for the preparation of hierarchical porous nitrogen-doped carbon materials (NCMs), which can be used as active electrode materials for supercapacitor application. The NCM(MDE)-800 shows superior capacitive performance (Cs ∼ 222 F g−1 at the current density of 3 A g−1), excellent cyclic stability (10![[thin space (1/6-em)]](https://www.rsc.org/images/entities/char_2009.gif) 000 cycles at the current density of 10 A g−1) and good capacitance retention (91%) at current density as high as 20 A g−1. The comparison of capacitive performance for the three materials indicates that the high proportion of pyridinic-N and quaternary-N functionalities accompanied by reasonable surface area and hierarchical porosity are the major factors for achieving high specific capacitance by NCM(MDE)-800. The detailed investigation of this material in three different electrolytes (acidic, basic and neutral) with current density from 5 to 20 A g−1 reveal that the capacitance retention in 1 M H2SO4(aq) (91%) is significantly higher than the capacitive retention in 0.5 M Na2SO4(aq) (78%) and 6 M KOH(aq) (68%). The electrochemical analysis reveals that the 1 M H2SO4(aq) is the most suitable electrolyte for a supercapacitor based on N-doped carbon materials, due to the active proton with small ionic radius, ultra-fast mobility and the capability to develop ionic interactions with carbon atoms next to the nitrogen (with Lewis basicity) and the nitrogen itself.
000 cycles at the current density of 10 A g−1) and good capacitance retention (91%) at current density as high as 20 A g−1. The comparison of capacitive performance for the three materials indicates that the high proportion of pyridinic-N and quaternary-N functionalities accompanied by reasonable surface area and hierarchical porosity are the major factors for achieving high specific capacitance by NCM(MDE)-800. The detailed investigation of this material in three different electrolytes (acidic, basic and neutral) with current density from 5 to 20 A g−1 reveal that the capacitance retention in 1 M H2SO4(aq) (91%) is significantly higher than the capacitive retention in 0.5 M Na2SO4(aq) (78%) and 6 M KOH(aq) (68%). The electrochemical analysis reveals that the 1 M H2SO4(aq) is the most suitable electrolyte for a supercapacitor based on N-doped carbon materials, due to the active proton with small ionic radius, ultra-fast mobility and the capability to develop ionic interactions with carbon atoms next to the nitrogen (with Lewis basicity) and the nitrogen itself.
Conflicts of interest
There are no conflicts to declare.Acknowledgements
The authors acknowledge the Stephenson Institute for Renewable Energy, University of Liverpool, United Kingdom for offering their research facilities and Higher Education Commission of Pakistan for indigenous and overseas financial assistance Grants No. (112-37208-2PS1-414) and (IRSIP 30-PS-23). The authors would also like to extend their sincere appreciation to the Deanship of Scientific Research at the King Saud University for its funding of this research through the Research Group, Project No. RGP-255. We acknowledge the support from Science without Borders Program, Ministério da Educação, Coordenação de Aperfeiçoamento de Pessoal de Nível Superior (CAPES); and the Engineering and Physical Sciences Research Council (EPRSC) under grant EP/N032888/1. We thank Dr R. Clowes for providing BET analyses, and the Nanoinvestigation center at Liverpool (NiCaL) for access to the TEM and SEM and scientific discussions with Dr V. Dhanak.References
- M. Demir, S. K. Saraswat and R. B. Gupta, RSC Adv., 2017, 7, 42430–42442 RSC.
- W.-J. Lu, S.-Z. Huang, L. Miao, M.-X. Liu, D.-Z. Zhu, L.-C. Li, H. Duan, Z.-J. Xu and L.-H. Gan, Chin. Chem. Lett., 2017, 28, 1324–1329 CrossRef CAS.
- R. M. Dell and D. A. J. Rand, J. Power Sources, 2001, 100, 2–17 CrossRef CAS.
- L.-F. Chen, X.-D. Zhang, H.-W. Liang, M. Kong, Q.-F. Guan, P. Chen, Z.-Y. Wu and S.-H. Yu, ACS Nano, 2012, 6, 7092–7102 CrossRef CAS PubMed.
- B. Xu, H. Duan, M. Chu, G. Cao and Y. Yang, J. Mater. Chem. A, 2013, 1, 4565–4570 CAS.
- A. S. Arico, P. Bruce, B. Scrosati, J. M. Tarascon and W. van Schalkwijk, Nat. Mater., 2005, 4, 366–377 CrossRef CAS PubMed.
- Y. Zhai, Y. Dou, D. Zhao, P. F. Fulvio, R. T. Mayes and S. Dai, Adv. Mater., 2011, 23, 4828–4850 CrossRef CAS PubMed.
- L. Dai, D. W. Chang, J.-B. Baek and W. Lu, Small, 2012, 8, 1130–1166 CrossRef CAS PubMed.
- D. Pech, M. Brunet, H. Durou, P. Huang, V. Mochalin, Y. Gogotsi, P.-L. Taberna and P. Simon, Nat. Nanotechnol., 2010, 5, 651–654 CrossRef CAS PubMed.
- K. Jurewicz, K. Babeł, A. Źiółkowski and H. Wachowska, Electrochim. Acta, 2003, 48, 1491–1498 CrossRef CAS.
- E. Raymundo-Piñero, M. Cadek and F. Béguin, Adv. Funct. Mater., 2009, 19, 1032–1039 CrossRef.
- D. Hulicova-Jurcakova, A. M. Puziy, O. I. Poddubnaya, F. Suárez-García, J. M. D. Tascón and G. Q. Lu, J. Am. Chem. Soc., 2009, 131, 5026–5027 CrossRef CAS PubMed.
- L. Zhao, L. Z. Fan, M. Q. Zhou, H. Guan, S. Qiao, M. Antonietti and M. M. Titirici, Adv. Mater., 2010, 22, 5202–5206 CrossRef CAS PubMed.
- Y.-H. Lee, Y.-F. Lee, K.-H. Chang and C.-C. Hu, Electrochem. Commun., 2011, 13, 50–53 CrossRef CAS.
- H. Guo and Q. Gao, J. Power Sources, 2009, 186, 551–556 CrossRef CAS.
- Y. Zhao, M. Liu, X. Deng, L. Miao, P. K. Tripathi, X. Ma, D. Zhu, Z. Xu, Z. Hao and L. Gan, Electrochim. Acta, 2015, 153, 448–455 CrossRef CAS.
- G. Wang, J. Zhang, S. Kuang, J. Zhou, W. Xing and S. Zhuo, Electrochim. Acta, 2015, 153, 273–279 CrossRef CAS.
- D. Guo, R. Shibuya, C. Akiba, S. Saji, T. Kondo and J. Nakamura, Science, 2016, 351, 361 CrossRef CAS PubMed.
- T. Panja, D. Bhattacharjya and J.-S. Yu, J. Mater. Chem. A, 2015, 3, 18001–18009 CAS.
- D. Zhang, L. Zheng, Y. Ma, L. Lei, Q. Li, Y. Li, H. Luo, H. Feng and Y. Hao, ACS Appl. Mater. Interfaces, 2014, 6, 2657–2665 CAS.
- H. Chen, F. Sun, J. Wang, W. Li, W. Qiao, L. Ling and D. Long, J. Phys. Chem. C, 2013, 117, 8318–8328 CAS.
- H. Feng, M. Zheng, H. Dong, Y. Xiao, H. Hu, Z. Sun, C. Long, Y. Cai, X. Zhao and H. Zhang, J. Mater. Chem. A, 2015, 3, 15225–15234 CAS.
- B. Fang, J. H. Kim, M.-S. Kim, A. Bonakdarpour, A. Lam, D. P. Wilkinson and J.-S. Yu, J. Mater. Chem., 2012, 22, 19031–19038 RSC.
- J.-S. M. Lee, T.-H. Wu, B. M. Alston, M. E. Briggs, T. Hasell, C.-C. Hu and A. I. Cooper, J. Mater. Chem. A, 2016, 4, 7665–7673 CAS.
- S. Yang, R. E. Bachman, X. Feng and K. Müllen, Acc. Chem. Res., 2013, 46, 116–128 CrossRef CAS PubMed.
- J. Masa, W. Xia, M. Muhler and W. Schuhmann, Angew. Chem., Int. Ed., 2015, 54, 10102–10120 CrossRef CAS PubMed.
- S. Zhang, K. Dokko and M. Watanabe, Chem. Mater., 2014, 26, 2915–2926 CrossRef CAS.
- A. Pertegás, D. Tordera, J. J. Serrano-Pérez, E. Ortí and H. J. Bolink, J. Am. Chem. Soc., 2013, 135, 18008–18011 CrossRef PubMed.
- A. Bello, N. Manyala, F. Barzegar, A. A. Khaleed, D. Y. Momodu and J. K. Dangbegnon, RSC Adv., 2016, 6, 1800–1809 RSC.
- Y. Sha, J. Lou, S. Bai, D. Wu, B. Liu and Y. Ling, Mater. Res. Bull., 2015, 64, 327–332 CrossRef CAS.
- M. Sevilla, L. Yu, L. Zhao, C. O. Ania and M.-M. Titiricic, ACS Sustainable Chem. Eng., 2014, 2, 1049–1055 CrossRef CAS.
- Y. Ren, J. Zhang, Q. Xu, Z. Chen, D. Yang, B. Wang and Z. Jiang, RSC Adv., 2014, 4, 23412–23419 RSC.
- N. Liu, L. Yin, C. Wang, L. Zhang, N. Lun, D. Xiang, Y. Qi and R. Gao, Carbon, 2010, 48, 3579–3591 CrossRef CAS.
- M. Kruk, M. Jaroniec, R. Ryoo and S. H. Joo, J. Phys. Chem. B, 2000, 104, 7960–7968 CrossRef CAS.
- Y. Xia, Z. Yang and R. Mokaya, J. Phys. Chem. B, 2004, 108, 19293–19298 CrossRef CAS.
- Z. Ma, H. Zhang, Z. Yang, Y. Zhang, B. Yu and Z. Liu, J. Mater. Chem. A, 2014, 2, 19324–19329 CAS.
- L. Miao, D. Zhu, Y. Zhao, M. Liu, H. Duan, W. Xiong, Q. Zhu, L. Li, Y. Lv and L. Gan, Microporous Mesoporous Mater., 2017, 253, 1–9 CrossRef CAS.
- M. M. Abdel-Kader, K. K. Tahoon and A. El-Sharkawy, Phys. Status Solidi A, 1993, 135, 161–168 CrossRef CAS.
- M. Liu, L. Gan, W. Xiong, F. Zhao, X. Fan, D. Zhu, Z. Xu, Z. Hao and L. Chen, Energy Fuels, 2013, 27, 1168–1173 CrossRef CAS.
- S. K. Ramasahayam, U. B. Nasini, A. U. Shaikh and T. Viswanathan, J. Power Sources, 2015, 275, 835–844 CrossRef CAS.
- M. Liu, L. Gan, W. Xiong, Z. Xu, D. Zhu and L. Chen, J. Mater. Chem. A, 2014, 2, 2555–2562 CAS.
- M. Liu, X. Ma, L. Gan, Z. Xu, D. Zhu and L. Chen, J. Mater. Chem. A, 2014, 2, 17107–17114 CAS.
- Z. Li, C. Lu, Z. Xia, Y. Zhou and Z. Luo, Carbon, 2007, 45, 1686–1695 CrossRef CAS.
- Z. Zhao, Y. Wang, M. Li and R. Yang, RSC Adv., 2015, 5, 34803–34811 RSC.
- K. Parvez, Chemical Exfoliation of Graphene and Its Application in Organic Electronics and Energy Storage Devices, 2014 Search PubMed.
- J. Hou, C. Cao, F. Idrees and X. Ma, ACS Nano, 2015, 9, 2556–2564 CrossRef CAS PubMed.
- T. Wang, L.-X. Wang, D.-L. Wu, W. Xia and D.-Z. Jia, Sci. Rep., 2015, 5, 9591 CrossRef CAS PubMed.
- F. Su, C. K. Poh, J. S. Chen, G. Xu, D. Wang, Q. Li, J. Lin and X. W. Lou, Energy Environ. Sci., 2011, 4, 717–724 CAS.
- D. Hulicova-Jurcakova, M. Seredych, G. Q. Lu and T. J. Bandosz, Adv. Funct. Mater., 2009, 19, 438–447 CrossRef CAS.
- D. Hulicova-Jurcakova, M. Kodama, S. Shiraishi, H. Hatori, Z. H. Zhu and G. Q. Lu, Adv. Funct. Mater., 2009, 19, 1800–1809 CrossRef CAS.
- J. Han, G. Xu, H. Dou and D. R. MacFarlane, Chem.–Eur. J., 2015, 21, 2310–2314 CrossRef CAS PubMed.
- J. Xu, F. He, S. Gai, S. Zhang, L. Li and P. Yang, Nanoscale, 2014, 6, 10887–10895 RSC.
- M. Seredych, D. Hulicova-Jurcakova, G. Q. Lu and T. J. Bandosz, Carbon, 2008, 46, 1475–1488 CrossRef CAS.
- Y. Fang, Y. Lv, R. Che, H. Wu, X. Zhang, D. Gu, G. Zheng and D. Zhao, J. Am. Chem. Soc., 2013, 135, 1524–1530 CrossRef CAS PubMed.
- J. Li, R. Yao, J. Bai and C. Cao, ChemPlusChem, 2013, 78, 797–800 CrossRef CAS.
- Y. S. Yun, S. Y. Cho, J. Shim, B. H. Kim, S. J. Chang, S. J. Baek, Y. S. Huh, Y. Tak, Y. W. Park, S. Park and H. J. Jin, Adv. Mater., 2013, 25, 1993–1998 CrossRef CAS PubMed.
- C. Hu, L. Wang, Y. Zhao, M. Ye, Q. Chen, Z. Feng and L. Qu, Nanoscale, 2014, 6, 8002–8009 RSC.
- Z. Li, Z. Xu, X. Tan, H. Wang, C. M. Holt, T. Stephenson, B. C. Olsen and D. Mitlin, Energy Environ. Sci., 2013, 6, 871–878 CAS.
- L. Qie, W. Chen, H. Xu, X. Xiong, Y. Jiang, F. Zou, X. Hu, Y. Xin, Z. Zhang and Y. Huang, Energy Environ. Sci., 2013, 6, 2497–2504 Search PubMed.
- K. S. W. Sing, D. H. Everett, R. A. W. Haul, L. Moscou, R. A. Pierotti, J. Rouquerol and T. Siemieniewska, in Handbook of Heterogeneous Catalysis, Wiley-VCH Verlag GmbH & Co. KGaA, 2008, DOI:10.1002/9783527610044.hetcat0065.
- S. K. Ramasahayam, Z. Hicks and T. Viswanathan, ACS Sustainable Chem. Eng., 2015, 3, 2194–2202 CrossRef CAS.
- Y. Lv, L. Gan, M. Liu, W. Xiong, Z. Xu, D. Zhu and D. S. Wright, J. Power Sources, 2012, 209, 152–157 CrossRef CAS.
- W. Xiong, M. Liu, L. Gan, Y. Lv, Y. Li, L. Yang, Z. Xu, Z. Hao, H. Liu and L. Chen, J. Power Sources, 2011, 196, 10461–10464 CrossRef CAS.
- X. Ma, M. Liu, L. Gan, Y. Zhao and L. Chen, J. Solid State Electrochem., 2013, 17, 2293–2301 CrossRef CAS.
- L. Yang, S. Cheng, Y. Ding, X. Zhu, Z. L. Wang and M. Liu, Nano Lett., 2012, 12, 321–325 CrossRef CAS PubMed.
- C. Portet, M. A. Lillo-Rodenas, A. Linares-Solano and Y. Gogotsi, Phys. Chem. Chem. Phys., 2009, 11, 4943–4945 RSC.
- L. L. Zhang, X. Zhao, M. D. Stoller, Y. Zhu, H. Ji, S. Murali, Y. Wu, S. Perales, B. Clevenger and R. S. Ruoff, Nano Lett., 2012, 12, 1806–1812 CrossRef CAS PubMed.
- T. Zhu, J. S. Chen and X. W. Lou, J. Mater. Chem., 2010, 20, 7015–7020 RSC.
- X. Lu, G. Wang, T. Zhai, M. Yu, J. Gan, Y. Tong and Y. Li, Nano Lett., 2012, 12, 1690–1696 CrossRef CAS PubMed.
- L.-N. Han, X. Wei, Q.-C. Zhu, S.-M. Xu, K.-X. Wang and J.-S. Chen, J. Mater. Chem. A, 2016, 4, 16698–16705 CAS.
- N. Subramanian and B. Viswanathan, RSC Adv., 2015, 5, 63000–63011 RSC.
- S. Gao, Y. Chen, H. Fan, X. Wei, C. Hu, H. Luo and L. Qu, J. Mater. Chem. A, 2014, 2, 3317–3324 CAS.
- Z. Guo, Q. Zhou, Z. Wu, Z. Zhang, W. Zhang, Y. Zhang, L. Li, Z. Cao, H. Wang and Y. Gao, Electrochim. Acta, 2013, 113, 620–627 CrossRef CAS.
- Z. Li, L. Zhang, B. S. Amirkhiz, X. Tan, Z. Xu, H. Wang, B. C. Olsen, C. M. B. Holt and D. Mitlin, Adv. Energy Mater., 2012, 2, 431–437 CrossRef CAS.
- P. Liu, M. Verbrugge and S. Soukiazian, J. Power Sources, 2006, 156, 712–718 CrossRef CAS.
- H. Liu and G. Zhu, J. Power Sources, 2007, 171, 1054–1061 CrossRef CAS.
- Q. T. Qu, B. Wang, L. C. Yang, Y. Shi, S. Tian and Y. P. Wu, Electrochem. Commun., 2008, 10, 1652–1655 CrossRef CAS.
- R. N. Reddy and R. G. Reddy, J. Power Sources, 2003, 124, 330–337 CrossRef CAS.
Footnote |
| † Electronic supplementary information (ESI) available. See DOI: 10.1039/c7ra10954g |
| This journal is © The Royal Society of Chemistry 2017 |

