
 Open Access Article
 This Open Access Article is licensed under a Creative Commons Attribution-Non Commercial 3.0 Unported Licence
Ferromagnetic photocatalysts of FeTiO3–Fe2O3 nanocomposites†
Baizhi Gao a,
Caiping Yanga,
Jun Chena,
Yuxing Maa,
Jiachen Xiea,
Hao Zhanga,
Lujun Weib,
Qi Li*a,
Jun Du*bc and
Qingyu Xu*ac
a,
Caiping Yanga,
Jun Chena,
Yuxing Maa,
Jiachen Xiea,
Hao Zhanga,
Lujun Weib,
Qi Li*a,
Jun Du*bc and
Qingyu Xu*ac
aSchool of Physics, Southeast University, Nanjing 211189, China. E-mail: qli@seu.edu.cn; xuqingyu@seu.edu.cn
bSchool of Physics, Nanjing University, Nanjing 210093, China. E-mail: jdu@nju.edu.cn
cNational Laboratory of Solid State Microstructures, Nanjing University, Nanjing 210093, China
First published on 28th November 2017
Abstract
Besides harvesting sunlight over a broad wavelength range as much as possible, the efficient separation of photo-generated electron–hole pairs is vital for the development of high-quality photocatalysts. In this work, we design FeTiO3 (FTO) and Fe2O3 (FO) nanocomposites (xFTO–(1 − x)FO), which are simply prepared using a hydrothermal method. The FTO is epitaxially grown on FO nanoparticles, and with the increasing concentration of FTO, the band gaps decrease from 2.43 eV (x = 1.00) to 1.56 eV (x = 0.60). The photocatalytic capability is significantly improved such that xFTO–(1 − x)FO (x = 0.60) shows the highest value, which is about 8 times that of FO and 4 times that of FTO. Furthermore, strong ferromagnetism with saturated magnetization larger than 6 emu g−1 is observed in xFTO–(1 − x)FO with x ≥ 0.60. xFTO–(1 − x)FO (x = 0.60) is further annealed at various temperatures. After annealing at 300 °C, the photocatalytic capability and ferromagnetism are both improved, by 38% and 31%, respectively, but drastically decrease with further increase of the annealing temperature to higher than 400 °C. The mechanism of the enhanced photocatalytic capability has been ascribed to the interdiffusion between FTO and FO at interfaces inside the nanocomposite particles, resulting in the formation of p–n junctions, which may facilitate the separation of photo-generated electron–hole pairs by the built-in-electric field. A significant enhancement of ferromagnetism occurs at the interdiffusion region with higher concentrations of FTO.
Introduction
Photocatalysis is an environment-friendly energy transforming process from solar energy to chemical energy, which has attracted extensive research interest since the discovery of the first photocatalyst (TiO2) used for water splitting in 1972.1 However, the band gap of TiO2 is 3.2 eV for the anatase phase and 3.0 eV for the rutile phase, which makes TiO2 nearly inactive under visible light irradiation.2–4 Many strategies were put forward for controlling the band gaps for better utilization of solar energy,5 and improving carrier separation and transportation efficiency for enhancing chemical reactivity.6,7 The formation of heterointerfaces including p–n junctions8–12 and Schottky contacts4 has been proved to be very effective for carrier separation.13 For p–n junctions, the generation of a built-in electric field at the interfaces by equaling the Fermi level leads to the transportation of electrons and holes in opposite directions and the recombination is therefore significantly suppressed.14,15Based on the above-mentioned factors for high-performance photocatalyst, we develop a novel nanocomposite photocatalyst with FeTiO3 (FTO) and α-Fe2O3 (FO), which has been proved to be a successful technique to develop efficient photocatalyst. The band gaps of FTO and FO are ∼2.5 eV (ref. 16) and ∼2.2 eV,17,18 respectively. And FTO might have large adsorption and photocatalytic capability due to its easier formation of vacancy defects on the surface, which would both enhance the porous surface structure formation and O2 diffusivity.19 Although the above factors make them suitable to work under visible illuminations, their high carriers' recombination rate makes them not so efficient in practice.17,18 This might be changed based on built-in-electric field in p–n junctions. It has been reported that opposite electrical properties can be achieved by changing the relative concentration in FTOx–FO(1−x) (in molar ratio) solid solutions, with p-type for x > 0.73 and n-type for x < 0.73.20 Thus, p–n junction might be formed at the interface of FTO and FO composites by proper interdiffusion. Furthermore, FTO and FO can form solid solution in full concentration range,21,22 and strong ferromagnetism has been observed when FTO concentration is higher than 0.5, though pure FTO is antiferromagnetic.23 Thus, this may further make xFTO–(1 − x)FO nanocomposites to be potential ferromagnetic photocatalysts, which can be magnetically separable for the efficient separation and recovery from treated water.24–27
In this paper, we simply prepared xFTO–(1 − x)FO nanocomposites by hydrothermal method. By carefully tuning the concentration of FTO, significantly enhanced photocatalytic capability with strong ferromagnetism has been observed, which has been confirmed to be due to the interdiffusion of FTO and FO at the interfaces inside the particles.
Experimental
xFTO–(1 − x)FO nanocomposites (x = 0.00, 0.20, 0.40, 0.60, 0.80 and 1.00 in molar ratio) were prepared by hydrothermal method.21 Tetrabutylammonium hydroxide (TBAH, 40% aqueous solution), titanium isopropoxide (TTIP, 95% aqueous solution) and FeSO4·7H2O (99.9%) were used as the starting materials for the preparation of FTO, and KOH (99.9%) was used for the pH control. 0.005 mol TBAH (3.25 ml) was taken and diluted in 40 ml deionized water, and then 0.005 mol TTIP (1.5312 ml) was added rapidly. The mixture was stirred by a magnetic stirrer and kept at the temperature of 50 °C, until it was completely clear. 0.005 mol FeSO4·7H2O powder (1.39 g) was dissolved in 10 ml deionized water and immediately poured into the mixture which was kept on stirring. Then 0.05 mol KOH (2.805 g) was added into the mixture directly to adjust the pH value to 14. After that, the FO powders were added, and the amount was adjusted according to the designed composition. The stirring process was continued for another 20 min. The mixture was then moved to an autoclave. The autoclave was gradually heated to 220 °C in a speed of around 3–5 °C min−1 and kept at 220 °C for 10 h, then slowly cooled down to room temperature. The precipitates were collected by centrifugation, washed by deionized water and ethanol. The washed products were finally dried at 70 °C for 3 h. Annealing process was performed at various temperatures for 3 hours. It must be noted that air should be isolated by the protection of Ar atmosphere in the whole preparation process.The crystal structure was studied by θ–2θ powder X-ray diffraction (XRD, Rigaku Smartlab3) using Cu Kα radiation (1.5406 Å). The morphologies were studied by a scanning electron microscope (SEM, FEI Inspect F50), equipped with an energy dispersive X-ray spectroscope (EDX). Raman spectra were carried out on a Horiba Jobin Yvon LabRAM HR 800 micro-Raman spectrometer using a 532 nm laser. Band gaps were determined from the UV-vis diffuse reflectance spectrometer (DRS, Hitach U-3900). X-ray photoelectron spectroscopy (XPS) was carried out using an X-ray photoelectron spectrometer (ThermoFisher Scientific) with Al Kα X-ray source (hν = 1486.6 eV). The samples for XPS measurements were kept in the high-vacuum chamber overnight to remove the adsorbed air. Brunauer–Emmett–Teller (BET) specific surface areas were determined from N2 adsorption by using an ASAP 2020 (Micrometrics USA) analyzer. The magnetic properties were measured by a vibrating sample magnetometer (VSM, Microsense EV7) with maximum applied field of 10 kOe. All the measurements were performed at room temperature.
The photocatalytic activities of the samples were tested by the photocatalytic decomposition of model contaminates, Rhodamine B (RhB), at room temperature with visible light irradiation. Typically, 50 mg of photocatalyst was dispersed in 150 ml of 2 mg l−1 RhB aqueous solution. A 500 W Xe lamp (Beijing Trusttech Co Ltd, CHF-XM) equipped with a visible pass filter (λ = 400–800 nm). The concentrations of RhB were monitored at 554 nm by using a UV-vis DRS (Hitach U-3900). A 30 min adsorption in darkness was applied as the pretreatment for absorption–desorption equilibrium before photocatalytic process.
Results and discussion
Fig. 1 shows the XRD patterns of xFTO–(1 − x)FO nanocomposites. FTO and FO are both in corundum structure (space group R![[3 with combining macron]](https://www.rsc.org/images/entities/char_0033_0304.gif) for FTO and Rc for FO),28 similar XRD patterns of pure phases can be observed for all the samples as shown in Fig. 1(a). A magnified view of (110) peaks is illustrated in the inset of Fig. 1(b). FTO has larger lattice constants than FO, thus the diffraction peaks gradually shift to smaller angles, as shown in Fig. 1(b), indicating the lattice expansion with increasing concentration of FTO calculated using Bragg's law. Interestingly, a sudden shift of the diffraction peak can be observed between FTO and xFTO–(1 − x)FO (x = 0.80), while the shift of the other peaks is much smaller in a nearly linear way. The sudden shift of the diffraction peaks from pure FTO to xFTO–(1 − x)FO (x = 0.80) might be due to the epitaxial growth of FTO on FO particle surface, since FTO and FO have the similar crystalline structure. This can be evidenced by the observation of the superimposed peaks of (110) in xFTO–(1 − x)FO (x = 0.80) from FO and FTO. In xFTO–(1 − x)FO nanocomposites, FTO is grown on the surfaces of FO particles and the lattice of FTO is constrained by that of FO. With increasing x, the thickness of FTO layer increases, thus the lattice gradually relaxes, leading to the shift of diffraction peaks to smaller angle. For xFTO–(1 − x)FO (x = 0.80), some FTO layers on FO particles are thick enough, and the lattice eventually relax to that of FTO. The crystallite size of xFTO–(1 − x)FO calculated using Scherrer's equation is listed in Table S1 (ESI†), which is in the range between 40 nm and 60 nm. The images of xFTO–(1 − x)FO powders are shown in inset of Fig. 1(a). As can be seen, the pure FTO powders shows gray black color, and FO shows red brown color. A gradual transformation between these two colors with variation of the relative concentration of FTO and FO can be clearly observed. This clearly confirms the coverage of FTO on FO.
for FTO and Rc for FO),28 similar XRD patterns of pure phases can be observed for all the samples as shown in Fig. 1(a). A magnified view of (110) peaks is illustrated in the inset of Fig. 1(b). FTO has larger lattice constants than FO, thus the diffraction peaks gradually shift to smaller angles, as shown in Fig. 1(b), indicating the lattice expansion with increasing concentration of FTO calculated using Bragg's law. Interestingly, a sudden shift of the diffraction peak can be observed between FTO and xFTO–(1 − x)FO (x = 0.80), while the shift of the other peaks is much smaller in a nearly linear way. The sudden shift of the diffraction peaks from pure FTO to xFTO–(1 − x)FO (x = 0.80) might be due to the epitaxial growth of FTO on FO particle surface, since FTO and FO have the similar crystalline structure. This can be evidenced by the observation of the superimposed peaks of (110) in xFTO–(1 − x)FO (x = 0.80) from FO and FTO. In xFTO–(1 − x)FO nanocomposites, FTO is grown on the surfaces of FO particles and the lattice of FTO is constrained by that of FO. With increasing x, the thickness of FTO layer increases, thus the lattice gradually relaxes, leading to the shift of diffraction peaks to smaller angle. For xFTO–(1 − x)FO (x = 0.80), some FTO layers on FO particles are thick enough, and the lattice eventually relax to that of FTO. The crystallite size of xFTO–(1 − x)FO calculated using Scherrer's equation is listed in Table S1 (ESI†), which is in the range between 40 nm and 60 nm. The images of xFTO–(1 − x)FO powders are shown in inset of Fig. 1(a). As can be seen, the pure FTO powders shows gray black color, and FO shows red brown color. A gradual transformation between these two colors with variation of the relative concentration of FTO and FO can be clearly observed. This clearly confirms the coverage of FTO on FO.
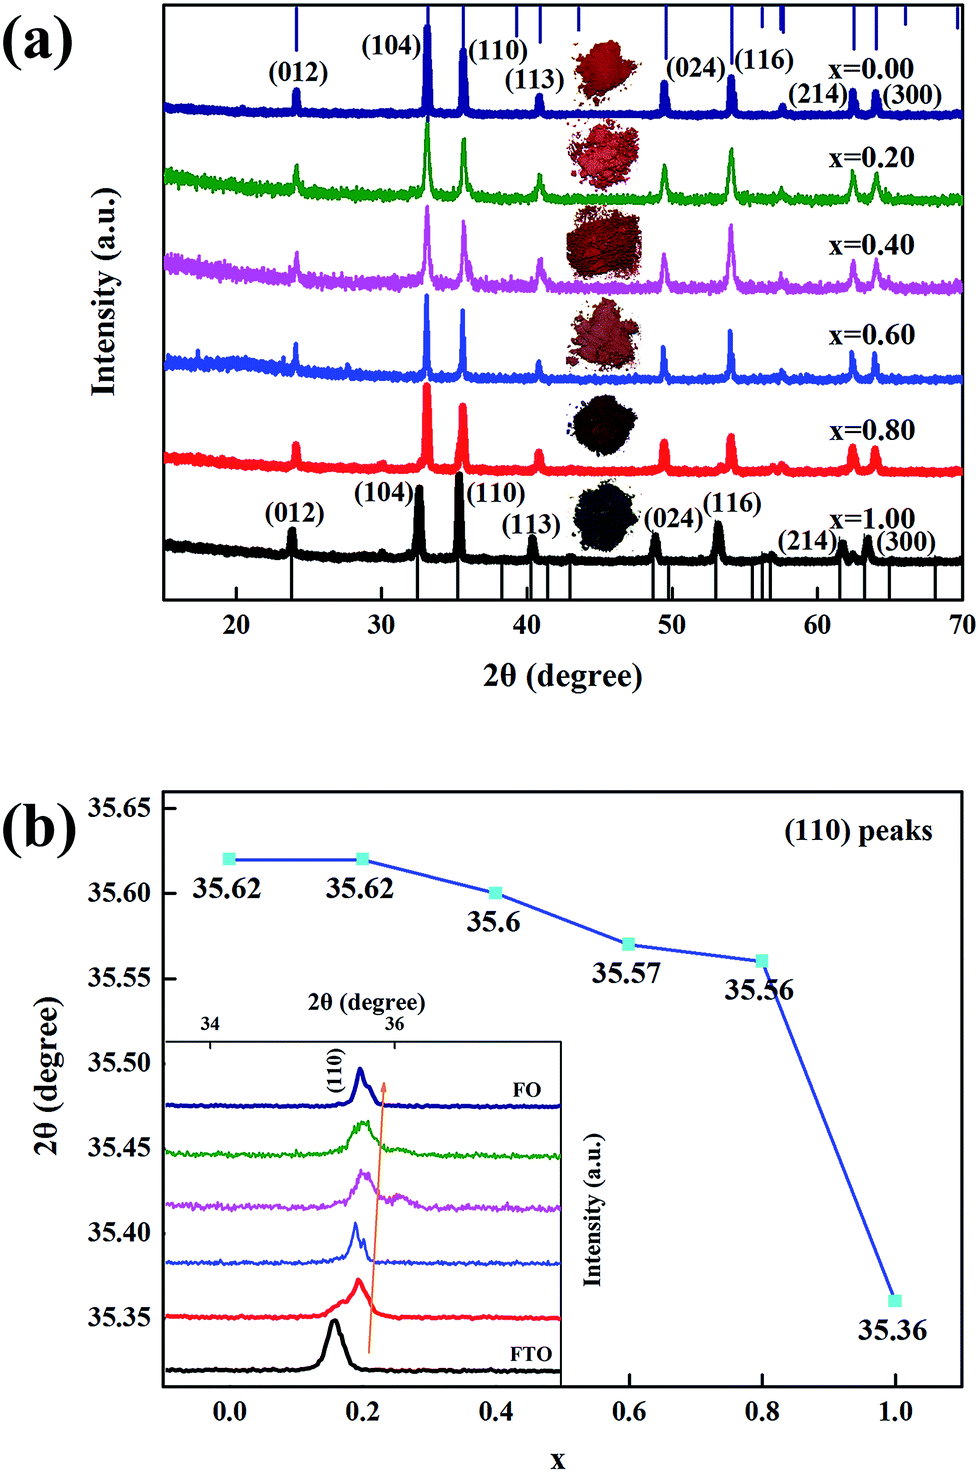 | ||
| Fig. 1 (a) XRD patterns of xFTO–(1 − x)FO nanocomposites, the standard XRD patterns of FTO and FO are shown on the bottom and top, respectively. (b) The positions of (110) peaks in dependence on x. The inset in (a) shows the images of the powders, and inset of (b) shows the magnified view of (110) peaks. | ||
Fig. 2 shows the morphologies of xFTO–(1 − x)FO nanocomposites observed by SEM. As can be seen, the morphology of pure FTO particles are mainly nanodiscs (Fig. 2(f)), which is due to the predominantly exposed {0001} polar facets.21,29 With only slight introduction of FO with concentration of 0.20, the morphology changes drastically to particle, which is quite similar with the morphology of FO particles. This can be understood by the mechanism of epitaxial growth of FTO on FO particles, which wraps the surfaces of FO particles. And a fully wrapped morphology can be clearly seen in xFTO–(1 − x)FO (x = 0.80) in Fig. 2(e), which is in agreement with its XRD pattern. The exact concentration of FTO and FO in the nanocomposites is further measured by EDX, and the results are listed in Table 1. It can be clearly seen that the atomic ratio between Fe and Ti is very close to 1 for pure FTO. However, slight deviation between the measured concentration and designed concentration of FTO in the nanocomposites can be observed, which might be due to the slight fluctuation in ratios of starting materials and incomplete fabrication of FTO during hydrothermal process. For simplicity, the designed concentration of FTO is used in the paper to denote each sample.
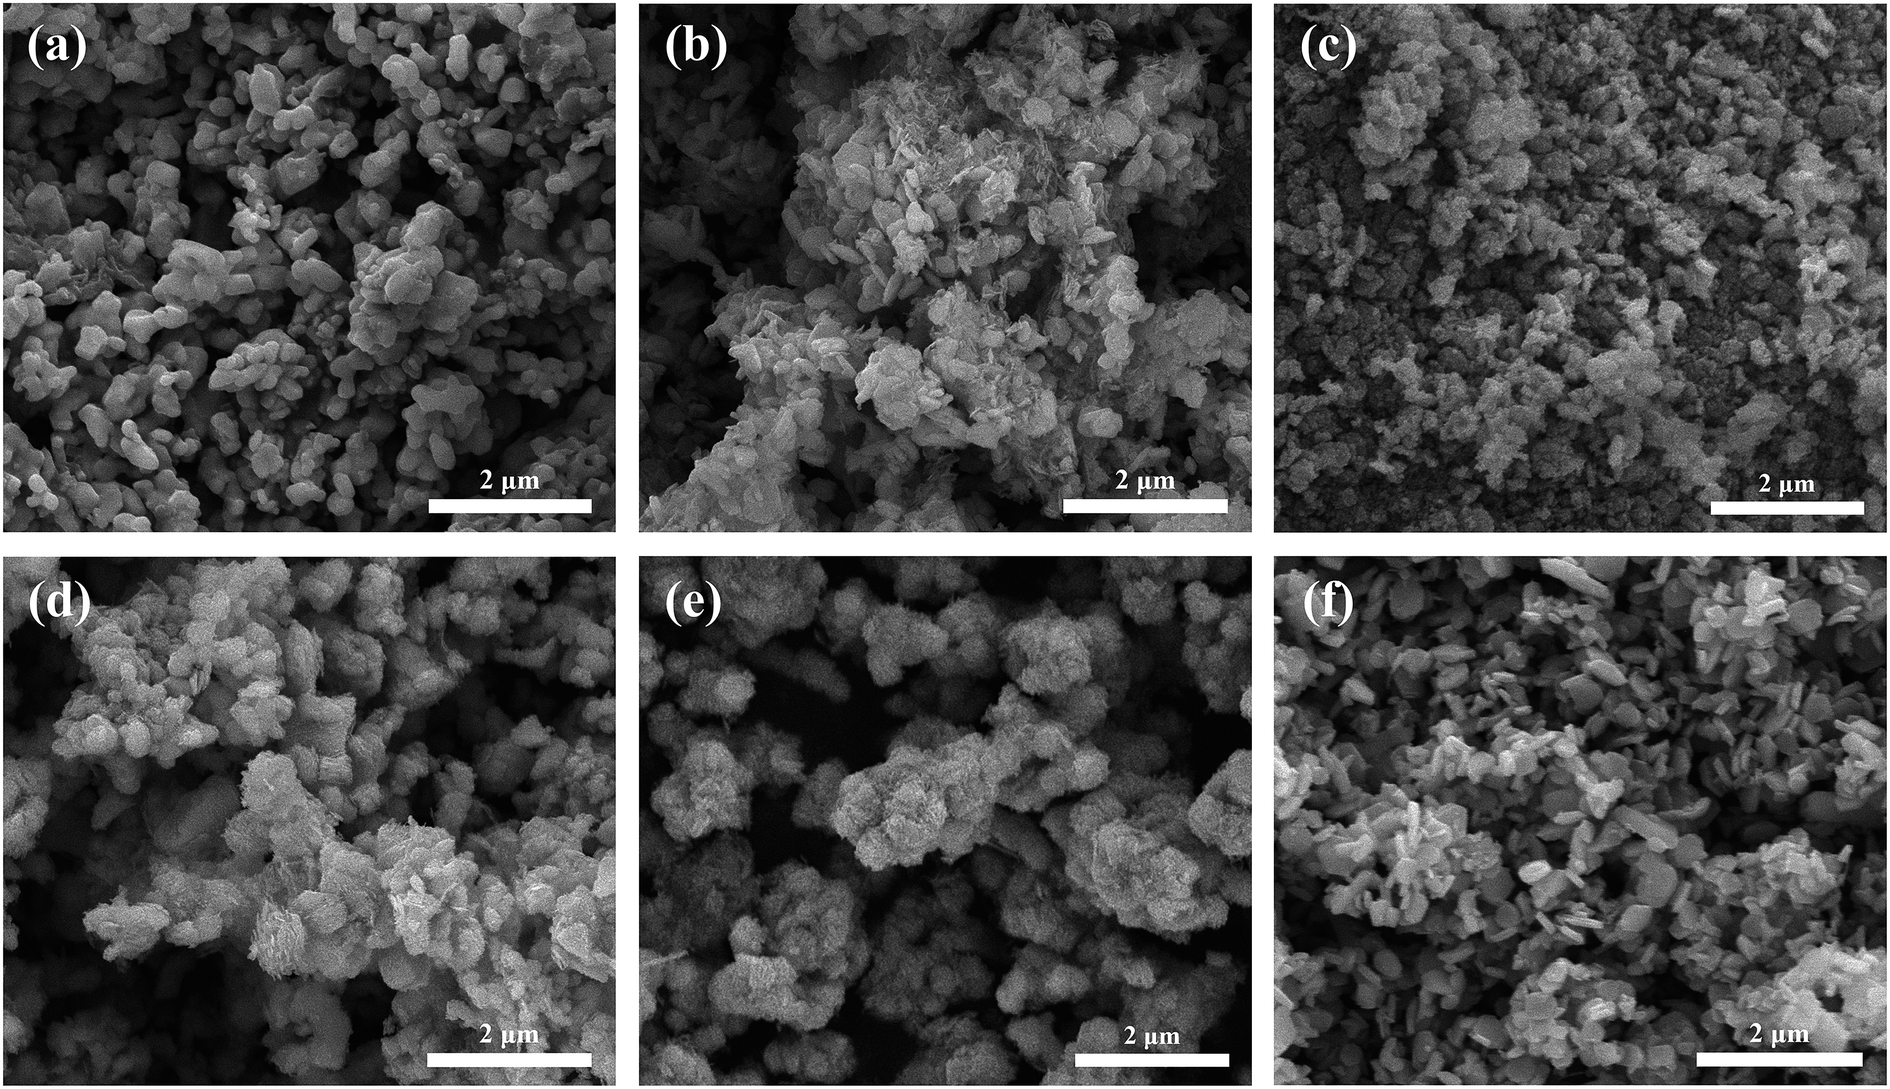 | ||
| Fig. 2 (a), (b), (c), (d), (e) and (f) are SEM images of xFTO–(1 − x)FO with x = 0.00, 0.20, 0.40, 0.60, 0.80, 1.00, respectively. | ||
| Samples (xFTO–(1 − x)FO) | x = 1.00 | x = 0.80 | x = 0.60 | x = 0.40 | x = 0.20 |
|---|---|---|---|---|---|
| Fe K (%) | 50.74 | 55.16 | 72.72 | 81.82 | 89.10 |
| Ti K (%) | 49.26 | 44.84 | 27.28 | 18.18 | 10.90 |
| Measured ratio (Fe/Ti) | 1.03 | 1.23 | 2.67 | 4.50 | 8.17 |
| Measured x | — | 0.90 | 0.55 | 0.36 | 0.22 |
The structures of xFTO–(1 − x)FO nanocomposites were further studied by Raman Spectra and UV-vis DRS, and the results are shown in Fig. 3. It has been reported that the Raman spectra of FO have two A1g modes (225 and 498 cm−1) and five Eg modes (247, 293, 299, 412, and 613 cm−1).30 The five Raman modes corresponding to FO can be clearly resolved, which locate at 216, 280, 400, 490, and 600 cm−1. With increasing x, the peak position shows little variation, indicating that the preparation process has little influence on the structure of FO particles. It can also be seen that no extra Raman modes can be observed with increasing x. This might be due to that the Raman signal from FTO is quite weak, leading to the coverage of small peaks by noises. Furthermore, most of the Raman modes of FTO are close to those of FO, and the peaks are quite broad, which makes them difficult to be separated.31 However, a peak locating at 673 cm−1 corresponding to the Ag Raman mode of FTO can be clearly resolved in the Raman spectrum of FTO.29 In contrast to the nearly unshifted Raman modes from FO, a clear shift to lower wavenumber (664 cm−1) can be observed in xFTO–(1 − x)FO (x = 0.80) for this mode of FTO. It has been reported that this mode of FTO corresponds to Ti–O stretching motion, which can qualitatively reflect the distortion of TiO6.31 This can be understood by the growth of FTO on FO particle surface, which induces lattice strain in FTO due to the epitaxial growth.
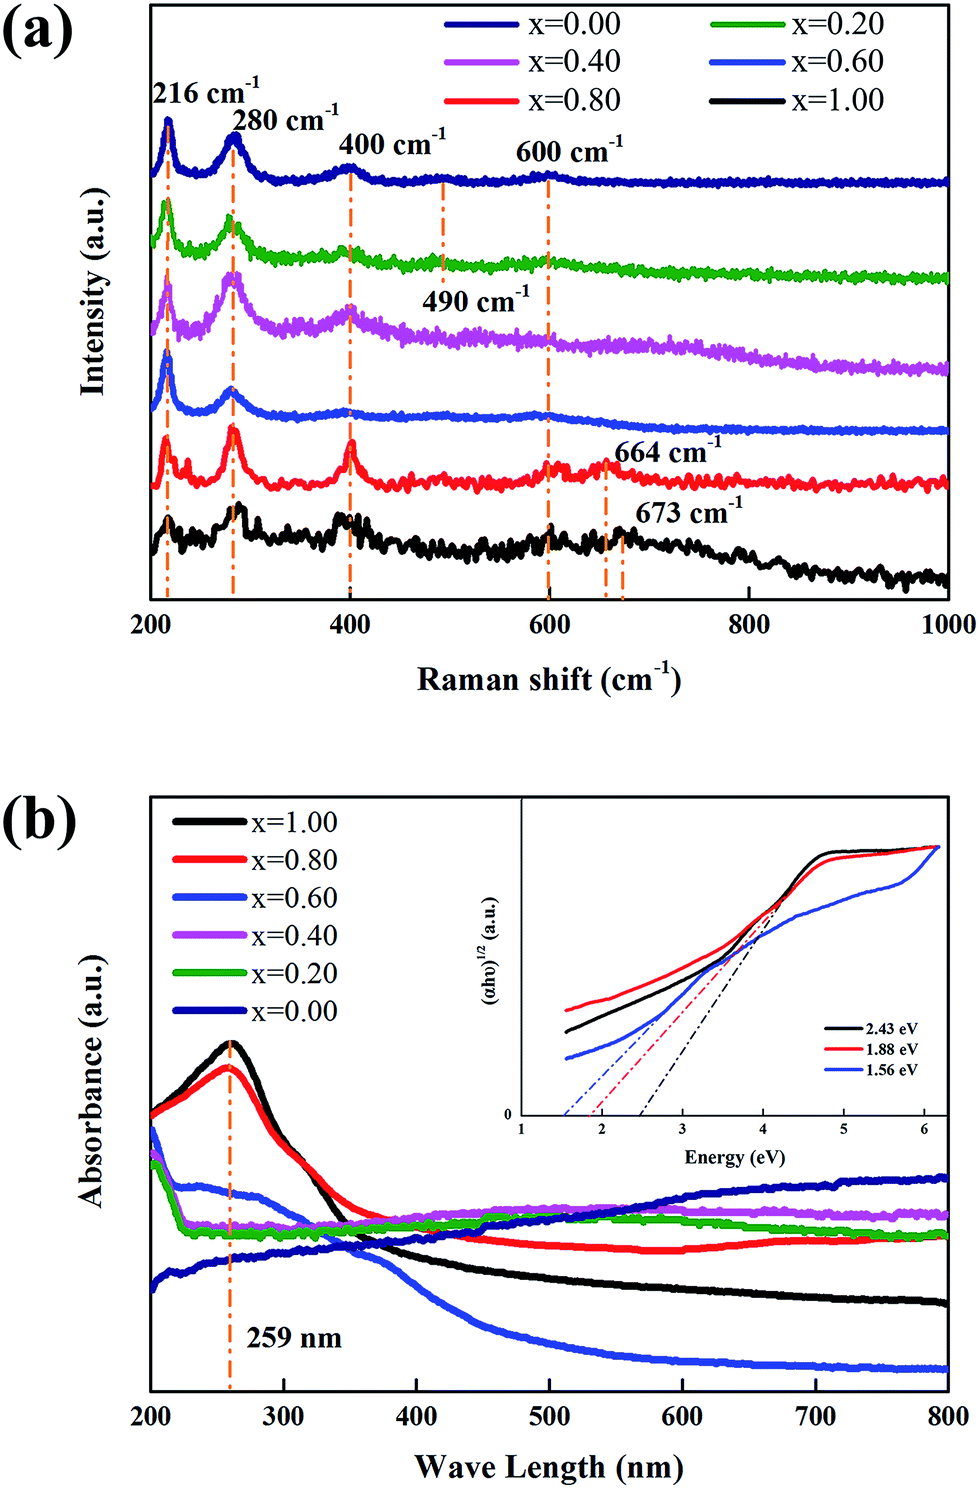 | ||
| Fig. 3 (a) Raman spectra, and (b) UV-vis DRS of xFTO–(1 − x)FO nanocomposites. The inset in (b) shows the curve fitting by Kubelka–Munk function. | ||
The band gaps were determined by UV-vis DRS patterns, as shown in Fig. 3(b). It can be clearly seen that nanocomposites of x ≤ 0.40 show nearly constant absorbance in the full visible light range, which means that the band gap cannot be determined in this method.17,22 Only for the nanocomposites of x ≥ 0.60, a clear absorption edge can be resolved. The optical absorption near the band edge of a semiconductor often obeys the Kubelka–Munk equation: (αhν)n = A(hν − Eg),33,34 where A is a constant, hν is the photon energy, Eg is the band gap of the semiconductor, α is the absorption coefficient, and n is 0.5 for indirect band gap materials, such as FTO.32 It has been reported that there are direct and indirect band gaps for FO.35 We fitted the absorbance curves of nanocomposites of x ≥ 0.60 using Kubelka–Munk equation with n = 0.5 and 2, and found the best fit can be obtained by using n = 0.5 (indirect band gap for FTO), as shown in the inset of Fig. 3(b). This is understandable that FTO takes the main absorption of light in the nanocomposites with high FTO concentration due to the main coverage of FTO on FO particle surfaces. And this can also be explained as FTO particles have lower reflectance than FO, which plays a more important role in the absorption of light in nanocomposites.21 The band gap for FTO is ∼2.43 eV, which is consistent with the previous reported value of ∼2.5 eV.17,20 With decreasing x in the nanocomposites, the band gaps decrease to 1.88 eV (x = 0.80) and 1.56 eV (x = 0.60), leading to an enhanced absorption capability of light through a broader wavelength range.17
The valence states of Fe and Ti of nanocomposites (x = 0.00, 0.60, 0.80 and 1.00) was studied by XPS as in Fig. 4. The C 1s peak (284.8 eV) is used for charge correction. It is reported that the binding energy of Fe2+, Fe3+, Ti3+ and Ti4+ are 709.0 eV, 711.0 eV, 457.1 eV and 458.6 eV, respectively,36,37 which have been used for peak fittings. The Fe 2p spectra are shown in Fig. 4(a)–(d) from x = 0.00, 0.60, 0.80 and 1.00, respectively. As can be seen, with the introduction of FTO, the 2p3/2 peaks shift to lower binding energy from 711.0 eV for Fe3+ to 709.0 eV for Fe2+.32 From the peak fitting of 2p3/2 fitting, an obviously varied proportion is observed, which is in agreement with the measured ratios of xFTO–(1 − x)FO nanocomposites. The results are shown in Table S2 (ESI†). The Ti 2p spectra are shown in Fig. 4(e)–(g) for x = 0.60, 0.80 and 1.00, respectively. There is only slight fluctuation of the proportion of Ti3+ and Ti4+ due to the different samples with slightly fluctuated fabricating conditions of FTO. Since XPS is a very sensitive surface technique with depth limitation of about 5 nm, the concentration of Fe2+ will increase drastically and be much higher than x due to the coverage of FTO on FO particles without interdiffusion. Thus the XPS results clearly confirm the interdiffusion between FTO and FO.
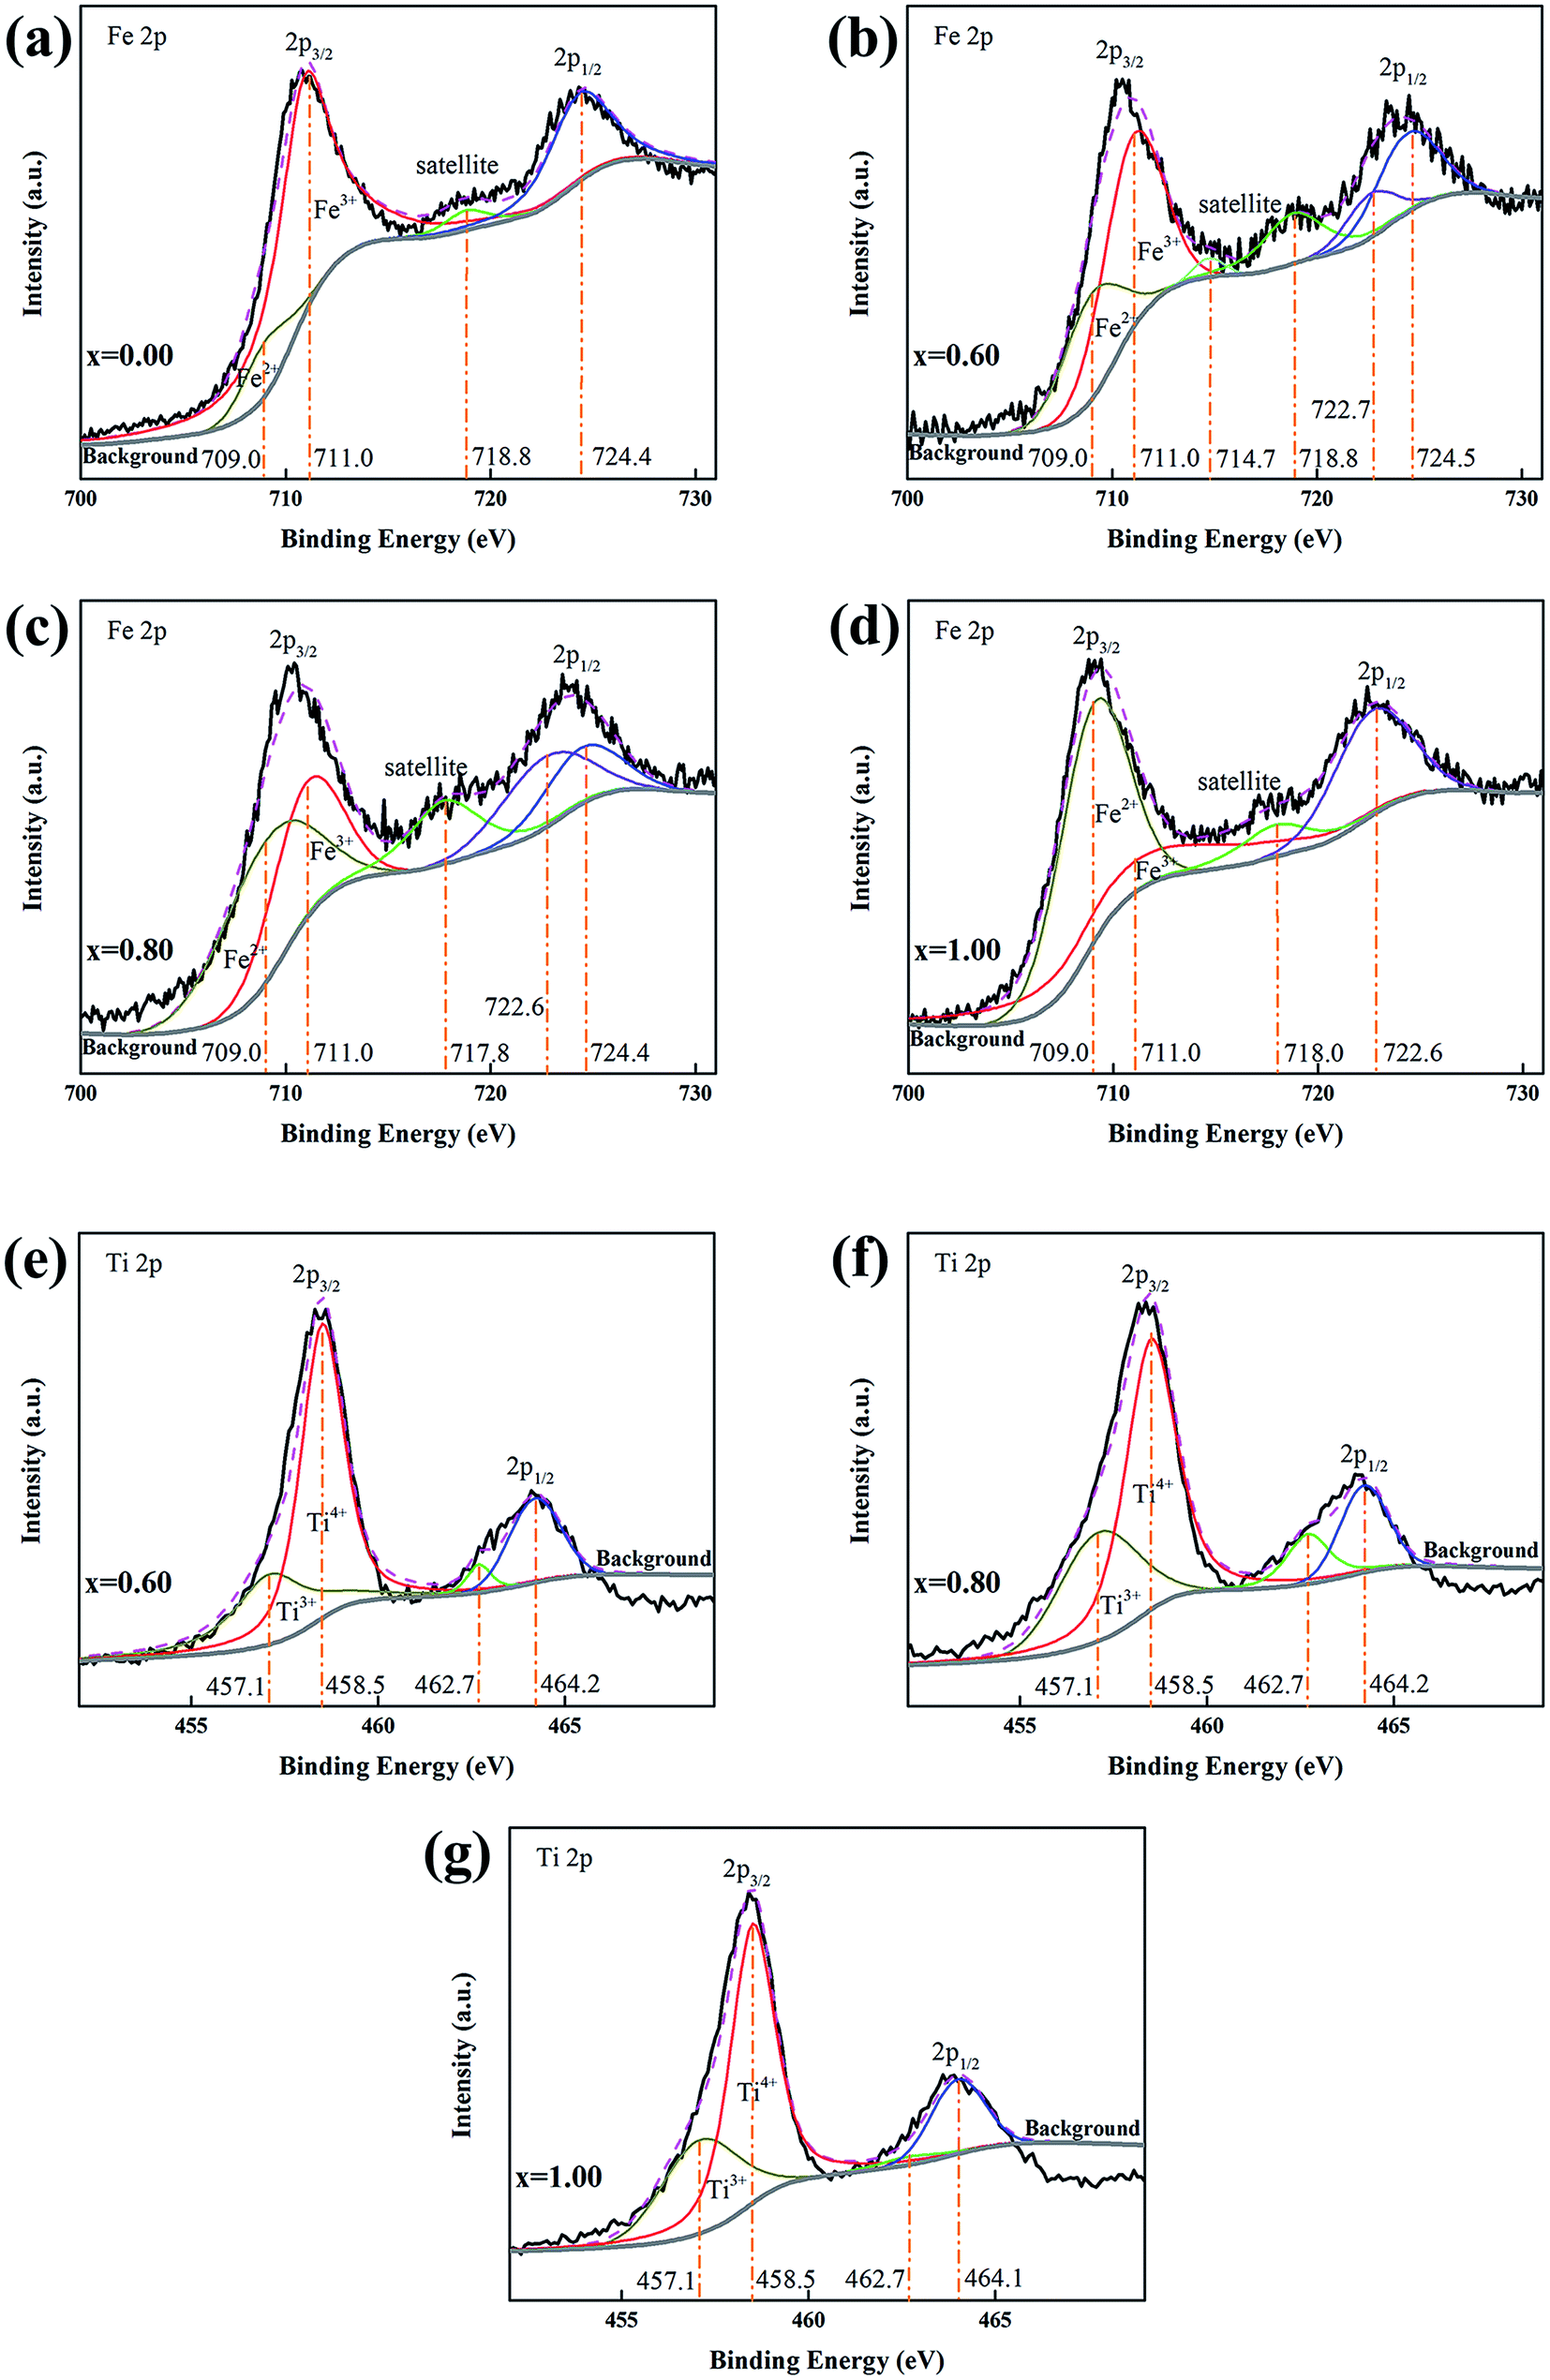 | ||
| Fig. 4 The XPS spectra of the nanocomposites forth Fe 2p of (a), (b), (c) and (d) for x = 0.00, 0.60, 0.80, 1.00, respectively, and Ti 2p spectra of (e), (f) and (g) for x = 0.60, 0.80, 1.00, respectively. | ||
Photocatalytic efficiencies were measured by decomposing RhB as model contaminant under a visible light illumination at room temperature.38,39 The typical time-dependent UV-vis spectra of RhB solution decomposed by xFTO–(1 − x)FO (x = 0.60) in photochemical reaction is shown in Fig. 5(a). The intensity of the characteristic absorption peak of RhB solution decreases with time. The absorption peak position shifts to shorter wavelength, revealing the mechanism of N-deethylation mechanism in the photochemical reaction.40 Photocatalytic processes for the degradation of RhB aqueous solutions using xFTO–(1 − x)FO are shown in Fig. 5(b). It can be clearly seen that xFTO–(1 − x)FO (x = 0.60) shows the highest photocatalytic capability. After 5 h, about 90% RhB was degraded. For better comprehension of kinetics of the RhB degradation, the fitting using pseudo-first-order model (ln(C/C0)) = Kt, where t is the irradiation time and K is the reaction coefficient, is drawn in Fig. 5(c). The reaction coefficient K calculated from the slope of the curves is illustrated in Fig. 5(d). The highest value of K of 0.375 is obtained for xFTO–(1 − x)FO (x = 0.60), which is almost 8 times of FO (0.048), and 4 time of FTO (0.086). The decrease of K for x = 0.80 sample can be explained as excessive coverage of FO particles by FTO, which might impede photo-generated electrons in FO to participate the reaction. Furthermore, the conductivity of xFTO–(1 − x)FO solid solutions has been studied, and the resistivity is minimum when x is between 0.50 and 0.60.20 This indicates the highest electric conductivity for xFTO–(1 − x)FO (x = 0.60), which is beneficial for the photocatalytic activity. The specific surface area of xFTO–(1 − x)FO (x = 0.60) (14.966 m2 g−1) is smaller than that of FTO (24.554 m2 g−1), excluding the contribution of surface area on the improvement of photocatalytic capability (Fig. S1, ESI†). We further prepared the mechanically mixed powder of FTO and FO with molar ratio same to xFTO–(1 − x)FO (x = 0.60), the photocatalytic capability is only similar to pure FTO and FO (Fig. S2, ESI†), indicating the important role of the interface region in the xFTO–(1 − x)FO (x = 0.60) nanocomposites. Due the inorganic nature of our composites and photocatalytic operation at room temperature, the good recycling ability can be expected.41,42
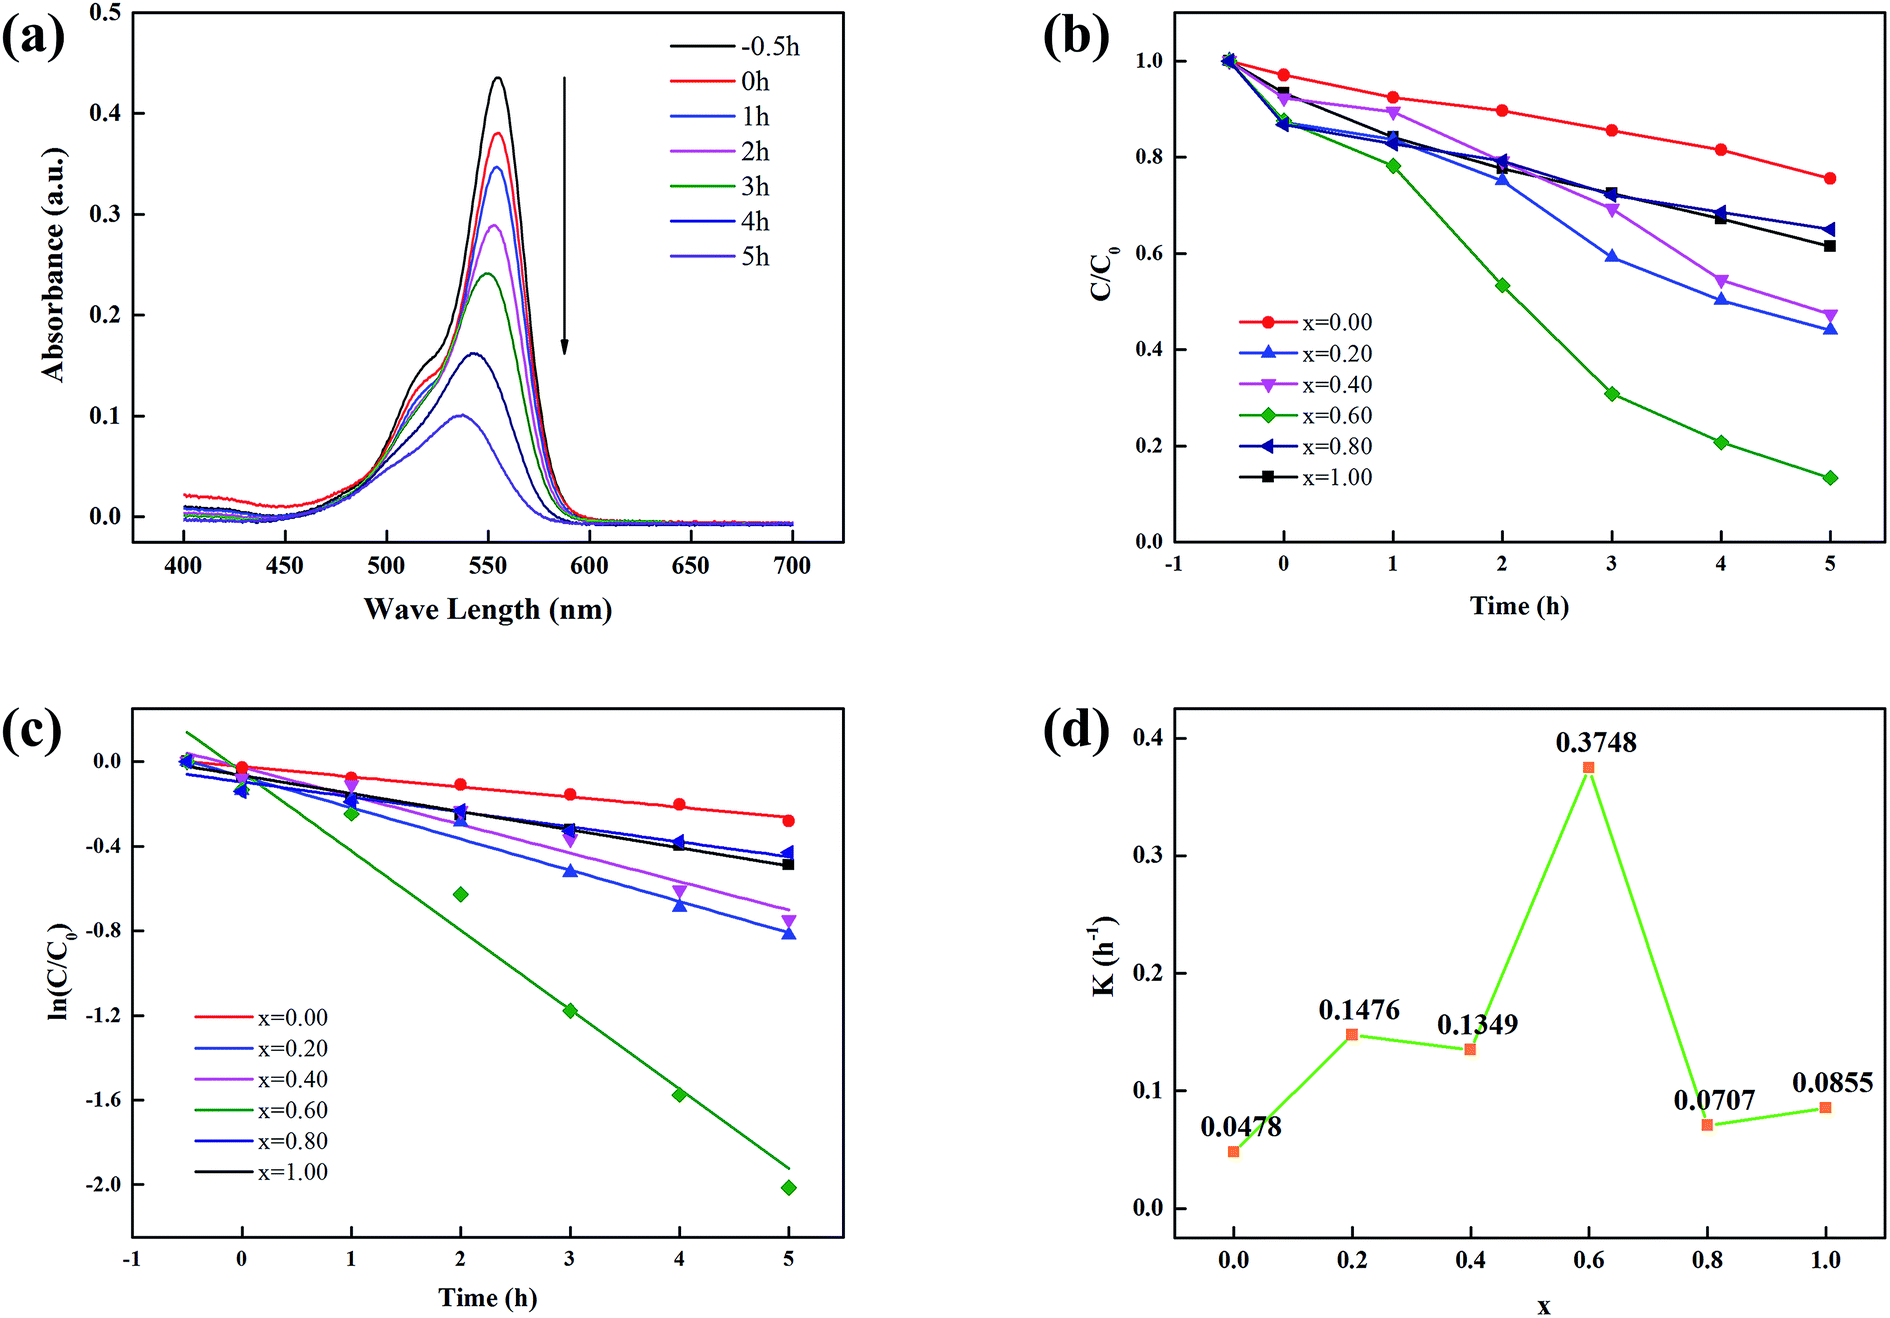 | ||
| Fig. 5 (a) Absorption spectra for the degradation of RhB using xFTO–(1 − x)FO (x = 0.60). (b) The photocatalytic performances of xFTO–(1 − x)FO under visible irradiation. (c) The pseudo-first-order kinetics fitting. (d) The reaction efficiency in dependence on x. | ||
The field dependent magnetization (M − H) curves for xFTO–(1 − x)FO were measured by VSM, as shown in Fig. 6. Clear hysteresis loops can be observed, indicating the ferromagnetic nature. The saturated magnetization (Msat) in dependence on x is plotted in the inset of Fig. 6(a). With x ≤ 0.40, only weak ferromagnetism with small Msat is observed. While x is larger than 0.60, strong ferromagnetism with large Msat can be seen. Similar phenomenon has been reported by Y. Ishikawa et al.23 Interestingly, considerably strong ferromagnetism is also observed for pure FTO, which is in contrasts to its antiferromagnetic nature.23 This might be due to the O deficiency observed by XPS, which can significantly enhance the ferromagnetism in FTO.23 The strongly enhanced ferromagnetism in solid solution of FTO and FO with FTO concentration higher than 50% mainly comes from Fe2+ ions and the magnetic moments of Fe3+ ions are canceled each other out.43 However, the saturated magnetization of xFTO–(1 − x)FO is much smaller than that of solid solution with the same concentration. For example, Msat for solid solution with x = 0.60 is larger than 150 emu cm−3, which is about 30 emu g−1 (considering the average mass density of about 5 g cm−3), while Msat of xFTO–(1 − x)FO (x = 0.60) is only 6.3 emu g−1. Thus, we can conclude that in the as-prepared xFTO–(1 − x)FO, interdiffusion happens and solid solution forms at interface region between FTO and FO with varying FTO concentration from high at FTO side to low at FO side. The wasp-waist shape M − H curves shown in the magnified view of low field in Fig. 6(b) (x = 0.80, red) is due to the superposition of M − H curves of the solid solution with varying FTO concentration, which has various coercivities.44
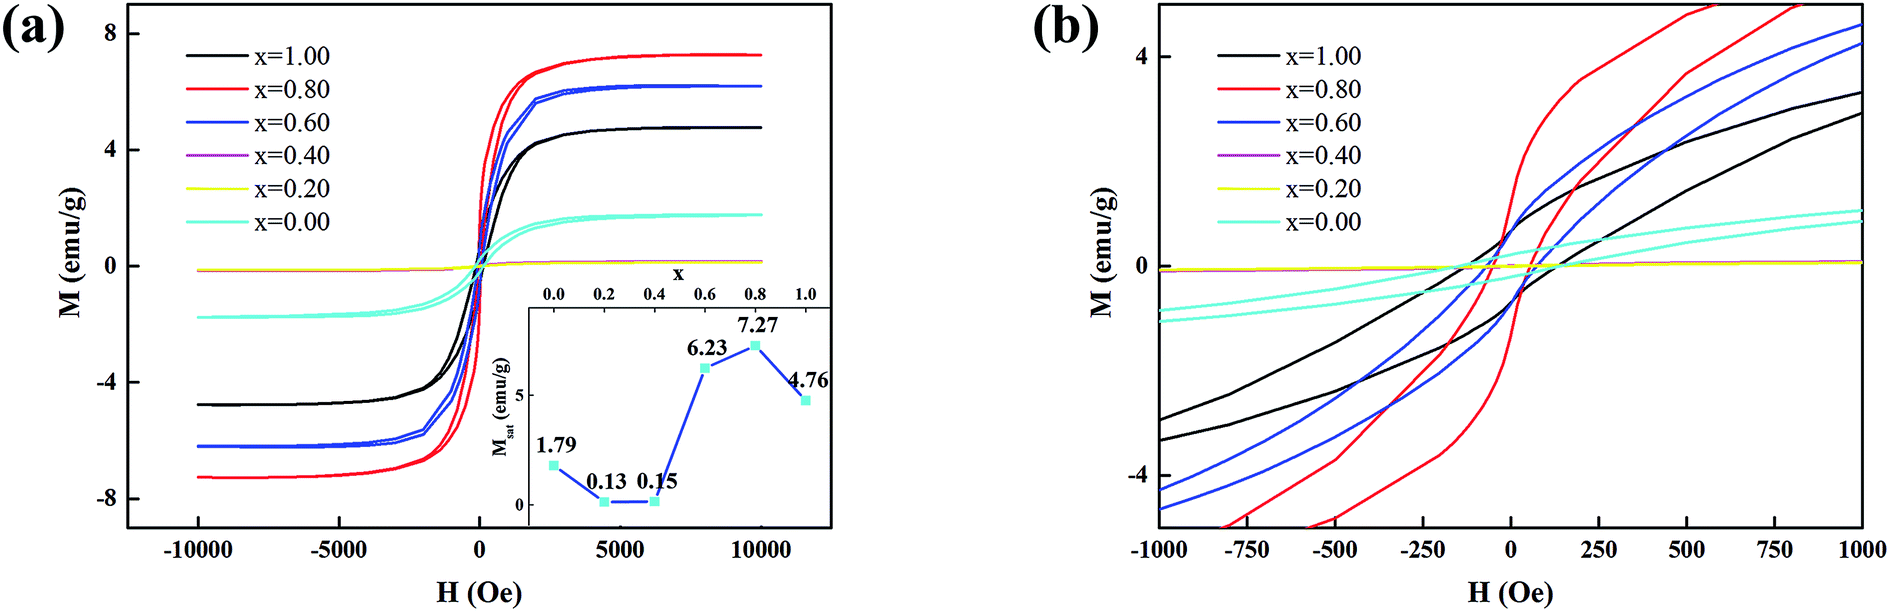 | ||
| Fig. 6 (a) M − H curves, and (b) the enlarged view of M − H curves for xFTO–(1 − x)FO. The inset in (a) shows the dependence of saturated magnetization on x. | ||
To further improve the interdiffusion at the interface between FTO and FO, annealing was performed to xFTO–(1 − x)FO (x = 0.60), which shows the best photocatalytic capability. The XRD patterns show that no observable changes can be observed with annealing temperature increased up to 700 °C (Fig. S3†). The SEM images show that the roughly wrapped surface with FTO nanoparticles on FO particles disappears and becomes smooth, which is similar to FO (Fig. S4†). This indicates that the increasing annealing temperature improves the interdiffusion between FTO and FO. Raman spectra were also studied that no obvious difference appears among the annealed samples, in agreement with XRD (Fig. S5†). The valence states of Fe 2p and Ti 2p of annealed sample of x = 0.60 at 300 °C and 700 °C were tested. No obvious change of valence states can be observed at 300 °C. But it shows a significant transformation of Fe2+ + Ti4+ to Fe3+ + Ti3+ at 700 °C (Fig. S6†).21 This might be induced by many reasons including interdiffusion, valence states transfer in FTO and O defects, which is not involved in our discussion. The photocatalytic capability was measured for the annealed samples by degradation of RhB (Fig. S7†). With increasing the annealing temperature to 300 °C, the reaction coefficient K is further increased to 0.52, and abruptly drops with further increasing annealing temperature above 400 °C, as shown in Fig. 7(a). Interestingly, the magnetic properties show the similar dependence on annealing temperature, as shown in Fig. 7(b). With increasing annealing temperature to 300 °C, Msat increases to 8.1 emu g−1, which is about 31% increment. With further increasing annealing temperature, Msat then decreases (Fig. S8†).
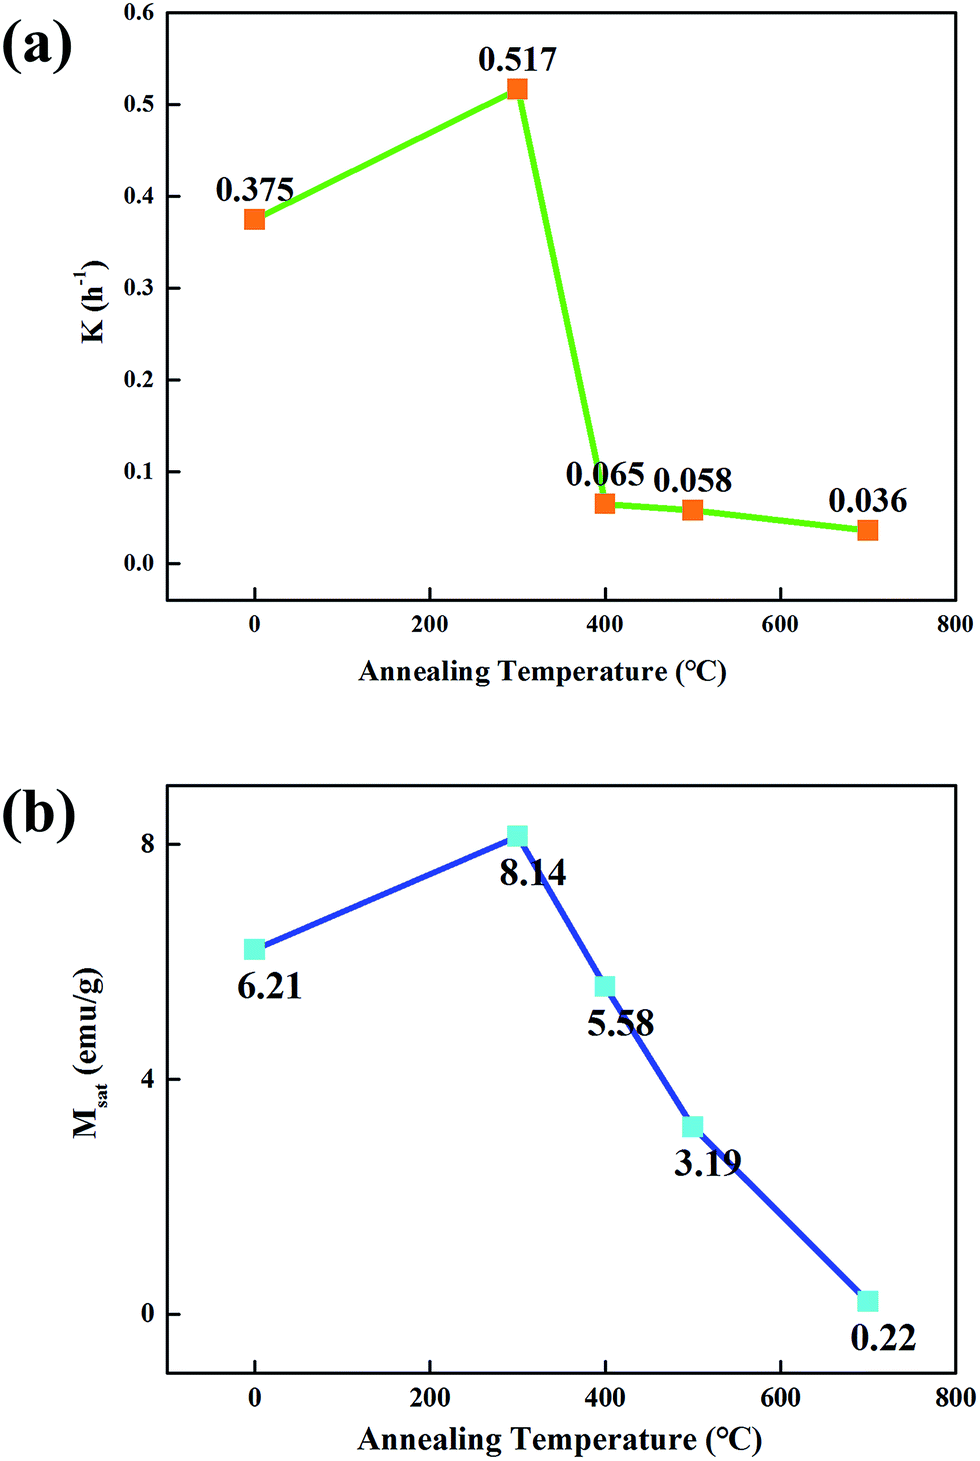 | ||
| Fig. 7 (a) The reaction coefficient K, and (b) saturated magnetization Msat of xFTO–(1 − x)FO (x = 0.60) annealed at various temperatures. | ||
This significant enhanced photocatalytic capability has been observed for xFTO–(1 − x)FO (x = 0.60) annealed at 300 °C, which is 6 times of FTO and 11 times of FO, with strong room temperature ferromagnetism, which makes it a potential ferromagnetic photocatalyst. To understand the mechanism, a schematic diagram is shown in Fig. 8. Due to the interdiffusion at the interface between FTO and FO inside the nanocomposite particles, solution with high concentration of FTO and low concentration of FTO forms at the interface. It has been reported that electric conductivity of FTO and FO solid solution shows p-type for FTO concentration higher than 73% and n-type for FTO concentration lower than 73%.20 Thus, p–n junction may form at the interface region, which induces the built-in-electric field at the interface. The electric field may facilitate the separation of the photon-generated electron–hole pairs and avoid the recombination,15 which improves the photocatalytic capability. And due to the existence of FTO–FO solid solution at the interface with high FTO concentration, significantly enhanced ferromagnetism can be observed.23 The proper annealing may enlarge the interdiffusion region of FTO and FO nanocomposites, which provides a larger separating region. Thus, larger amounts of photon-generated carriers may participate in the reaction without recombination. And the enlarged interdiffusion region with high FTO concentration may further increase the ferromagnetic properties. However, with further increasing annealing temperature, the interdiffusion may induce the uniform distribution of FTO in FO, which may destroy the p–n junction. Thus, the separation of electrons and holes is weakened. Furthermore, the solid solution with high concentration of FTO decreases, leading to the decreases of magnetization.23
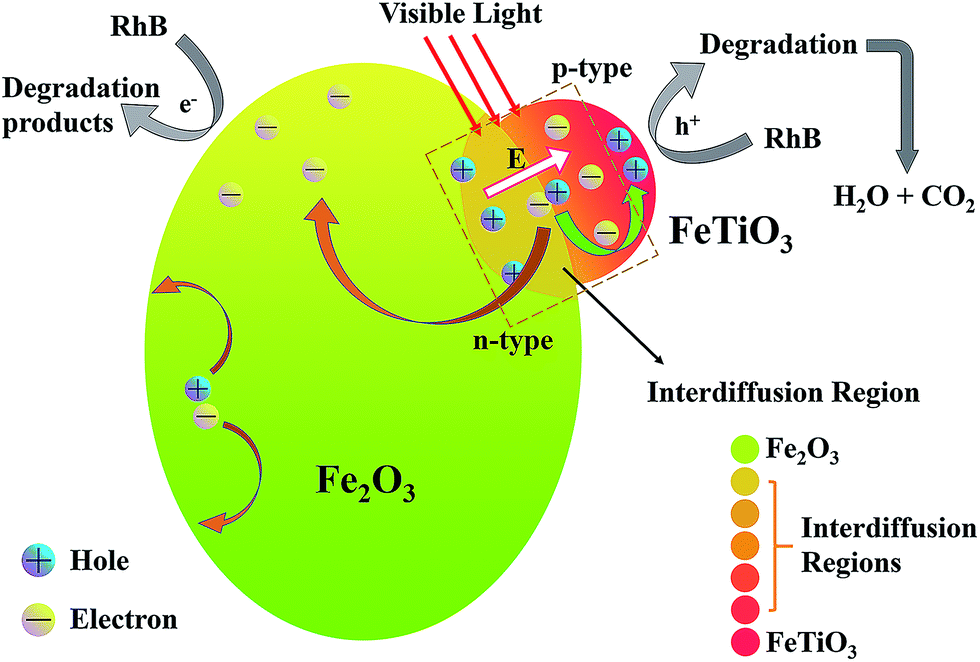 | ||
| Fig. 8 The schematic diagram of the mechanism of enhanced photocatalytic capability for the nanocomposites. | ||
Conclusions
In conclusion, xFTO–(1 − x)FO nanocomposites were prepared using hydrothermal method. The structural characterization indicates the epitaxial growth of FTO on the surface of FO particles. The band gap decreases from 2.43 eV (x = 1.00) to 1.56 eV (x = 0.60), which broadens the absorption wavelength range. The photocatalytic capability has been significantly improved. xFTO–(1 − x)FO (x = 0.60) shows the highest reaction coefficient, which is about 8 times of FO and 4 times of FTO. Furthermore, strong ferromagnetism has been observed for xFTO–(1 − x)FO with x ≥ 0.60, up to 7.27 emu g−1 (x = 0.80). The photocatalytic capability and ferromagnetism of xFTO–(1 − x)FO (x = 0.60) are both further improved by over 30% after annealing at 300 °C, but drastically decrease with further increasing the annealing temperature. The mechanism has been ascribed to the interdiffusion between FTO and FO at interfaces inside the nanocomposite particles. The solid solution with various FTO concentrations at interface region is formed by interdiffusion, leading to the formation of p–n junction, which may facilitate the separation of photon-induced electron–hole pairs by the built-in-electric field. The strong ferromagnetism comes from the solid solution at interdiffusion regions with higher concentration of FTO.Conflicts of interest
There are no conflicts to declare.Acknowledgements
This work is supported by the National Natural Science Foundation of China (51771053, 51471085), the Natural Science Foundation of Jiangsu Province of China (BK20151400, BK20140054), and the open research fund of Key Laboratory of MEMS of Ministry of Education, Southeast University.References
- A. Fujishima and K. Honda, Nature, 1972, 238, 37–38 CrossRef CAS PubMed.
- A. Manikandan, E. Manikandan, B. Meenatchi, S. Vadivel, S. K. Jaganathan, R. Ladchumananandasivam, M. Henini, M. Maaza and J. S. Aanand, J. Alloys Compd., 2017, 723, 1155–1161 CrossRef CAS.
- N. C. S. Selvam, A. Manikandan, L. J. Kennedy and J. J. Vijaya, J. Colloid Interface Sci., 2013, 389, 91–98 CrossRef CAS PubMed.
- D. Maruthamani, S. Vadivel, M. Kumaravel, B. Saravanakumar, B. Paul, S. S. Dhar, A. Habibi-Yangjeh, A. Manikandan and G. Ramadoss, J. Colloid Interface Sci., 2017, 498, 449–459 CrossRef CAS PubMed.
- Z. S. Wang, Y. Cui, K. Hara, Y. Dan, C. Kasada and A. Shinpo, Adv. Mater., 2007, 19, 1138–1141 CrossRef CAS.
- Z. Zhao, H. Liu and S. Chen, Nanoscale, 2012, 4, 7301–7373 RSC.
- Q. D. Truong, J. Y. Liu, C. C. Chung and Y. C. Ling, Catal. Commun., 2012, 19, 85–89 CrossRef CAS.
- X. Meng, Z. Li, H. Zeng, J. Chen and Z. Zhang, Appl. Catal., B, 2017, 210, 160–172 CrossRef CAS.
- Y. Yuana, Z. Yub, Y. Li, H. Lu, X. Chen, W. Tu, Z. Ji and Z. Zou, Appl. Catal., B, 2016, 181, 16–23 CrossRef.
- H. Li, Y. Sang, S. Chang, X. Huang, Y. Zhang, R. Yang, H. Jiang, H. Liu and Z. Wang, Nano Lett., 2015, 15, 2372–2379 CrossRef CAS PubMed.
- X. Meng and Z. Zhang, J. Photochem. Photobiol., A, 2015, 310, 33–44 CrossRef CAS.
- X. Yu, J. Zhang, Z. Zhao, W. Guo, J. Qiu, X. Mou, A. Li, J. P. Claverie and H. Liu, Nano Energy, 2015, 16, 207–217 CrossRef CAS.
- H. Wang, L. Zhang, Z. Chen, J. Hu, S. Li, Z. Wang, J. Liu and X. Wang, Chem. Soc. Rev., 2014, 43, 5234–5244 RSC.
- L. Li, P. A. Salvador and G. S. Rohrer, Nanoscale, 2014, 6, 24 RSC.
- H. Wang, L. Zhang, Z. Chen, J. Hu, S. Li, Z. Wang, J. Liu and X. Wang, Chem. Soc. Rev., 2014, 43, 5234 RSC.
- G. Rollmann, A. Rohrbach, P. Entel and J. Hafne, Phys. Rev. B: Condens. Matter Mater. Phys., 2004, 69, 165107 CrossRef.
- D. S. Ginley and M. A. Butler, J. Appl. Phys., 1977, 48, 5 CrossRef.
- M. Mishra and D. Chun, Appl. Catal., A, 2015, 498, 126–141 CrossRef CAS.
- L. Qin, Z. Cheng, J. A. Fan, D. Kopechek, D. Xu, N. Deshpande and L. Fan, J. Mater. Chem. A, 2015, 3, 11302 CAS.
- Y. Ishikawa, J. Phys. Soc. Jpn., 1958, 13, 1 CrossRef.
- Y. J. Kim, B. Gao, S. Y. Han, M. H. Jung, A. K. Chakraborty, T. Ko, C. Lee and W. I. Lee, J. Phys. Chem. C, 2009, 113, 19179–19184 CAS.
- X. Zhang, T. Li, Z. Gong, H. Zhao, L. Wang, J. Wan, D. Wang, X. Li and W. Fu, J. Alloys Compd., 2015, 653, 619–623 CrossRef CAS.
- Y. Ishikawa and S. Akimoto, J. Phys. Soc. Jpn., 1957, 12, 10 Search PubMed.
- C. Barathiraja, A. Manikandan, A. M. U. Mohideen, S. Jayasree and S. A. Antony, J. Supercond. Novel Magn., 2016, 29, 477–486 CrossRef CAS.
- V. M. Teresita, A. Manikandan, B. A. Josephine, S. Sujatha and S. A. Antony, J. Supercond. Novel Magn., 2016, 29, 1691–1701 CrossRef CAS.
- A. Manikandan, M. Durka, K. Seevakan and S. A. Antony, J. Supercond. Novel Magn., 2015, 28, 1405–1416 CrossRef CAS.
- D. K. Manimegalai, A. Manikandan, S. Moortheswaran and S. A. Antony, J. Supercond. Novel Magn., 2015, 28, 2755–2766 CrossRef CAS.
- R. J. Harrison and S. A. T. Redfern, Phys. Chem. Miner., 2001, 28, 399–412 CrossRef CAS.
- X. Guang, J. Zheng, M. Zhao, L. Li and G. Li, RSC Adv., 2013, 3, 13635 RSC.
- D. L. A. Faria, S. V. Silva and M. T. Oliveira, J. Raman Spectrosc., 1997, 28, 873 CrossRef.
- X. Wu, S. Qin and L. Dubrovinsky, J. Solid State Chem., 2010, 183, 2483 CrossRef CAS.
- D. Gu, Y. Qin, Y. Wen, L. Qin and H. J. Seo, J. Taiwan Inst. Chem. Eng., 2017, 78, 431 CrossRef CAS.
- B. Meenatchi, V. S. Lakshmi, A. Manikandan, V. Renuga, A. Sharmila, K. R. N. Deve and S. K. Jaganathan, J. Inorg. Organomet. Polym., 2017, 27, 446–454 CrossRef CAS.
- S. Suguna, S. Shankar, S. K. Jaganathan and A. Manikandan, J. Supercond. Novel Magn., 2017, 30, 691–699 CrossRef CAS.
- C. S. Garoufalis, P. Poulopoulos, N. Bouropoulos, A. Barnasas and S. Baskoutas, Phys. E, 2017, 89, 67 CrossRef CAS.
- T. Yamashita and P. Hayes, Appl. Surf. Sci., 2008, 254, 2441–2449 CrossRef CAS.
- M. C. Biesinger, L. W. M. Lau, A. R. Gerson and R. S. C. Smart, Appl. Surf. Sci., 2010, 257, 887–898 CrossRef CAS.
- A. Manikandan, E. Hema, M. Durka, M. A. Selvi, T. Alagesan and S. A. Antony, J. Inorg. Organomet. Polym., 2015, 25, 804–815 CrossRef CAS.
- G. Mathubala, A. Manikandan, S. A. Antony and P. Ramar, J. Mol. Struct., 2016, 1113, 79–87 CrossRef CAS.
- Q. Wang, C. Chen, D. Zhao, W. Ma and J. Zhao, Langmuir, 2008, 24, 7338–7345 CrossRef CAS PubMed.
- Y. Guo, G. Zhang, J. Liu and Y. Zhang, RSC Adv., 2013, 3, 2963 RSC.
- S. Sivakumar, A. Selvaraj, A. K. Ramasamy and V. Balasubramanian, Water, Air, Soil Pollut., 2013, 224, 1529 CrossRef.
- H. Hojo, K. Fujita, H. Ikeno, T. Matoba, T. Mizoguchi, I. Tanaka, T. Nakamura, Y. Takeda, T. Okane and K. Tanaka, Appl. Phys. Lett., 2014, 104, 112408 CrossRef.
- A. A. Cristóbal, C. P. Ramos, P. G. Bercoff, P. M. Botta and J. M. P. López, Mater. Chem. Phys., 2012, 133, 971 CrossRef.
Footnote |
| † Electronic supplementary information (ESI) available. See DOI: 10.1039/c7ra11007c |
| This journal is © The Royal Society of Chemistry 2017 |