
 Open Access Article
 This Open Access Article is licensed under a Creative Commons Attribution-Non Commercial 3.0 Unported Licence
Nano-composite of Co3O4 and Cu with enhanced stability and catalytic performance for non-enzymatic electrochemical glucose sensors
Xiaoyun Lin *a,
Yanfang Wanga,
Wenhui Hea,
Yongnian Ni*ab and
Serge Kokotc
*a,
Yanfang Wanga,
Wenhui Hea,
Yongnian Ni*ab and
Serge Kokotc
aCollege of Chemistry, Nanchang University, Nanchang 330031, China. E-mail: linxiaoyun@ncu.edu.cn; ynni@ncu.edu.cn; Fax: +86 791 83969500; Tel: +86 791 83969500
bState Key Laboratory of Food Science and Technology, Nanchang University, Nanchang 330047, China
cSchool of Chemistry, Physics and Mechanical Engineering, Queensland University of Technology, Brisbane 4001, Australia
First published on 28th November 2017
Abstract
Nanostructured Co3O4 with near-cubic morphology was synthesised using the solvothermal method, and a non-enzymatic electrochemical glucose sensor (Co3O4–CuNPs/Pt) was successfully constructed by dropping and potentiostatic depositing technologies. The obtained Co3O4 and Co3O4–CuNPs were characterised and investigated by X-ray powder diffraction, scanning electron microscopy, transmission electron microscopy, energy dispersive X-ray spectroscopy and X-ray photoelectron spectroscopy. Quantitative analysis of glucose was performed using the amperometric (i–t) method, and a plot of current difference versus concentration of glucose was linear in the range 0.5–336 μM, with a linear correlation coefficient (R2) of 0.9989 and limit of detection (LOD) of 0.43 μM. When the linear range was reduced to 0.5–76.5 μM, R2 and LOD were 0.9997 and 0.17 μM, respectively. The sensitivity of the sensor was evaluated as 3.58 × 10⁴ and 4.03 × 10⁴ μA μM−1 cm−2 for the above two linear ranges, respectively. This novel sensor produced satisfactory reproducibility and stability and was applied to monitor trace amounts of glucose in human serum samples.
1. Introduction
Glucose is one of the most important and widely used aldohexoses in living bodies. One possible reason for this condition is that glucose is less likely to react non-specifically with the amine groups of proteins compared with other aldohexoses.1Diabetes is one of the metabolic diseases characterised by high blood sugar levels for long periods. High blood sugar symptoms, such as frequent urination and increased thirst and hunger, will be observed. When left untreated, serious long-term complications, mainly including cardiovascular disease, stroke, chronic nephropathy, foot ulcers and damage to the eyes, may significantly cause increased morbidity and mortality among diabetics and bring about severe economic burden for individuals and countries.2 To monitor blood sugar level accurately, tremendous efforts have been exerted for developing glucose sensors with high sensitivity, good selectivity, easy operation and inexpensiveness.3–6 Basing on electroanalytical techniques, researchers studied and developed a number of glucose enzyme biosensors. However, enzymatic activity is susceptible to environmental temperature, atmospheric humidity, pH value and toxic chemicals.7–9 The use of enzymes is usually very expensive, and enzyme-based sensing requires either non-physiological electron mediators or oxygen.
As expected, studies on glucose non-enzymatic electrochemical sensors have focused on noble metals and transition metals.10–19 These non-enzymatic sensors can overcome the disadvantage of enzyme-based sensors, but some problems in practical application, such as low sensitivity and poor selectivity, still exist. Nano-composites generally exert synergistic effects, and significantly enhance electrocatalytic performance compared with single-component ones, receiving increasing interest in recent years.3–6,18–21
Cobalt tetroxide (Co3O4) is an important transition metal oxide and magnetic p-type semiconductor due to its low cost, good chemical stability and considerably high specific capacitance. This compound has been extensively investigated for application in photocatalysis,22 super capacitors,23 lithium-ion batteries24,25 and electrochemical sensors.26,27 Recently, sensors based on Co3O4 nanomaterial, which exhibits improved stability and catalytic performance especially for detecting glucose and hydrogen peroxide, have attracted considerable attention. Reported works28–30 showed that Co3O4 and copper nano-structures possess highly reversible capacity, good cycling stability and high rate capability.
The aims of this study were as follows: (1) to produce stable mixed films of CuNPs/Co3O4 composite by dropping and potentiostatic deposition methods, (2) to investigate electrochemical and electrocatalytic performance of CuNPs/Co3O4/Pt with the use of cyclic voltammetry (CV) and amperometric methods and (3) to develop an excellent quantitative method for detection of glucose in CuNPs/Co3O4/Pt with the use of amperometric (i–t) technique.
2. Experimental
2.1. Reagents
Glucose (A.R.), Co(NO3)2·6H2O (A.R., >99.9%), polyethylene glycol (HO(CH2CH2O)nH) (M = 20![[thin space (1/6-em)]](https://www.rsc.org/images/entities/char_2009.gif) 000) and n-butyl alcohol (CH3CH2CH2CH2OH) (A.R., 99.9%) were obtained from Aladdin Chemistry Co., Ltd, Shanghai, China; Human serum samples were supplied by clinical laboratory of the second affiliated hospital of Nanchang University; All other chemicals (A.R.) were obtained from Beijing Chemical Reagent Co., China and used without further purification. Double-distilled water was used throughout experiments.
000) and n-butyl alcohol (CH3CH2CH2CH2OH) (A.R., 99.9%) were obtained from Aladdin Chemistry Co., Ltd, Shanghai, China; Human serum samples were supplied by clinical laboratory of the second affiliated hospital of Nanchang University; All other chemicals (A.R.) were obtained from Beijing Chemical Reagent Co., China and used without further purification. Double-distilled water was used throughout experiments.
2.2. Instrumentation
Electroanalysis experiments were performed with the use of electrochemical workstation (CHI-660A, Chenhua Apparatus Co., Shanghai). Electrode potentials were reported with respect to the saturated calomel electrode (SCE). A cell stand (Model BAS-C1A) was used to stir test solution for voltammetric experiments.Transmission electron microscopy (TEM) and energy dispersive X-ray spectroscopy (EDS) were performed to characterise morphology and chemical composition of prepared nano-materials with the use of a JEM-2010 (JEOL Co., Japan). Associated point and linear resolutions measured 0.23 and 0.14 nm, respectively. Accelerating voltage was set at 200 kV.
Scanning electron microscopy (SEM) images were obtained using Quanta 200F instrument (FEI Co. Ltd., Tokyo, Japan) with a power level of 20 kV. Test samples were obtained by electrodeposition or dropping onto detachable Pt electrode.
X-ray diffraction data (XRD) were recorded with the use of a Bede Scientific Instrument (Bede D1 System, Durham, UK) using Cu Kα radiation (λ = 1.5406) and a Bragg angle range of 10°–70°.
X-ray photoelectron spectroscopy (XPS) measurements were conducted on a VG Escalab-Mark II spectrometer with mono-energetic Al Kα radiation (Thermo-VG Scientific Ltd., UK).
2.3. Preparation of Co3O4
An accurately weighed 4.3661 g Co(NO3)2·6H2O was dissolved in 10.0 mL double-distilled water in a 200 mL beaker, and 15 mL of polyethylene glycol (HO(CH2CH2O)nH, M = 20000, 5 wt%), 22 mL of 1.0 mol L−1 KOH and 8.0 mL of 30% H2O2 were slowly added sequentially under stirring conditions. After continuous stirring for 30 min, the mixture was then transferred to a 100 mL Teflon-lined stainless-steel autoclave, and 15 mL of n-butyl alcohol was added to seal the mixture and reacted at 160 °C for 16 h. The mixture was then allowed to cool, and black precipitate for each composite sample was collected by centrifugation, successively washed thrice with double-distilled water and ethanol and dried in a vacuum oven at 80 °C for 8 h. The product was ground into fine powder by an agate mortar.
2.4. Preparation of Co3O4–CuNPs/Pt
Pt electrodes (Pt, 3 mm diameter) were polished with emery paper and alumina slurry (particle size: 1.0, 0.3, and 0.05 μm); they were then successively treated with nitric acid (1:1), ethanol and distilled water by means of ultrasonic cleaning. These electrodes were then immersed in 0.50 mol L−1 sulfuric acid solution and electrochemically scanned by cyclic voltammetry (potential range: −1.0–1.0 V) until a steady voltammogram was obtained.
Co3O4 nanoparticles (10.0 mg) were added to 10.0 mL N,N-dimethyl formamide (DMF) and treated by an ultrasonic dispersion method for 2 h. Dispersion was stabilised for three weeks. A 20 μL sample of this suspension was deposited on the surface of Pt electrode, and the solvent was evaporated naturally in air. A stable film of Co3O4 nanoparticles then formed on the surface of Pt without protection of Nafion or chitosan. Co3O4/Pt electrode surface was rinsed with double-distilled water to avoid any possible effects of DMF residuals before the following experiments.
Co3O4/Pt electrode was then submitted to successive potential scans (10 times) from −0.50 V to 1.50 V with a scan rate of 0.1 V s−1 in mixed solutions, including 5.0 × 10⁻⁴ mol L−1 CuSO4, 0.1 mol L−1 Na2SO4 and 0.01 mol L−1 H2SO4. Finally, the obtained Co3O4–CuNPs/Pt electrode was rinsed with double-distilled water several times. Similarly, CuNPs-modified Pt electrode (CuNPs/Pt) was prepared following the above method. Scheme 1 illustrates establishment process of the modified electrode. The Co3O4–CuNPs/Pt electrode were kept in cold storage at 4 °C.
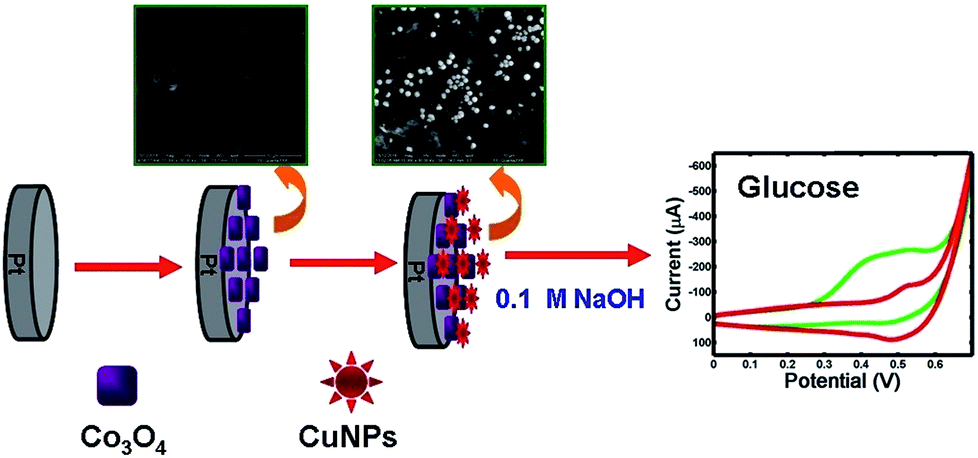 | ||
| Scheme 1 Schematic representation of fabrication of Co3O4–CuNPs/Pt and possible reaction mechanism of glucose at the modified GCE. | ||
3. Results and discussion
3.1. Characterisation of Co3O4 and Co3O4–CuNPs
TEM can provide further insights into morphology and structural features of synthesised materials. TEM images (Fig. 1A and B) indicated that the synthesised Co3O4 nanoparticles were approximately cubic, and their average diameter was approximately 15 nm. Fig. 1C and D show high-resolution TEM (HRTEM) image and corresponding selected area electron diffraction (SAED) pattern of cubic Co3O4, respectively. From the lattice fringes of HRTEM image (Fig. 1C), lattice spacing between adjacent planes measured 0.285 and 0.207 nm, corresponding to the distance between 220 and 400 lattice planes of cubic Co3O4 (Fig. 1D). SAED pattern indicated that the synthesised nano-materials is well-crystallised Co3O4 and was well consonant with XRD results (see experiment below).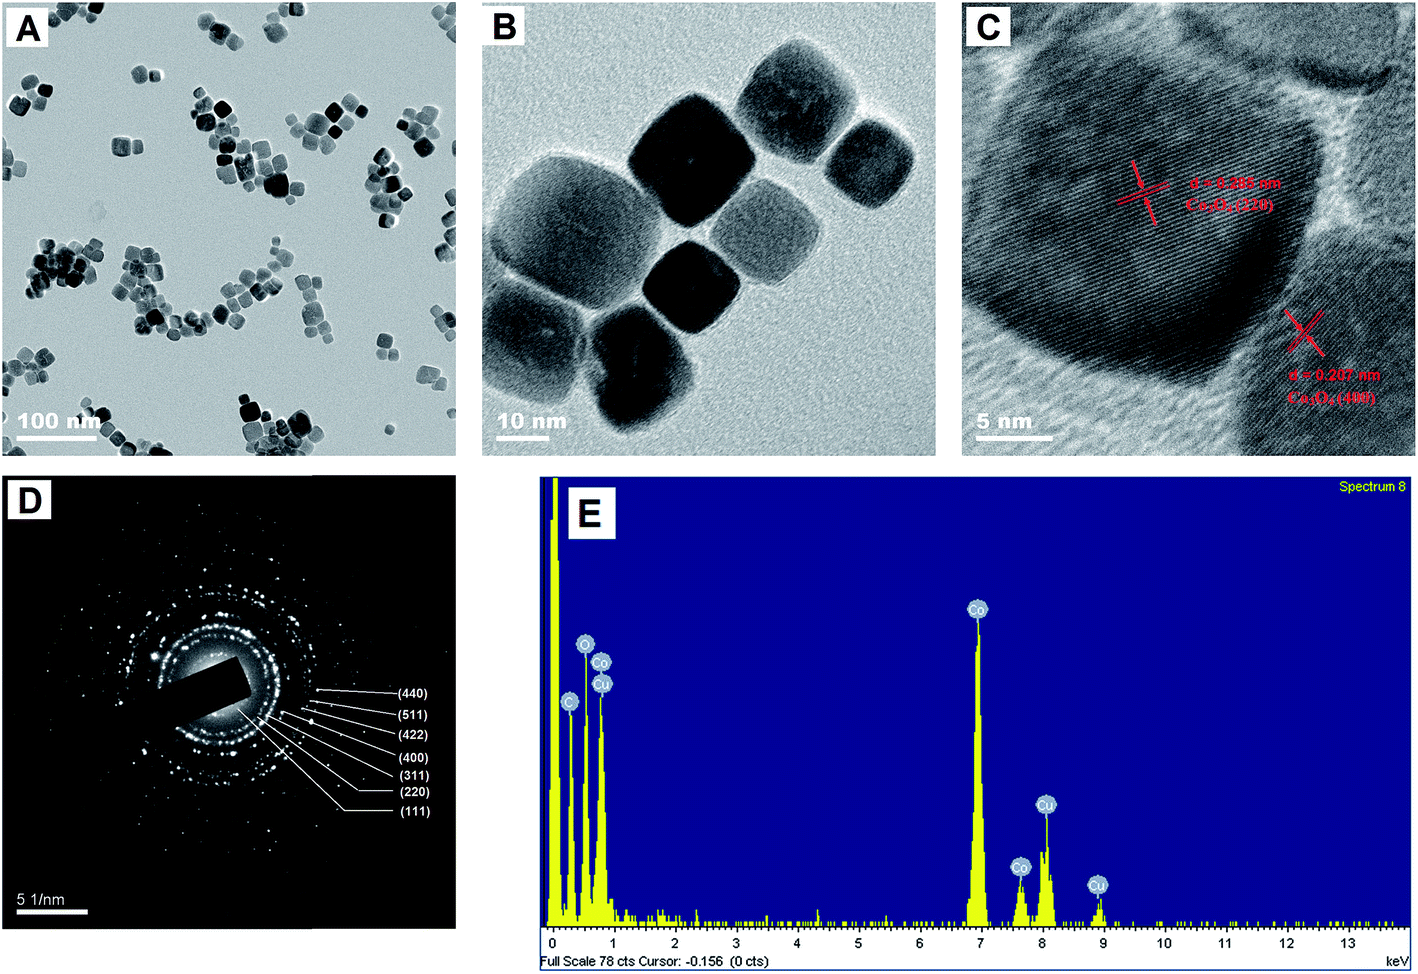 | ||
| Fig. 1 TEM images (A and B), HRTEM image (C), SAED pattern (D) and EDS (E) of Co3O4. | ||
EDS test was performed to evaluate chemical composition of Co3O4 (Fig. 1E) and affirm the existence of Co, O and Cu.
Surface composition and chemical states of cubic Co3O4 were characterised by XPS (Fig. 2A–C). Fig. 2A shows full-investigation scan spectrum of Co3O4 nanoparticles. Only Co and O elements can be observed in XPS full spectrum, confirming high chemical purity of Co3O4. In this study, the small peak located at 284.5 eV was identified as C 1s according to references.31,32 Typical spectra of Co 2p and O 1s binding energies are shown in Fig. 2B and C, respectively. As shown in Fig. 2B, Co 2p core level peaks suggest a highly nonstoichiometric property, indicating that Co atom in the prepared Co3O4 nanoparticles features two valence states, octahedral Co3+ and tetrahedral Co2+, contributing to the 2p spectral profile. The main peaks of Co3+ (2p3/2) and Co3+ (2p1/2) correspond to binding energies of 779.5 and 795.1 eV, respectively, and energy difference between the two levels is approximately 15.6 eV.
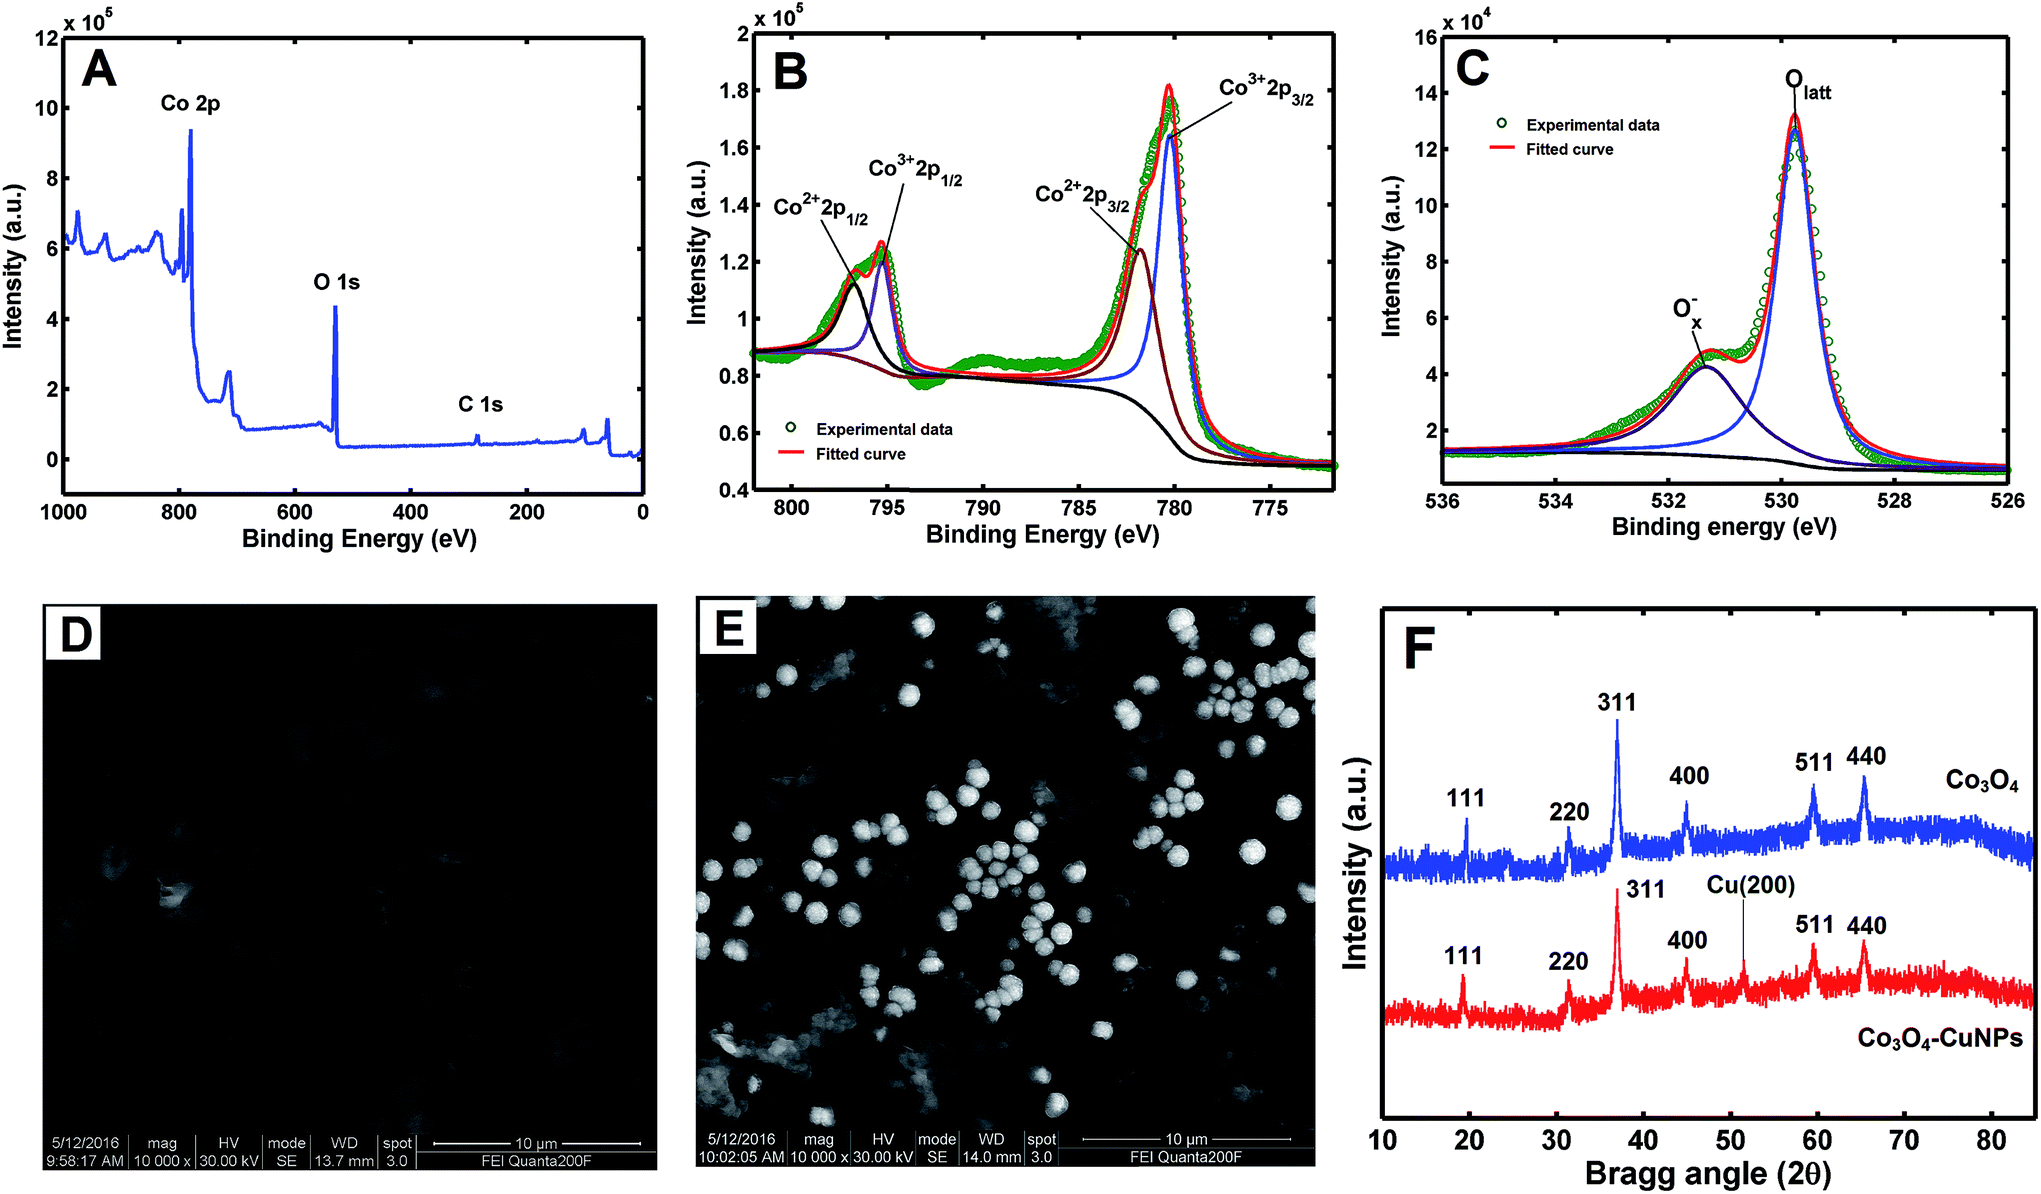 | ||
| Fig. 2 XPS spectra for scans of Co3O4 (A), Co 2p region (B) and O 1s region (C); SEM images of Co3O4/Pt (D) and Co3O4–CuNPs/Pt (E); XRD patterns (F) of Co3O4 and Co3O4–CuNPs. | ||
From Fig. 2C, the XPS spectrum of O 1s for cubic Co3O4. O 1s peak can be fit for two kinds of Gaussian peaks. The main peak at binding energy of 529.7 eV corresponds to oxygen ions in the crystal lattice (Olatt), whereas the peak located at 531.3 eV can be attributed to absorbed Ox− complex ions (including O− and O2− ions) in oxygen-deficient regions in the matrix of Co3O4.26,33
Morphologies of Co3O4/Pt (Fig. 2D) and Co3O4–CuNPs/Pt (Fig. 2E) were investigated using SEM, and a flocculent and thick structure of Co3O4 film formed on the Pt electrode surface (Fig. 2D). When CuNPs were electro-deposited on the surface of Co3O4/Pt, spherical CuNPs were well distributed on Pt electrode surface (Fig. 1E and inset). Average diameter of these nano-particles was approximately 200 nm.
Crystallinity and phase structure of prepared material was characterised by XRD. As depicted in Fig. 2F, XRD pattern of Co3O4 includes seven peaks at approximately 19.2°, 31.3°, 36.8°, 44.7°, 55.7°, 59.4° and 65.2°, which are attributable to Co3O4 (111), (220), (311), (400), (422), (511) and (440), respectively;27 the peak at approximately 50.5° confirms the presence of CuNPs (200).4 These observations suggest successful preparation of Co3O4–CuNPs nano-composite.
3.2. Optimisation of main experimental conditions for detecting glucose
Electrochemical response to glucose (50.0 μM) at the Co3O4–CuNPs/Pt was evaluated in 0.10 M NaOH solution at the applied potential from 0.2 V to 0.6 V (Fig. 3A). Maximum current change of glucose was obtained at the potential of +0.50 V, which was consequently selected for subsequent amperometric i–t measurements.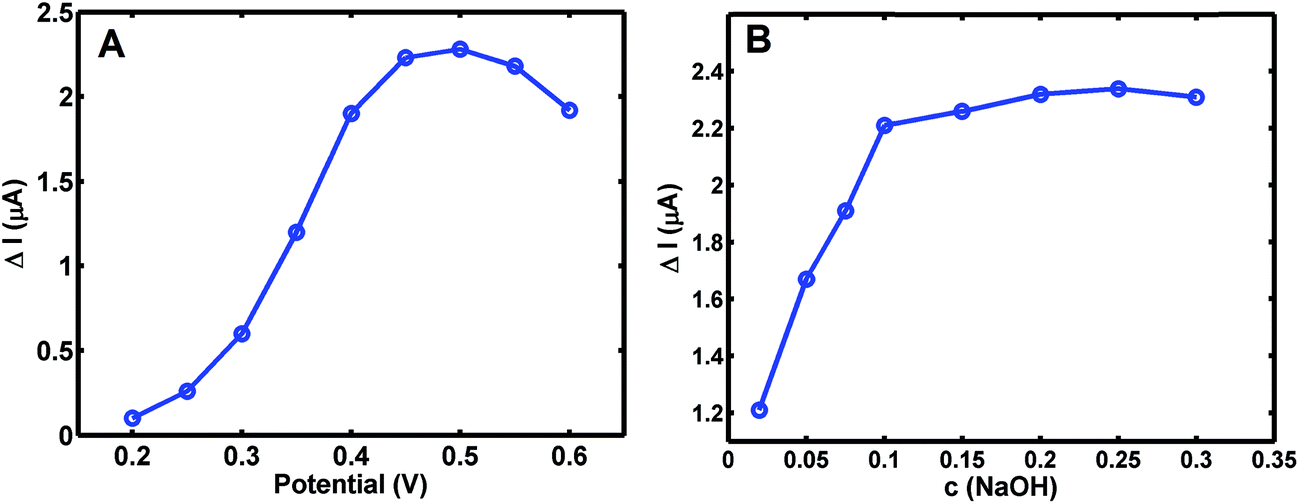 | ||
| Fig. 3 Influence of different applied potential (A) and pH (B) on Co3O4–CuNPs/Pt sensor added with 50.0 μM glucose. | ||
The influence of NaOH concentration on determination of 50.0 μM glucose at Co3O4–CuNPs/Pt was also investigated (Fig. 3B) at the applied potential of +0.5 V. Maximum current change for glucose showed no significant difference, whereas NaOH concentration changed from 0.10 M to 0.30 M. Thus, a relatively low concentration of 0.10 M of NaOH was selected for the following experiment.
3.3. Electro-catalysis of Co3O4–CuNPs/Pt for glucose
Electrochemical properties of glucose in Co3O4–CuNPs/Pt were investigated in 0.1 M NaOH solution. As shown in Fig. 4A, a couple of sensitive redox peaks can be observed at the potentials of +0.45 and +0.55 V in curves, which can be due to redox reactions of Co and Cu nanoparticles under alkaline conditions corresponding to the following equations:34,35| Cu(0) + 2OH− → Cu(OH)2 + 2e− | (1) |
| Cu(OH)2 + OH− → CuOOH + H2O + e− | (2) |
| Co3O4 + H2O + OH− → 3CoOOH + e− | (3) |
| CoOOH + OH− → CoO2 + H2O + e− | (4) |
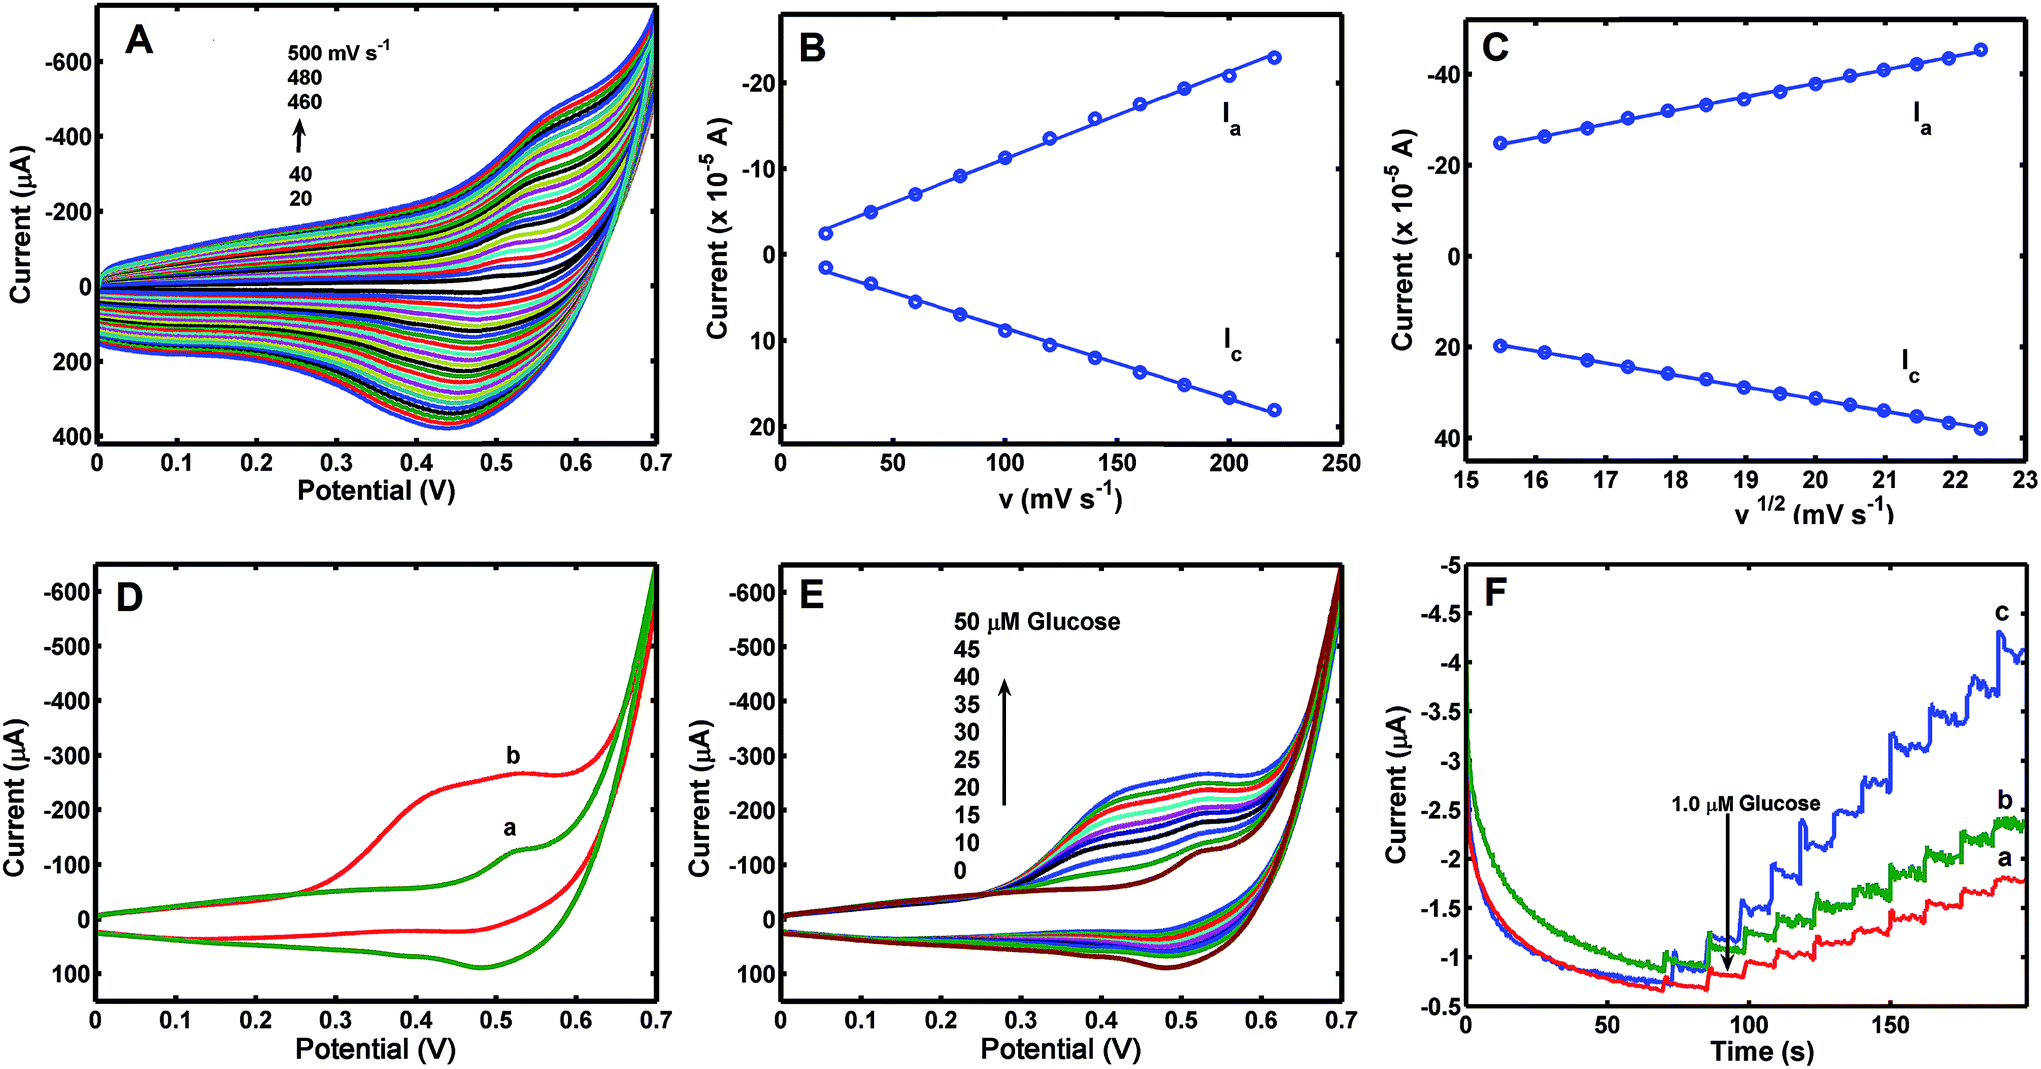 | ||
| Fig. 4 CV curves of Co3O4–CuNPs/Pt measured at different scan rates in 0.1 M NaOH solution (A); plots of redox peak currents versus scan rate (B) and square root of scan rate (C); CVs of Co3O4–CuNPs/Pt in (a) absence and (b) presence of glucose in 0.1 M NaOH solution at 0.10 V s−1 (D and E); amperometric response (F) recorded for Co3O4/Pt (a), CuNPs/Pt (b) and Co3O4–CuNPs/Pt (c). | ||
Redox peak currents were directly proportional to the potential scan rate (v) in the range of 0.02–0.22 V s−1 (Fig. 4B) and increased linearly with the square root of scan rate (v1/2) in the range of 0.24–0.50 V s−1 (Fig. 4C). These findings indicate that electrochemical process of Co3O4–CuNPs/Pt was mainly controlled by adsorption with low-speed scanning (0.02–0.22 V s−1), and diffusion-controlled process was observed when scanning rate was in the range of 0.24–0.50 V s−1.3
Fig. 4D shows CVs of Co3O4–CuNPs/Pt in 0.1 M NaOH without (curve a) and with (curve b) 50.0 μM glucose. The figure shows that oxidation peak current increased significantly after addition of 50.0 μM glucose. Catalytic currents increased linearly with concentration of glucose (Fig. 4E) in the range of 0 μM to 50.0 μM at 5 μM interval.
To investigate electrochemical performance of differently modified electrodes, amperometric (i–t) curves of modified electrodes were recorded with continuous stirring and successive step changes in glucose at +0.50 V in 0.1 M NaOH (as shown in Fig. 4F). Results indicate that Co3O4/Pt and CuNPs/Pt can also catalyse glucose (curves a and b, respectively, Fig. 4F), but a much larger catalytic current was observed at the Co3O4–CuNPs/Pt when Co3O4 and CuNPs were combined (c, Fig. 4F). This significant improvement can be attributed to synergistic catalytic effects of Co3O4 and CuNPs. Similar to previous studies,34,35 electrochemical reactions for glucose were possibly the following:
 | (5) |
 | (6) |
In 0.1 M NaOH solution, CuNFs and Co3O4 can easily transform into Cu(OH)2 and CoOOH, respectively, and under high potential conditions (+0.5 V), Cu(OH)2 and CoOOH can further be oxidised to generate a large number of CuOOH and CoO2 intermediate products, which can oxidise glucose to gluconolactone.
Chronocoulometric results obtained from the reduction of 5 × 10⁻³ mol L−1 K3[Fe(CN)6] in KCl (0.1 mol L−1) at different electrodes, were used to compare the apparent electrode areas with the use of eqn (1):9
| Q = (2nFAD01/2π−1/2C0)t1/2 | (7) |
The apparent electrode area, A, may be estimated from the slope of the Q versus t1/2 plot (Fig. 5). Thus, the order of the slope values was: Co3O4–CuNF/Pt (d) > CuNFs/Pt (b) > Co3O4/Pt (c) > Pt (a), i.e. Co3O4–CuNF/Pt has the largest A value, and thus, this modified electrode showed the best electrochemical activity.
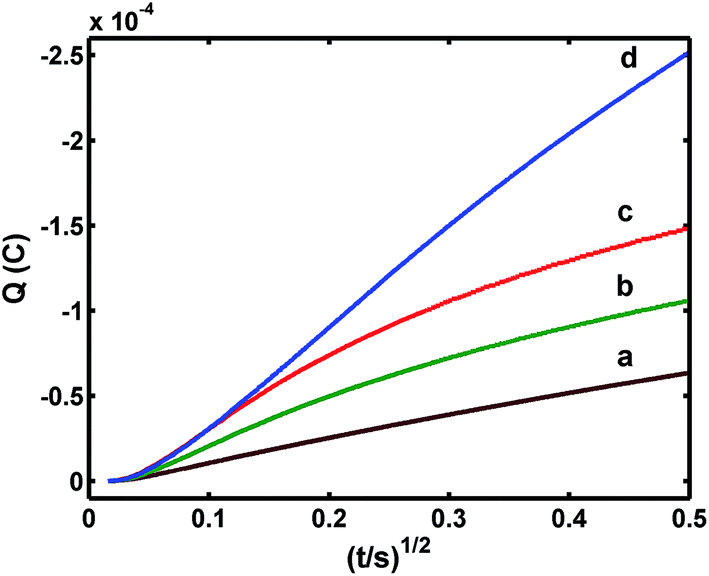 | ||
| Fig. 5 Chronocoulometric plots from: (a) Pt, (b) Co3O4/Pt, (c) CuNPs/Pt, and (d) Co3O4–CuNFs/Pt in 5 × 10⁻³ mol L−1 [Fe(CN)6]3−/4− (1:1) solution containing 0.1 M KCl. | ||
3.4. Quantitative analysis of glucose
Quantitative analysis of glucose was performed with the use of amperometric (i–t) technique under optimal experimental conditions (applied potential: +0.5 V; supporting electrolyte: 0.1 M NaOH). The plot of current difference versus concentration of glucose was linear in the range of 0.5–336 μM, with a linear correlation coefficient (R2) of 0.9989 and limit of detection (LOD) of 0.43 μM (Fig. 6A). When linear range was reduced to 0.5–76.5 μM, the obtained R2 and LOD totalled 0.9997 and 0.17 μM, respectively (Fig. 6B). Corresponding sensitivity of glucose sensor measured 3.58 × 10⁴ and 4.03 × 10⁴ μA μM−1 cm−2. For analysis of glucose described in this work, performance of this method is comparable with other available methods when comparison is based on Co3O4-related electrode materials, analytical range, sensitivity and LOD values (see Table 2).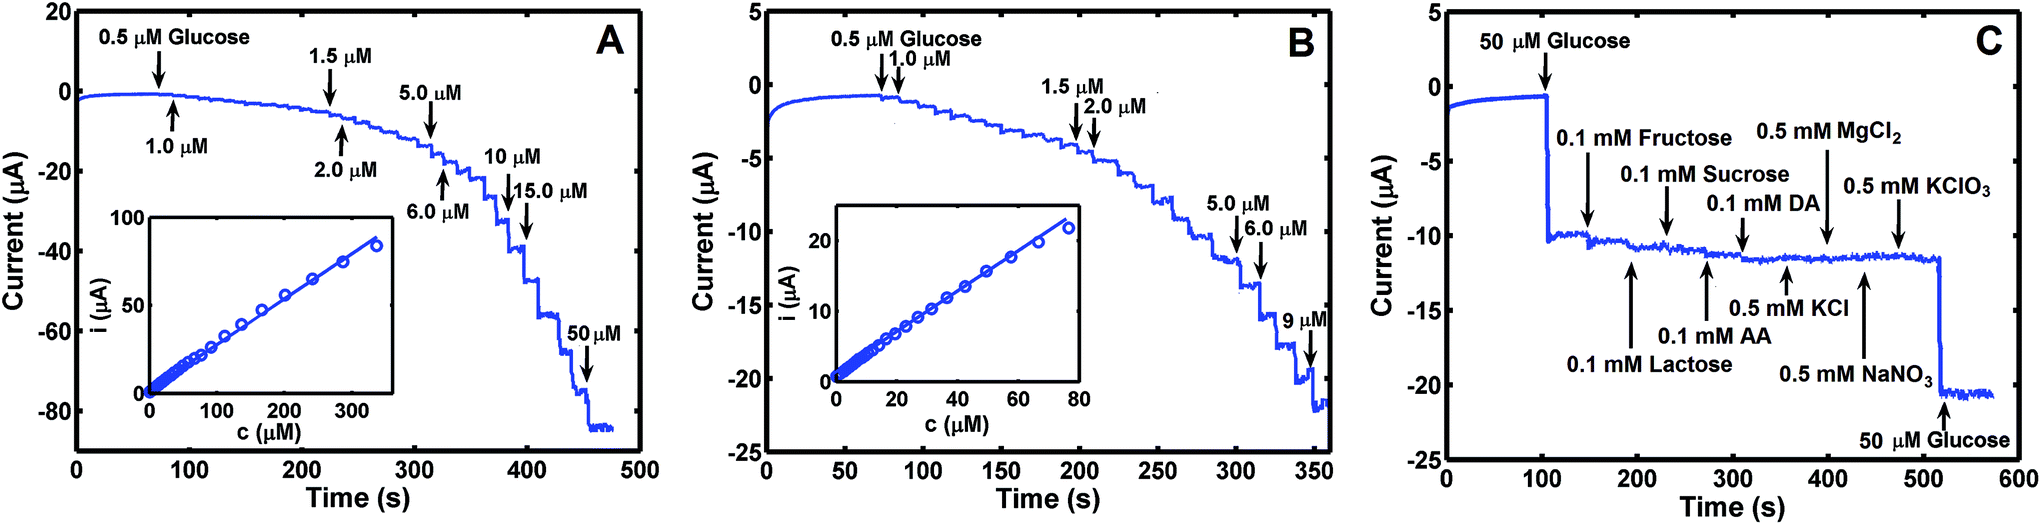 | ||
| Fig. 6 Amperometric response (A and B) of Co3O4–CuNPs/Pt after successive additions of glucose to 0.1 M NaOH at +0.50 V. Inset: calibration plot; amperometric response of CuNFs–MoS2/GCE to different chemicals at +0.50 V (C). | ||
| Electrode materials | Linear range (μM) | Limit of detection (μM) | Sensitivity (μA mM−1 cm−2) | Ref. |
|---|---|---|---|---|
| Co3O4 UNS–Ni(OH)2 | 5–40 | 1.08 | 2000 | 26 |
| Co3O4 | 1–500 | 1 | 366.03 | 37 |
| Co3O4–HND | 2.0–6060 | 0.58 | 708.4 | 38 |
| Cu2O NCs–Co3O4NHs | 1–5330 | 0.63 | 280 | 39 |
| TiO2/Co3O4 ANTAs | 3000 | 0.34 | 2008.82 | 40 |
| Co3O4–gold | 0.1–12000 |
0.0265 | 45.8 | 41 |
| Co3O4–OMC | 10–800 | 1.0 | 2597.5 | 42 |
| Co3O4/MWCN | 50–12000 |
10.42 | 5089.1 | 43 |
| NaCoPO4–Co3O4 | 1.0–150 | 0.125 | — | 44 |
| Co3O4–CuNPs | 0.5–336 | 0.43 | 35800 |
This work |
| 0.5–76.5 | 0.17 | 40300 |
3.5. Interferences, reproducibility and stability
Anti-interference capacity of this method was investigated using Co3O4–CuNPs/Pt under the same experimental conditions described above, and different common interfering substances were used, e.g., fructose, sucrose, lactose, dopamine, ascorbic acid, MgCl2, KClO3 and NaNO3. Current versus time (i–t) plot (Fig. 6C) indicate that these substances produced little interference during analysis of glucose, i.e., the sensor constructed for this work was selective for sensing glucose in the presence of different interfering substances noted above.To estimate reproducibility and stability of sensor, Co3O4–CuNPs/Pt was constructed separately five times with the use of the same Pt electrode. The same concentration of glucose solution (50.0 μM) was used as test sample, and results were recorded. Average relative standard deviation (%RSD) was evaluated as 5.03% from the five measurement results, which indicated satisfactory reproducibility of the sensor. Sensor stability was estimated by detecting glucose after it was stored at 4 °C for 30 days, and current intensity for glucose decreased by only 5.8% compared with the original response on glucose sample of 50.0 μM. Results suggest stability of Co3O4–CuNPs/Pt sensor.
3.6. Analytical applications
The sensor was applied to analyse glucose levels in human serum.36 Before the experiment, pre-processed blood samples was 20-fold diluted with 0.1 M NaOH. Above pre-processed blood samples (0.4 mL) were transferred to an electrochemical cell and diluted to 10.0 mL with 0.1 M NaOH. Each blood sample was spiked with standard glucose solutions. Then, the proposed method was applied to monitor levels of glucose, and corresponding results (Table 1) showed that the sensor yielded relatively acceptable percentage recoveries, indicating that the proposed method may possess potential for practical applications.4. Conclusions
A highly sensitive and selective non-enzymatic electrochemical glucose sensor, Co3O4–CuNPs/Pt, was successfully constructed to detect glucose at low concentration levels. The sensor achieved highly sensitive and stable glucose detection, and this result maybe due to synergistic catalytic effects of Co3O4 and CuNPs. Such nano-composites generally possess a large specific surface area, effectively supporting a large number of electroactive substances, and thus significantly enhancing proton and electron transfer. To test practical application of this sensor, it was used to monitor trace amounts of glucose in human serum samples. Significantly, results also showed that the sensor achieved relatively acceptable percentage recoveries, indicating that the proposed method may feature potential practical applications.Conflicts of interest
There are no conflicts to declare.Acknowledgements
The authors gratefully acknowledge the financial support of this study by the National Natural Science Foundation of China (NSFC-31401587), the Natural Science Foundation of Jiangxi Province (20142BAB213009), and the State Key Laboratory of Food Science and Technology of Nanchang University (SKLF-ZZA 201612).References
- H. F. Bunn and P. J. Higgins, Science, 1981, 231, 222–224 Search PubMed.
- N. Sarwar, P. Gao, S. R. K. Seshasai, R. Gobin, S. Kaptoge, E. Di Angelantonio, E. Ingelsson, D. A. Lawlor, E. Selvin, M. Stampfer, C. D. A. Stehouwer, S. Lewington, L. Pennells, A. Thompson, N. Sattar, I. R. White, K. K. Ray and J. Danesh, Lancet, 2010, 375, 2215–2222 CrossRef CAS.
- M. Y. Wu, S. J. Meng, Q. Wang, W. L. Si, W. Huang and X. C. Dong, ACS Appl. Mater. Interfaces, 2015, 7, 21089–21094 CAS.
- X. Y. Lin, Y. N. Ni and S. Kokot, Biosens. Bioelectron., 2016, 79, 685–692 CrossRef CAS PubMed.
- H. Min, W. Q. Wu, H. M. Wu, S. F. Wang, C. Q. Feng and Y. Ding, Electroanalysis, 2017, 29, 730–738 CrossRef CAS.
- T. Wang, Y. A. Yu, H. F. Tian and J. B. Hu, Electroanalysis, 2014, 26, 2693–2700 CrossRef CAS.
- R. Wilson and A. P. F. Turner, Biosens. Bioelectron., 1992, 7, 165–185 CrossRef CAS.
- C. M. Wong, K. H. Wong and X. D. Chen, Appl. Microbiol. Biotechnol., 2008, 78, 927–938 CrossRef CAS PubMed.
- X. Y. Lin, Y. N. Ni and S. Kokot, Sens. Actuators, B, 2016, 233, 100–106 CrossRef CAS.
- J. S. Mu, Y. Wang, M. Zhao and L. Zhang, Chem. Commun., 2012, 48, 2540–2542 RSC.
- L. Wang, X. P. Lu, C. J. Wen, Y. Z. Xie, L. F. Miao, S. H. Chen, H. B. Li, P. Li and Y. H. Song, J. Mater. Chem. A, 2015, 2, 608–616 Search PubMed.
- M. L. Xu, Y. H. Song, Y. H. Ye, C. C. Gong, Y. Shen, L. Y. Wang and L. Wang, Sens. Actuators, B, 2017, 252, 1187–1193 CrossRef CAS.
- L. Wang, J. Yu, Y. Y. Zhang, H. Yang, L. F. Miao and Y. H. Song, ACS Appl. Mater. Interfaces, 2017, 9(10), 9089–9095 CAS.
- X. H. Niu, X. Li, J. M. Pan, Y. F. He, F. X. Qiu and Y. S. Yan, RSC Adv., 2016, 88, 84893–84905 RSC.
- X. H. Niu, J. M. Pan, F. X. Qiu, X. Li, Y. S. Yan, L. B. Shi, H. L. Zhao and M. B. Lan, Talanta, 2016, 161, 615–622 CrossRef CAS PubMed.
- X. H. Niu, Y. X. Li, J. Tang, Y. L. Hu, H. L. Zhao and M. B. Lan, Biosens. Bioelectron., 2014, 51, 22–28 CrossRef CAS PubMed.
- X. H. Niu, M. B. Lan, H. L. Zhao and C. Chen, Anal. Chem., 2013, 85, 3561–3569 CrossRef CAS PubMed.
- L. T. Hoa, K. G. Sun and S. H. Hur, Sens. Actuators, B, 2015, 210, 618–623 CrossRef CAS.
- H. Li, C. Y. Guo and C. L. Xu, Biosens. Bioelectron., 2015, 63, 339–346 CrossRef CAS PubMed.
- W. N. Xu, S. G. Dai, X. Wang, X. M. He, M. J. Wang, Y. Xi and C. G. Hu, J. Mater. Chem. B, 2015, 3, 5777–5785 RSC.
- C. Y. Zhou, L. Xu, J. Song, R. Q. Xing, S. Xu, D. L. Liu and H. W. Song, Sci. Rep., 2014, 4, 7328 Search PubMed.
- S. J. Wang and B. P. Zhang, Appl. Catal., A, 2013, 467, 585–592 CrossRef CAS.
- J. H. Jiang, W. D. Shi, S. Y. Song, Q. L. Hao, W. Q. Fan, X. F. Xia, X. Zhang, Q. Wang, C. B. Liu and D. Yan, J. Power Sources, 2014, 248, 1281–1289 CrossRef CAS.
- Y. H. Dou, J. T. Xu, B. Y. Ruan, Q. N. Liu, Y. D. Pan, Z. Q. Sun and S. X. Dou, Adv. Energy Mater., 2016, 6, 1501835 CrossRef.
- C. S. Yan, G. Chen, X. Zhou, J. X. Sun and C. D. Lv, Adv. Funct. Mater., 2016, 26, 1428–1436 CrossRef CAS.
- Z. F. Gao, L. Q. Zhang, C. Ma, Q. D. Zhou, Y. S. Tang, Z. Q. Tu, W. Yang, L. S. Cui and Y. F. Li, Biosens. Bioelectron., 2016, 80, 511–518 CrossRef CAS PubMed.
- L. Q. Zhang, Z. F. Gao, C. Liu, Y. H. Zhang, Z. Q. Tu, X. P. Yang, F. Yang, Z. Wen, L. P. Zhu, R. Liu, Y. F. Li and L. S. Cui, J. Mater. Chem. A, 2015, 3, 2794–2801 CAS.
- B. B. Wang, G. Wang and H. Wang, Mater. Lett., 2014, 122, 186–189 CrossRef CAS.
- P. Deka, R. Choudhury, R. C. Deka and P. Bharali, RSC Adv., 2016, 6, 71517–71528 RSC.
- H. Pang, B. Li, Q. X. Zhao, W. Y. Lai and W. Huang, J. Mater. Chem. A, 2016, 4, 4840–4847 CAS.
- J. Li, G. Z. Lu, G. S. Wu, D. S. Mao, Y. L. Guo, Y. Q. Wang and Y. Guo, Catal. Sci. Technol., 2014, 4, 1268–1275 CAS.
- S. J. Deng, N. Chen, D. Y. Deng, Y. X. Li, X. X. Xing and Y. D. Wang, Ceram. Int., 2015, 41, 11004–11012 CrossRef CAS.
- H. Aono, E. Traversa, M. Sakamoto and Y. Sadaoka, Sens. Actuators, B, 2003, 94, 132–139 CrossRef CAS.
- L. Wang, Q. Y. Zhang, S. L. Chen, F. G. Xu, S. H. Chen, J. B. Jia, H. L. Tan, H. Q. Hou and Y. H. Song, Anal. Chem., 2014, 86, 1414–1421 CrossRef CAS PubMed.
- K. E. Toghill and R. G. Compton, Int. J. Electrochem. Sci., 2010, 5, 1246–1301 CAS.
- X. Zhong, R. Yuan and Y. Q. Chai, Chem. Commun., 2012, 48, 597–599 RSC.
- S. S. Fan, M. G. Zhao, L. J. Ding, J. J. Liang, J. Chen, Y. C. Li and S. G. Chen, J. Electroanal. Chem., 2016, 775, 52–57 CrossRef CAS.
- E. H. Zhang, Y. Xie, S. Q. Ci, J. C. Jia and Z. H. Wen, Biosens. Bioelectron., 2016, 81, 46–53 CrossRef CAS PubMed.
- S. Velmurgan, R. Devasenathipathy, S. M. Chen and S. F. Wang, Electroanalysis, 2016, 28, 1547–1552 CrossRef CAS.
- M. R. Mahmoudian, W. J. Basirun, P. M. Woi, M. Sookhakian, R. Yousefi, H. Ghadimi and Y. Alias, Mater. Sci. Eng., C, 2016, 59, 500–508 CrossRef CAS PubMed.
- K. Khun, Z. H. Ibupoto, X. Liu, V. Beni and M. Wilander, Mater. Sci. Eng., B, 2015, 194, 94–100 CrossRef CAS.
- M. Li, C. Han, Y. F. Zhang, X. J. Bo and L. P. Guo, Anal. Chim. Acta, 2015, 861, 25–35 CrossRef CAS PubMed.
- R. Prasad and B. R. Bhat, New J. Chem., 2015, 39, 9735–9742 RSC.
- C. Z. Wei, C. Cheng, J. H. Zhao, X. Yuan, T. T. Wu, Y. Wang, W. M. Du and H. Pang, CrystEngComm, 2015, 17, 4540–4546 RSC.
| This journal is © The Royal Society of Chemistry 2017 |