 Open Access Article
Creative Commons Attribution 3.0 Unported Licence
Electrochemical promotion of catalysis over Pd nanoparticles for CO2 reduction†
Fan
Cai
ac,
Dunfeng
Gao
a,
Hu
Zhou
b,
Guoxiong
Wang
*a,
Ting
He
ac,
Huimin
Gong
a,
Shu
Miao
a,
Fan
Yang
 a,
Jianguo
Wang
b and
Xinhe
Bao
 *a
*a
aState Key Laboratory of Catalysis, CAS Center for Excellence in Nanoscience, Dalian Institute of Chemical Physics, Chinese Academy of Sciences, 116023, Dalian, China. E-mail: wanggx@dicp.ac.cn; xhbao@dicp.ac.cn
bCollege of Chemical Engineering, Zhejiang University of Technology, 310032, Hangzhou, China
cUniversity of Chinese Academy of Sciences, 100039, Beijing, China
First published on 3rd January 2017
Abstract
Electrochemical promotion of catalysis (EPOC) has been shown to accelerate the rate of many heterogeneous catalytic reactions; however, it has rarely been reported in low-temperature aqueous electrochemical reactions. Herein, we report a significant EPOC effect for the CO2 reduction to generate formate over Pd nanoparticles (NPs) in a 1 M KHCO3 aqueous solution. By applying a negative potential over differently-sized Pd NPs, the rate of formate production is greatly improved as compared to that at an open-circuit voltage, with a rate enhancement ratio ranging from 10 to 143. The thermocatalytic and electrocatalytic reduction of CO2 compete with each other and are promoted by the applied negative potential and H2 in the feeds, respectively. Inspired by the EPOC effect, a composite electrode containing Pd/C and Pt/C catalysts on different sides of a carbon paper was constructed for catalyzing the CO2 reduction without adding H2 to the feeds. Water electrolysis over Pt NPs generates H2, which then effectively promotes formate production over Pd NPs.
Introduction
Electrochemical promotion of catalysis (EPOC), discovered by M. Stoukides and C. Vayenas in the 1980s,1,2 has been widely investigated in more than 100 heterogeneous catalytic reactions3–6 on either metal or metal oxide surfaces, which are interfaced with a solid7 or an aqueous electrolyte solution.8–14 By applying an electrical current between the working electrode, coated with catalyst, and the counter electrode, the electronic properties of the supported catalyst can be tuned, accompanied by the alteration in the adsorption strength of the reactants, and in some cases, a significant enhancement in the catalytic performance can be observed. To date, only a few reports have demonstrated the EPOC effect in an aqueous electrolyte solution at ambient temperature for reactions such as the H2 oxidation,8,9 hydrocarbon isomerization,10,11 CO oxidation,12,13 and hydrazine oxidation.14 Herein, we report that the EPOC effect can also be observed for electrochemical reduction reactions such as the reduction of CO2 in an aqueous electrolyte solution at ambient temperature.The reduction of carbon dioxide to produce formic acid is an attractive route to store renewable electricity and an important strategy for the utilization of carbon cycle.7,15–19 However, CO2 is thermodynamically stable and notoriously unreactive; therefore, high reaction temperatures7,20–23 and high overpotentials24–27 are usually essential to activate and transform CO2 during thermocatalysis and electrocatalysis. Herein, we report a significant EPOC effect for the CO2 reduction to produce formate over Pd nanoparticles (NPs) in a 1 M KHCO3 aqueous solution at ambient temperature. Thermocatalytic and electrocatalytic reduction of CO2 over Pd nanoparticles (NPs) occur simultaneously and compete with each other, which are promoted by the applied negative potential and H2 in the feeds, respectively. The shared reaction intermediate, namely HCOO*, is formed over the Pd NPs and is proposed as the origin of the EPOC effect during the thermocatalytic and electrocatalytic reduction of CO2. Inspired by the EPOC effect, a Pd/C–Pt/C composite electrode was constructed for the CO2 reduction, such that the addition of H2 to the feeds could be avoided. H2 generated from the electrolysis of water over Pt NPs effectively promotes formate production over Pd NPs.
Results and discussion
Carbon-supported Pd NPs were prepared using sodium citrate as a stabilizing agent and NaBH4 as a reducing agent.28 Each sample was named on the basis of the average size of Pd NPs present in it, such as 3.7 nm Pd indicates that Pd NPs in the Pd/C catalyst have an average particle size of 3.7 nm (Fig. S1†). The catalyst ink, containing Pd/C and Nafion ionomer, was deposited on a piece of carbon paper (Toray TGP-H-060) with a microporous layer and dried to serve as a porous electrode for CO2 reduction in a 20% H2/CO2-saturated 1 M KHCO3 solution. To quantify the EPOC effect, the rate enhancement ratio was defined as follows:3| ρ = r/r0 | (1) |
 | (2) |
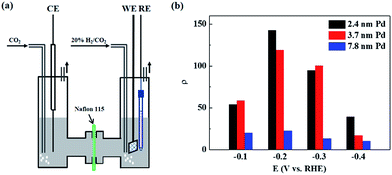
CO2 reduction experiments were conducted in an H-cell, as shown in Fig. 1a. The porous electrode coated with Pd/C catalyst was immersed in a 1 M KHCO3 aqueous solution, and 20% H2/CO2 was fed into the cathode chamber for the CO2 reduction reaction at OCV and different negative potentials. The maximum temperature increment of the electrolyte solution was 0.8 °C during the constant-potential electrolysis for 1 h, and the effect of temperature on the formate production rate at OCV and different negative potentials can be ignored. Fig. 1b shows the rate enhancement ratio for the formate production at different negative potentials compared to that at OCV over differently-sized Pd NPs. There are volcano-like curves for the value of ρ over differently-sized Pd NPs within the studied potential range. The value of ρ is 54 over 2.4 nm Pd at −0.1 V and reaches the maximum value of 143 at −0.2 V. Further negatively shifting the potential to −0.3 V and −0.4 V would decrease the rate enhancement ratio to 95 and 39, respectively. The ratio over 3.7 nm Pd increases from 58 to 119 when the potential is shifted from −0.1 V to −0.2 V and drops to 100 and 17 at −0.3 V and −0.4 V, respectively. The ratio over 7.8 nm Pd is obviously smaller than that over 2.4 nm Pd and 3.7 nm Pd, and the maximum ratio over 7.8 nm Pd is 23 at −0.2 V. The reaction of adsorbed hydrogen on Pd hydride surface with CO2 to form adsorbed HCOO* is considered as the rate-determining step for CO2 reduction.16 Upon negatively shifting the potential from −0.1 V to −0.4 V, the hydrogen adsorption strength on the Pd hydride surface is weakened due to a favored hydrogen evolution reaction. Therefore, the optimum adsorption strength for surface-adsorbed hydrogen to react with CO2 occurs at −0.2 V, resulting in the highest ρ value. Since small-sized Pd NPs prefer to adsorb more hydrogen over coordinatively unsaturated sites,29 the ρ value is much higher over 2.4 nm Pd as compared to that over 3.7 nm Pd and 7.8 nm Pd at −0.4 V.
To investigate the origin of the EPOC effect during CO2 reduction, an isotope-labeling experiment was conducted by replacing 20% H2/CO2 with 20% D2/CO2, and the products were analyzed by nuclear magnetic resonance (NMR) spectroscopy. PdDx could also be generated under D2 atmosphere, and the properties of PdDx were close to those of PdHx; thus, it was suggested that the electrochemical measurements under 20% D2/CO2 atmosphere were comparable to those under 20% H2/CO2 atmosphere.30–32 HCOO− and DCOO− were quantified by 1H-NMR and 2H-NMR spectra, respectively. The amount of D2O and HDO in the electrolyte solution after constant-potential electrolysis at −0.2 V for 1 h was also quantified by 2H-NMR spectra, which is 0.028%, whereas the natural abundance of D is about 0.015%.33 Therefore, non-electrochemical exchange between adsorbed D and H+ could be ignored,34 and DCOO− and HCOO− were considered to be produced from the CO2 + D2 thermocatalytic reaction and CO2 electrocatalytic reaction, respectively. Fig. 2 shows the percentage of HCOO− and DCOO− formed over 3.7 nm Pd at different negative potentials. The percentage of DCOO− is higher than that of HCOO− at −0.1 V and −0.2 V, which sharply decreases at −0.3 V and reaches below the detection limit at −0.4 V. Thus, the thermocatalytic and electrocatalytic reduction of CO2 occur simultaneously and compete with each other when applying negative potentials over Pd NPs.
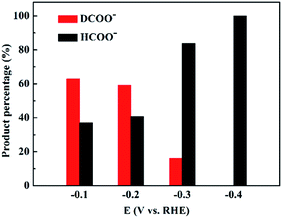 | ||
| Fig. 2 HCOO− and DCOO− percentages for the CO2 reduction over 3.7 nm Pd at different negative potentials in 20% D2/CO2-saturated 1 M KHCO3 solution. | ||
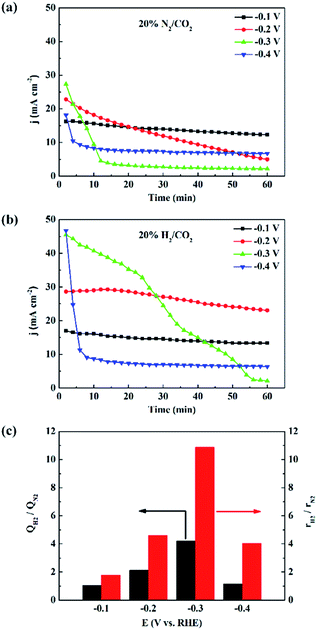
We also measured the electrocatalytic reduction of CO2 without adding H2 to the feeds. As shown in Fig. 3, S2 and S3,† the current density becomes unstable at negatively shifted potentials, which is caused by poisoning from trace CO, a minor side product from the CO2 electroreduction.16,35–37 With the addition of H2, the stability of current density increases, indicating that the electrocatalytic reduction of CO2 is stabilized. X-ray diffraction (XRD) patterns, of 3.7 nm Pd under different atmosphere were obtained to investigate the active phase of Pd NPs, as shown in Fig. S4.† XRD pattern of 3.7 nm Pd under 20% N2/CO2 atmosphere matches well with that of Pd (JCPDS 46-1043), and the diffraction peak of the Pd (111) plane is located at 39.9°. When the atmosphere is switched to 20% H2/CO2, the diffraction peak of the Pd (111) plane quickly shifts to 38.8°, accompanied by a shift in all the other peaks. The pattern is consistent with that of PdH0.706 (JCPDS 18-0951), which is facilely generated under H2 atmosphere. Since the state and structure of the supported Pd NPs are not affected by water,38 the PdHx active phase is expected to be stable in 20% H2/CO2-saturated 1 M KHCO3 solution.
Fig. 3c shows the electric charge ratios over 3.7 nm Pd at various potentials, calculated from the I–t plots, in Fig. 3a and b. At −0.1 V, the electric charge does not change over Pd NPs because surface PdHx is stable and the rate of proton reduction can meet the requirement for the CO2 electroreduction. At −0.2 V, CO2 electroreduction is accelerated, and the rate of proton reduction cannot match the rate of CO2 electroreduction, resulting in a decrease of current density. The enhancement of the electric charge ratio is the highest at −0.3 V since the addition of H2 effectively stabilizes surface PdHx that tends to decompose through hydrogen evolution. This enhancement of electric charge ratio indicates that the electrocatalysis is to some extent also promoted by H2 in the feeds, which has not been reported earlier.
The rate of formate production was enhanced when the reaction atmosphere was changed from 20% N2/CO2 to 20% H2/CO2. Fig. 3c shows the enhancement ratio of rH2/rN2 over 3.7 nm Pd at different negative potentials, where rH2 and rN2 represent the formate production rates in 20% H2/CO2 and 20% N2/CO2-saturated electrolyte solutions, respectively. The enhancement ratio of formate production rates is higher than that of electric charge accumulated in 1 h. For instance, rH2 at −0.2 V reaches about 1.9 molformate mgPd−1 h−1, and rH2/rN2 is more than twice that of QH2/QN2. The additional improvement is considered as a contribution from the thermocatalytic reaction,39 also identified in the isotope labeling experiment. The significant potential dependence of the rH2/rN2 and QH2/QN2 values over 3.7 nm Pd is attributed to the instability of Pd hydride and CO poisoning at more negative potentials during the electrocatalytic reduction of CO2. Similar enhancement effects over 2.4 nm and 7.8 nm Pd are shown in Fig. S2 and S3.† Since the strong hydrogen adsorption on small-sized Pd NPs could stabilize the surface Pd hydride, the current densities over 2.4 nm Pd were more stable than those over 3.7 nm Pd (Fig. 3 and S2†). Therefore, the rH2/rN2 and QH2/QN2 values over 2.4 nm Pd are smaller than those over 3.7 nm Pd. The lack of potential dependence of rH2/rN2 and QH2/QN2 over 7.8 nm Pd indicates that surface Pd hydride is difficult to form over large-sized Pd NPs, as also confirmed by the unstable current densities shown in Fig. S3.†
Based on the abovementioned results, thermocatalytic and electrocatalytic reduction of CO2 occur simultaneously as follows:40–42
(a) Thermocatalytic reduction reaction
| Pd + xH2(g) ↔ H* | (3) |
| CO2(g) + H* ↔ HCOO* | (4) |
| HCOO* + H ↔ HCOOH* | (5) |
| HCOOH* ↔ HCOOH(l) + * | (6) |
(b) Electrocatalytic reduction reaction
| CO2(g) + * + e− + H+(aq.) ↔ HCOO* | (7) |
| HCOO* + e− + H+(aq.) ↔ HCOOH* + H2O(l) | (8) |
| HCOOH* ↔ HCOOH(l) + * | (9) |
Fig. 4 shows the schematic of CO2 + D2 reduction over Pd NPs. D2 is split into D atoms on the surface of Pd NPs, which subsequently diffuse into the Pd lattice to form the PdDx phase. The atomic D on the PdDx surface, derived from D2 dissociation, reacts with CO2 to form DCOO−via the thermocatalytic pathway, whereas H+ in water reacts with CO2 to form HCOO−via the electrocatalytic pathway. At −0.1 V and −0.2 V, the electrocatalytic reduction rate is constrained due to the low overpotentials and the percentage of HCOO− is lower than that of DCOO−. Upon increasing the overpotential, the electrocatalytic reduction rate is accelerated, exceeding the thermocatalytic rate, and thus the electrocatalytic reduction pathway dominates for CO2 reduction at −0.4 V (Fig. 2).
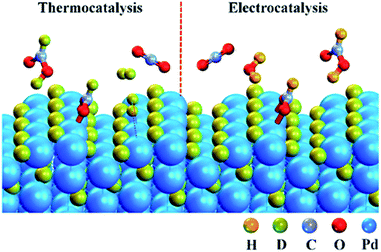 | ||
| Fig. 4 Schematic of heterogeneous thermocatalytic (left) and electrocatalytic (right) reduction of CO2 over Pd NPs conducted in a CO2 + D2 atmosphere. | ||
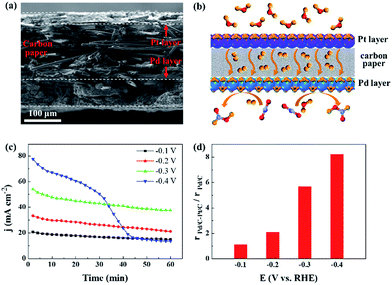
H2 generated from the electrolysis of water is promising for practical applications in CO2 reduction. Within the potential range for the CO2 reduction via CO2 + H2 reaction, the hydrogen evolution reaction can occur over Pt NPs, which would provide H2 by the electrolysis of water at the same negative potentials.43,44 We designed a composite electrode in which 3.7 nm Pd was deposited on the microporous layer, whereas commercial Pt/C catalyst was deposited on the other side of the carbon paper. The cross-sectional scanning electron microscopy (SEM) image and corresponding energy-dispersive X-ray spectroscopy mapping image of the electrode are shown in Fig. 5a and S5.† As illustrated in Fig. 5b, the Pt/C and Pd/C catalyst layers are separated by the carbon paper with a microporous layer, and H2 generated over Pt NPs diffuses across the carbon paper or the electrolyte solution towards the Pd NPs, which promotes the thermocatalytic and electrocatalytic reduction of CO2 over Pd NPs. The current density is clearly improved and stabilized after depositing Pt/C catalyst on the opposite side of the Pd/C catalyst layer (Fig. 3a and 5c). The activity and selectivity of the Pt/C electrode, used as a control in this study, were also measured, and only H2 was produced (Fig. S6†). The enhancement ratio for formate production with the Pd/C–Pt/C composite electrode is shown in Fig. 5d. The maximum value reaches 8.2 at −0.4 V as a result of the combination of thermocatalytic and electrocatalytic reduction of CO2.
Conclusions
In summary, a significant EPOC effect was observed over Pd NPs during CO2 reduction to generate formate in 1 M KHCO3 solution at ambient temperature. Both thermocatalytic and electrocatalytic reduction of CO2 over Pd NPs were promoted by applying negative potentials and by adding H2 to the feeds, respectively. The shared reaction intermediate HCOO* over Pd NPs was proposed as the origin of the EPOC effect during the thermocatalytic and electrocatalytic reduction of CO2. Based on the abovementioned understanding, the Pd/C–Pt/C composite electrode was constructed for CO2 reduction without the direct addition of H2 to the feeds. H2 generated through water electrolysis over Pt NPs effectively promoted the formate production over Pd NPs. The significant rate enhancement ratio for CO2 reduction not only reveals a new example of EPOC in a low-temperature aqueous electrochemical reaction, but also provides an alternative strategy to promote the electrocatalytic reduction of CO2.Acknowledgements
We gratefully acknowledge the financial support received from the Ministry of Science and Technology of China (Grants 2016YFB0600901 and 2013CB933100), the National Natural Science Foundation of China (Grants 21573222 and 91545202), and the Strategic Priority Research Program of the Chinese Academy of Sciences (Grant No. XDB17020200). G. X. Wang would also like to thank the financial support received from CAS Youth Innovation Promotion.References
- M. Stoukides and C. G. Vayenas, J. Catal., 1981, 70, 137–146 CrossRef CAS
.
- C. G. Vayenas, S. Bebelis and S. Ladas, Nature, 1990, 343, 625–627 CrossRef CAS
.
- C. G. Vayenas and C. G. Koutsodontis, J. Chem. Phys., 2008, 128, 182506 CrossRef PubMed
.
- C. G. Vayenas, Catal. Lett., 2013, 143, 1085–1097 CrossRef CAS
.
- P. Vernoux, L. Lizarraga, M. N. Tsampas, F. M. Sapountzi, A. De Lucas-Consuegra, J. L. Valverde, S. Souentie, C. G. Vayenas, D. Tsiplakides, S. Balomenou and E. A. Baranova, Chem. Rev., 2013, 113, 8192–8260 CrossRef CAS PubMed
.
- C. G. Vayenas and S. Brosda, Top. Catal., 2014, 57, 1287–1301 CrossRef CAS
.
- D. Theleritis, S. Souentie, A. Siokou, A. Katsaounis and C. G. Vayenas, ACS Catal., 2012, 2, 770–780 CrossRef CAS
.
- S. G. Neophytides, D. Tsiplakides, P. Sronehart, M. M. Jaksic and C. G. Vayenas, Nature, 1994, 370, 45–47 CrossRef CAS
.
- S. G. Neophytides, D. Tsiplakides, P. Stonehart, M. Jaksic and C. G. Vayenas, J. Phys. Chem., 1996, 100, 14803–14814 CrossRef CAS
.
- M. Salazar and E. S. Smotkin, J. Appl. Electrochem., 2006, 36, 1237–1240 CrossRef CAS
.
- L. Ploense, M. Salazar, B. Gurau and E. S. Smotkin, J. Am. Chem. Soc., 1997, 119, 11550–11551 CrossRef CAS
.
- F. M. Sapountzi, M. N. Tsampas and C. G. Vayenas, Catal. Today, 2007, 127, 295–303 CrossRef CAS
.
- F. M. Sapountzi, M. N. Tsampas and C. G. Vayenas, Catal. Today, 2009, 146, 319–325 CrossRef CAS
.
- J. Sanabria-Chinchilla, K. Asazawa, T. Sakamoto, K. Yamada, H. Tanaka and P. Strasser, J. Am. Chem. Soc., 2011, 133, 5425–5431 CrossRef CAS PubMed
.
- S. Gao, Y. Lin, X. C. Jiao, Y. F. Sun, Q. Q. Luo, W. H. Zhang, D. Q. Li, J. L. Yang and Y. Xie, Nature, 2016, 529, 68–71 CrossRef CAS PubMed
.
- X. Min and M. W. Kanan, J. Am. Chem. Soc., 2015, 137, 4701–4708 CrossRef CAS PubMed
.
- R. Kortlever, I. Peters, S. Koper and M. T. M. Koper, ACS Catal., 2015, 5, 3916–3923 CrossRef CAS
.
- Y. H. Chen and M. W. Kanan, J. Am. Chem. Soc., 2012, 134, 1986–1989 CrossRef CAS PubMed
.
- S. Zhang, P. Kang and T. J. Meyer, J. Am. Chem. Soc., 2014, 136, 1734–1737 CrossRef CAS PubMed
.
- W. C. Chueh, C. Falter, M. Abbott, D. Scipio, P. Furler, S. M. Haile and A. Steinfeld, Science, 2010, 330, 1797–1801 CrossRef CAS PubMed
.
- M. D. Porosoff, M. N. Myint, S. Kattel, Z. Xie, E. Gomez, P. Liu and J. G. Chen, Angew. Chem., Int. Ed., 2015, 54, 15501–15505 CrossRef CAS PubMed
.
- Z. H. He, Q. L. Qian, J. Ma, Q. L. Meng, H. C. Zhou, J. L. Song, Z. M. Liu and B. X. Han, Angew. Chem., Int. Ed., 2016, 55, 737–741 CrossRef CAS PubMed
.
- S. Kattel, W. Yu, X. Yang, B. Yan, Y. Huang, W. Wan, P. Liu and J. G. Chen, Angew. Chem., Int. Ed., 2016, 55, 7968–7973 CrossRef CAS PubMed
.
- M. Liu, Y. Pang, B. Zhang, P. De Luna, O. Voznyy, J. Xu, X. Zheng, C. T. Dinh, F. Fan, C. Cao, F. P. de Arquer, T. S. Safaei, A. Mepham, A. Klinkova, E. Kumacheva, T. Filleter, D. Sinton, S. O. Kelley and E. H. Sargent, Nature, 2016, 537, 382–386 CrossRef CAS PubMed
.
- M. Asadi, K. Kim, C. Liu, A. V. Addepalli, P. Abbasi, P. Yasaei, P. Phillips, A. Behranginia, J. M. Cerrato, R. Haasch, P. Zapol, B. Kumar, R. F. Klie, J. Abiade, L. A. Curtiss and A. Salehi-Khojin, Science, 2016, 353, 467–470 CrossRef CAS PubMed
.
- S. Lin, C. S. Diercks, Y. B. Zhang, N. Kornienko, E. M. Nichols, Y. B. Zhao, A. R. Paris, D. Kim, P. Yang, O. M. Yaghi and C. J. Chang, Science, 2015, 349, 1208–1213 CrossRef CAS PubMed
.
- B. A. Rosen, A. Salehi-Khojin, M. R. Thorson, W. Zhu, D. T. Whipple, P. J. A. Kenis and R. I. Masel, Science, 2011, 334, 643–644 CrossRef CAS PubMed
.
- D. F. Gao, H. Zhou, J. Wang, S. Miao, F. Yang, G. X. Wang, J. Wang and X. H. Bao, J. Am. Chem. Soc., 2015, 137, 4288–4291 CrossRef CAS PubMed
.
- M. W. Tew, J. T. Miller and J. A. van Bokhoven, J. Phys. Chem. C, 2009, 113, 15140–15147 CAS
.
- D. L. Knies, V. Violante, K. S. Grabowski, J. Z. Hu, D. D. Dominguez, J. H. He, S. B. Qadri and G. K. Hubler, J. Appl. Phys., 2012, 112, 083510 CrossRef
.
- H. Yoshitake, T. Kikkawa and K.-I. Ota, J. Electroanal. Chem., 1995, 390, 91–97 CrossRef
.
- H. Yoshitake, G. Muto and K.-I. Ota, J. Electroanal. Chem., 1996, 401, 81–87 CrossRef
.
- Z. Serhan, C. Aroulanda and P. Lesot, J. Phys. Chem. A, 2016, 120, 6076–6088 CrossRef CAS PubMed
.
- G. Muto, H. Yoshitake, N. Kamiya and K.-I. Ota, J. Electroanal. Chem., 1998, 457, 99–107 CrossRef CAS
.
- K. Jiang, K. Xu, S. Z. Zou and W. B. Cai, J. Am. Chem. Soc., 2014, 136, 4861–4864 CrossRef CAS PubMed
.
- J. Y. Wang, H. X. Zhang, K. Jiang and W. B. Cai, J. Am. Chem. Soc., 2011, 133, 14876–14879 CrossRef CAS PubMed
.
- H.-X. Zhang, S.-H. Wang, K. Jiang, T. André and W.-B. Cai, J. Power Sources, 2012, 199, 165–169 CrossRef CAS
.
- Z. A. Chase, J. L. Fulton, D. M. Camaioni, D. Mei, M. Balasubramanian, V.-T. Pham, C. Zhao, R. S. Weber, Y. Wang and J. A. Lercher, J. Phys. Chem. C, 2013, 117, 17603–17612 CAS
.
- C. J. Stalder, S. Chao, D. P. Summers and M. S. Wrighton, J. Am. Chem. Soc., 1983, 105, 6318–6320 CrossRef CAS
.
- C. Iwakura, S. Takezawa and H. Inoue, J. Electroanal. Chem., 1998, 459, 167–169 CrossRef CAS
.
- H. Yoshitake, K. Takahashi and K.-I. Ota, J. Chem. Soc., Faraday Trans., 1994, 90, 155–159 RSC
.
- R. Kortlever, J. Shen, K. J. Schouten, F. Calle-Vallejo and M. T. Koper, J. Phys. Chem. Lett., 2015, 6, 4073–4082 CrossRef CAS PubMed
.
- D. F. Gao, J. Wang, H. H. Wu, X. L. Jiang, S. Miao, G. X. Wang and X. H. Bao, Electrochem. Commun., 2015, 55, 1–5 CrossRef CAS
.
- J. Durst, C. Simon, F. Hasche and H. A. Gasteiger, J. Electrochem. Soc., 2014, 162, F190–F203 CrossRef
.
Footnote |
| † Electronic supplementary information (ESI) available. See DOI: 10.1039/c6sc04966d |
| This journal is © The Royal Society of Chemistry 2017 |

