 Open Access Article
Thiophene bridged aldehydes (TBAs) image ALDH activity in cells via modulation of intramolecular charge transfer†
Santanu
Maity
 a,
Corinne M.
Sadlowski‡
 a,
Jung-Ming
George Lin‡
ab,
Che-Hong
Chen‡
c,
Li-Hua
Peng
a,
Eun-Soo
Lee
d,
Giri K.
Vegesna
a,
Charles
Lee
a,
Se-Hwa
Kim
d,
Daria
Mochly-Rosen
c,
Sanjay
Kumar
ab and
Niren
Murthy
*ab
a,
Jung-Ming
George Lin‡
ab,
Che-Hong
Chen‡
c,
Li-Hua
Peng
a,
Eun-Soo
Lee
d,
Giri K.
Vegesna
a,
Charles
Lee
a,
Se-Hwa
Kim
d,
Daria
Mochly-Rosen
c,
Sanjay
Kumar
ab and
Niren
Murthy
*ab
aDepartment of Bioengineering, University of California, 140 Hearst Memorial Mining Building, Berkeley, CA 94720, USA. E-mail: nmurthy@berkeley.edu
bThe UC Berkeley-UCSF Graduate Program in Bioengineering, UC Berkeley, Berkeley, California, USA
cDepartment of Chemical and Systems Biology, Stanford University, School of Medicine, Stanford, CA 94305-5174, USA
dKorea Research Institute of Standards and Science, 267 Gajeong-ro, Yuseong-gu, Daejeon, Republic of Korea
First published on 24th August 2017
Abstract
Aldehyde dehydrogenases (ALDHs) catalyze the oxidation of an aldehyde to a carboxylic acid and are implicated in the etiology of numerous diseases. However, despite their importance, imaging ALDH activity in cells is challenging due to a lack of fluorescent imaging probes. In this report, we present a new family of fluorescent probes composed of an oligothiophene flanked by an aldehyde and an electron donor, termed thiophene-bridged aldehydes (TBAs), which can image ALDH activity in cells. The TBAs image ALDH activity via a fluorescence sensing mechanism based on the modulation of intramolecular charge transfer (ICT) and this enables the TBAs and their ALDH-mediated oxidized products, thiophene-bridged carboxylates (TBCs), to have distinguishable fluorescence spectra. Herein, we show that the TBAs can image ALDH activity in cells via fluorescence microscopy, flow cytometry, and in a plate reader. Using TBA we were able to develop a cell-based high throughput assay for ALDH inhibitors, for the first time, and screened a large, 1460-entry electrophile library against A549 cells. We identified α,β-substituted acrylamides as potent electrophile fragments that can inhibit ALDH activity in cells. These inhibitors sensitized drug-resistant glioblastoma cells to the FDA approved anti-cancer drug, temozolomide. The TBAs have the potential to make the analysis of ALDH activity in cells routinely possible given their ability to spectrally distinguish between an aldehyde and a carboxylic acid.
Introduction
Reactive aldehydes are produced in a wide variety of biochemical pathways, ranging from ethanol metabolism to drug detoxification pathways, and have a profound influence on human physiology and pathology.1,2 Aldehydes are mutagenic and cytotoxic because they form addition products with DNA, proteins, and other macromolecules. Therefore, their over-production is implicated in the etiology of numerous diseases, including cancer, inflammatory diseases, diabetes, cardiac ischemia, stroke, and neurodegenerative diseases.3–21 In addition, reactive aldehydes also play a significant role in inhibiting the development of cancer stem cells and in mediating the toxic effects of cancer chemotherapeutics.Aldehyde dehydrogenases (ALDHs) catalyse the oxidation of an aldehyde into a carboxylic acid and play an essential role in protecting cells against the toxic effects of aldehydes.3,4,9 ALDHs are central regulators of cell physiology, and a wide number of diseases are caused by dysregulation of ALDH activity. For example, the down-regulation of ALDH activity has been implicated in the etiology of numerous inflammatory diseases, such as alcohol induced liver toxicity, cardiac ischemia, and Parkinson’s disease, and in these diseases the up-regulation of ALDH is protective. The over-expression of ALDH activity can also be problematic and is implicated in the development of cancer and cancer drug resistance. In addition, ALDH activity is necessary for the generation of stem cells and is currently one of the most powerful biomarkers for identifying stem cells and cancer stem cells.
There is therefore great interest in understanding the cell biology of ALDHs and also in identifying small molecules that can either up-regulate or down-regulate their activity.17,20,21 For example, the over expression of ALDH1A1 causes drug resistance in triple negative breast cancers and in glioblastomas, and ALDH inhibitors have the potential to significantly improve the efficacy of chemotherapeutics.22–29 Similarly, down-regulation of ALDH activity is implicated in the etiology of numerous inflammatory diseases, and compounds that can up-regulate ALDH expression or its activity have the potential to treat a wide variety diseases, including cardiac ischemia. However, it has been challenging to develop small molecules that can modulate the activity of ALDHs and also to understand the regulation of ALDHs because fluorescent dyes have not been developed that can image ALDH activity in cells via fluorescence microscopy or in a plate reader format. Developing fluorescent dyes that can image ALDH activity has been challenging because ALDHs catalyse the transformation of aldehydes to carboxylic acids, and this conversion is not compatible with conventional fluorescent probe design strategies, such as fragmentation reactions, photo-induced electron transfer (PET), and enhancement of pi-conjugation.30–36
ALDEFLUOR and its derivatives are the only class of fluorescent probe that can image ALDH activity in cells.37 ALDEFLUOR is composed of a BODIPY dye linked to an aldehyde, and is oxidized into a carboxylic acid by cellular ALDHs, which enhances its accumulation within cells, due to the negative charge of the carboxylic acid. ALDEFLUOR has been extensively used to identify stem cells via flow cytometry, and is currently one of the best reagents available for identifying stem cells. However, ALDEFLUOR does not change its fluorescence after ALDH oxidation and consequently generates high levels of background fluorescence, and this significantly limits its potential applications outside of stem cell detection via flow cytometry. For example, ALDEFLUOR is problematic to use for imaging ALDH activity via a fluorescence microscope or via a plate reader, and consequently has not found applications as a reagent for developing ALDH inhibitors or as a tool for understanding the biology of ALDHs. In addition, ALDEFLUOR reacts with all of the ALDHs and lacks isoenzyme specificity.37e
There is therefore considerable interest in developing ALDH probes that change their fluorescence after ALDH oxidation. Modulation of intramolecular charge transfer (ICT) has great potential as a strategy for imaging ALDH activity. Because the emission spectra of fluorophores that generate ICT are very sensitive to changes in electron donating or withdrawing groups. In addition, aldehydes and carboxylic acids have significantly different electron withdrawing strengths, where the aldehyde is a strong electron withdrawer (σ = 0.46) and the carboxylate is a weak electron withdrawer (σ = 0). Modulation of ICT has been used to develop fluorescent probes that can detect ALDH, using a naphthalene-based fluorophore directly conjugated to an aldehyde.38 The naphthaldehydes are ALDH substrates and can distinguish between carboxylic acid and aldehyde groups, due to differences in their electron withdrawing strength. This class of fluorophore was able to measure ALDH activity in blood samples and in saliva, and served as a platform for the development of point of care diagnostics. However, the naphthaldehydes emit in the 380–450 nm range and therefore did not find widespread use as a reagent for imaging ALDH in cell culture, due to the strong background fluorescence signal at these wavelengths. Consequently, there is great interest in developing new ICT based fluorophores that can detect ALDH activity and also emit at wavelengths that are suitable for cell culture imaging, 450–700 nm.
Oligothiophenes have the potential to act as fluorophores that can image ALDH activity in cells, due to their ability to generate ICT in their excited state and their tunable emission wavelengths, which span the 450–700 nm range. In addition, Fin et al. have demonstrated that ICT based oligothiophenes can distinguish between an aldehyde and a methyl ester,39 which suggests that oligothiophenes can potentially distinguish between an aldehyde and a carboxylic acid, given the similar electron withdrawing strength of a carboxylic acid and a methyl ester. In addition, oligothiophenes are linear aromatic planar molecules and have structural similarities to a variety of known ALDH substrates such as substituted naphthaldehydes, and are therefore good candidates to be ALDH substrates. However, despite their promise, oligothiophenes have never been investigated as ALDH imaging probes.
Results and discussion
Molecular design of the TBAs
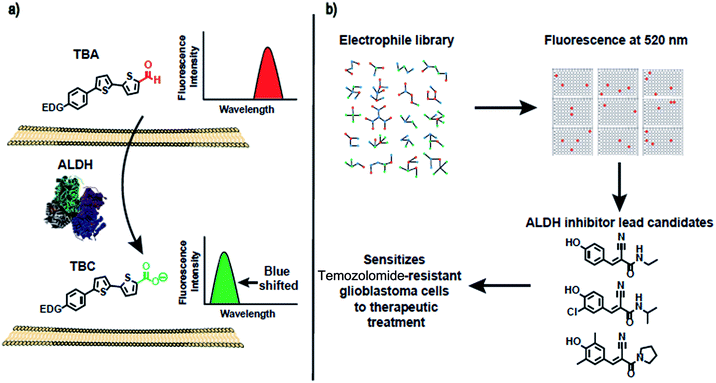
In this report, we present a family of fluorescent dyes, termed thiophene-bridged aldehydes (TBAs), which can image ALDH activity in cells. The mechanism by which the TBAs image ALDH activity is shown in Fig. 1. The TBAs are push–pull fluorophores composed of a bisthiophene that is flanked by an electron withdrawing aldehyde and an electron donating group. In the presence of ALDHs, the aldehydes of the TBAs are oxidized into carboxylic acids, generating thiophene-bridged carboxylates (TBCs), which have blue-shifted fluorescence in comparison to the TBAs. The TBAs and their ALDH oxidation products, TBCs, have different fluorescence spectra because the TBAs generate strong intramolecular charge transfer (ICT) in their excited state, whereas the TBCs do not. The TBCs cannot generate ICT in their excited state because their carboxylate has weak electron withdrawing ability (sigma = 0), and acts as a weak electron acceptor. The oxidation of the TBAs into TBCs by cellular ALDHs should be straightforward to visualize because their different fluorescence spectra will minimize interference from background fluorescence signals. In addition, the oxidation products, termed TBCs, have emission maxima in the 450–550 nm range, which are ideal wavelengths for imaging ALDH in cells because of the low background fluorescence at these wavelengths.The TBAs and TBCs emit fluorescence at different wavelengths
To image ALDH activity in cells, the TBAs and TBCs need to have distinguishable fluorescence spectra. We synthesized four different TBAs and their carboxylic analogues (TBCs), to determine if the TBAs could spectrally distinguish between an aldehyde and a carboxylic acid. Table 1 demonstrates that the TBAs and TBCs have substantially different absorption and emission properties. For example, the fluorescence emissions of all four TBAs were red-shifted by approximately 70–120 nm from their carboxylic acid analogues (see ESI, Fig. S15†). We investigated the difference in fluorescence emission between the TBAs and TBCs, after excitation at the TBC absorption maxima, to determine if there were sufficient differences between them to enable cellular imaging of ALDHs. In addition, we also wanted to identify the TBA that was best suited for ALDH imaging. Table 1 demonstrates that TBA2 is the most effective TBA. TBC2 generated a 214 fold increase in emission at 520 nm, versus TBA2, after excitation at 420 nm, the TBC absorption maxima. The quantum yield of TBC2 in water was also measured and was 9%, which is comparable to cyanine dyes.40 We performed density functional theory (DFT) calculations on TBA2 and TBC2, to determine if their different emission wavelengths could be explained by the modulation of intramolecular charge transfer (ICT) in their excited states. ESI Fig. S16† demonstrates that the LUMO of TBA2 has a dipole moment of 8.47D, whereas the LUMO of TBC2 has a dipole moment of only 6.50D. These experiments demonstrate that the different electron withdrawing properties of an aldehyde and a carboxylic acid can be visualized using push–pull bisthiophenes, and that TBAs have the fluorescence properties needed to image ALDH activity.| TBAsa | λ ex/λemb | TBCs (TBAs after ALDH oxidation)c | λ ex/λemd | Fold changes in fluorescence (ITBC/ITBA)lem(TBC)e |
|---|---|---|---|---|
| a Chemical structures of the TBAs. b Absorbance/fluorescence emission maximum wavelength. c Chemical structures of the TBCs. d Absorbance/fluorescence emission maximum wavelength. e Fold changes in emission when either TBA or TBC was excited at TBC’s absorption maximum. | ||||

|
402/516 |

|
370/446 | 4 |

|
450/642 |

|
420/520 | 214 |

|
408/530 |

|
378/460 | 22 |

|
406/535 |

|
370/445 | 30 |
TBAs are substrates for ALDH-mediated oxidation
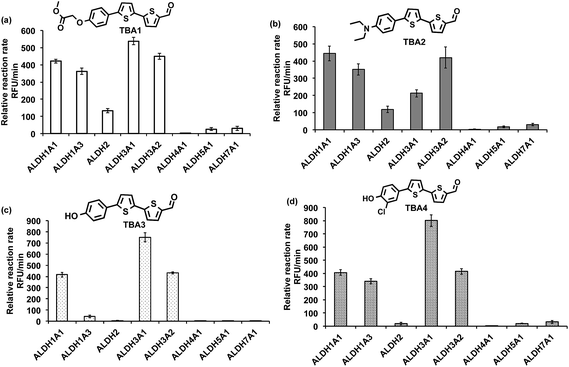
The ALDHs catalyze the oxidation of short chain aliphatic and aromatic aldehydes, and it is unclear whether ALDHs can oxidize conjugated oligo aromatic aldehydes. We therefore investigated whether the TBAs were substrates for 8 recombinant human ALDHs; ALDH1A1, ALDH1A3, ALDH2, ALDH3A1, ALDH3A2, ALDH4A1, ALDH5A1 and ALDH7A1, which represent the better characterized ALDHs. ALDH-mediated oxidation of the TBAs was determined by measuring the fluorescence at the corresponding TBC’s emission wavelength (ESI, Fig. S17†). Fig. 2 demonstrates that the TBAs are substrates for these ALDHs, and that the isoform specificity of the TBAs is determined by their electron donating group. For example, TBA2, which has a diethylamine as its electron donating group, was a substrate for all of the ALDHs tested, whereas TBA3, which has a phenol as its electron donating group, was only a substrate for ALDH1A1, ALDH3A1, and ALDH3A2. We selected TBA2 for future ALDH imaging experiments because of its broad reactivity with the ALDH isoforms, and because of its large change in fluorescence after oxidation. The kcat/Km values of TBA2 for the 8 recombinant ALDHs were determined and were in the range of 1.56 × 10⁶ to 65.44 × 10⁶ min−1 M−1 (see ESI Fig. S18 and Table S2†).Although TBA2 is a pan-specific ALDH substrate, its rate of oxidation is still approximately 3 orders of magnitude lower than cellular aldehydes, such as acetaldehyde, which has a kcat/Km value in the range of 109 min−1 M−1 for cellular ALDHs. The slow rate of TBA2 oxidation is potentially problematic, because TBA2 has to compete with cellular aldehydes to image ALDH activity in cells. We therefore determined whether cells could oxidize TBA2. A549 cells were incubated with TBA2 (5 μM) for 2 hours and HPLC was performed on the cell lysates to determine the conversion of TBA2 into TBC2. As a control, cells were incubated with TBA2 and the ALDH inhibitor disulfiram (100 μM). ESI Fig. S19 and Table S3† demonstrate that the cells oxidize TBA2 into TBC2. For example, TBA2 was completely oxidized into TBC2 by A549 cells after 2 hours of incubation, and its oxidation was completely inhibited by disulfiram.
TBA2 can image ALDH activity in cells via flow cytometry and fluorescence microscopy
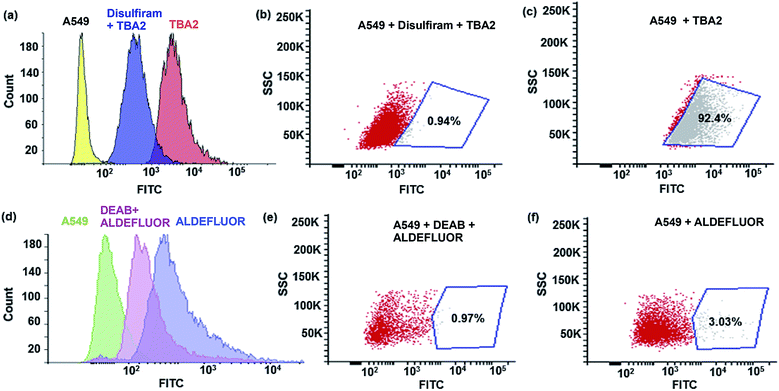
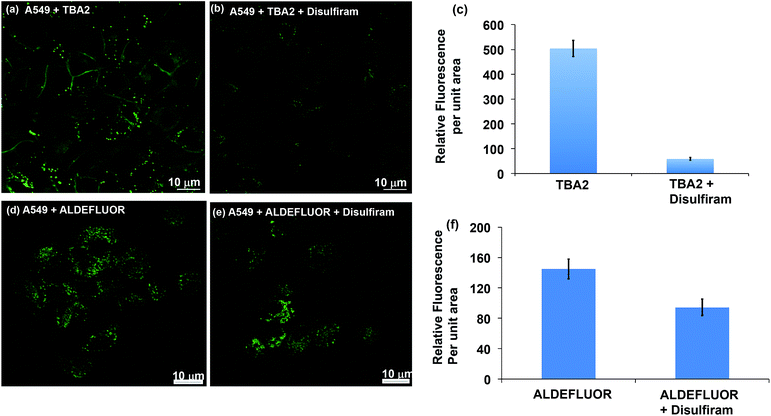
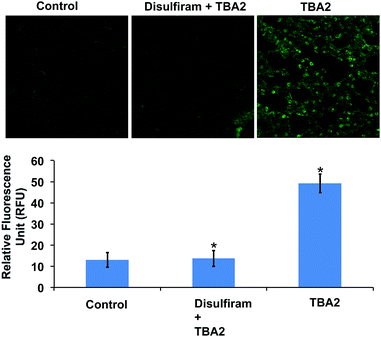
The TBAs have the potential to image ALDH activity in cells via flow cytometry due to the large spectral shift they generate in response to ALDH oxidation. To this end, we performed experiments to determine whether TBA2 could measure ALDH activity in cells via flow cytometry and compared its efficacy to ALDEFLUOR. A549 cells were treated with either ALDEFLUOR or TBA2 (1.5 μM or 5 μM) and incubated for 1 hour and 4 hours respectively, and analyzed via flow cytometry. A549 cells were also incubated with ALDH inhibitors and either ALDEFLUOR or TBA2, to establish gates for the ALDH positive cells. Fig. 3 demonstrates that TBA2 can measure ALDH activity in cells via flow cytometry and is significantly better than ALDEFLUOR. For example, A549 cells treated with TBA2 were 93% positive for ALDH activity, whereas with ALDEFLUOR only 3% of the cells were ALDH positive, due to the large background fluorescence caused by non-specific accumulation of ALDEFLUOR. TBA2 can therefore measure ALDH activity in cells via flow cytometry and should find numerous applications as a cell culture reagent.We performed experiments to determine whether TBA2 could image ALDH activity in cells via fluorescence microscopy. ALDH catalyzed oxidation of TBA2 to TBC2 should be readily imaged by fluorescence microscopy, because the emission of TBC2 is at 520 nm and is significantly different from that of TBA2. A549 cells were incubated with TBA2 (5 μM) or TBA2 (5 μM) + disulfiram (100 μM) for 4 hours, and imaged by fluorescence microscopy. As a control, A549 cells were incubated with ALDEFLUOR (5 μM) or ALDEFLUOR (5 μM) + disulfiram (100 μM) for 1 hour and imaged. Fig. 4 demonstrates that TBA2 can image ALDH activity via fluorescence microscopy and is significantly better than ALDEFLUOR. For example, cells treated with TBA2 had a 9-fold increase in fluorescence compared to cells treated with TBA2 + disulfiram. In contrast, cells treated with ALDEFLUOR only had a 1.5-fold increase in fluorescence over cells treated with ALDEFLUOR + disulfiram.
TBA2 measures ALDH activity in animals using histology
ALDHs are ubiquitously expressed in mammalian tissues and play an important role in physiology. However, despite their importance, imaging ALDH activity in vivo has been challenging due to the lack of imaging dyes. We next determined whether TBA2 could image ALDH activity in the lungs of mice. TBA2 (0.1 mL, 1 mg kg−1) was injected into the intraperitoneal cavity (IP) using DMSO as a vehicle and after 4 hours the mice were sacrificed and sections of the lungs were analysed for fluorescence at an emission wavelength of 520 nm. As a control, mice were treated with TBA2 and disulfiram (400 mg kg−1). Fig. 5 demonstrates that TBA2 can image ALDH activity in the lungs of a healthy mouse, as evidenced from histological analysis. For example, mice treated with TBA2 had a 4-fold higher level of fluorescence emission than mice treated with TBA2 in the presence of disulfiram. TBA’s ability to image ALDH in vivo has the potential to significantly accelerate numerous areas of research, such as the development of new ALDH inhibitors and activators, and can also be used to understand how the activity of the ALDHs is modulated in various pathological conditions.TBA2 images ALDH activity in a plate reader and can be used to screen for ALDH inhibitors
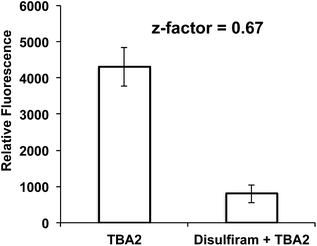
The over-expression of ALDH is a major cause of drug resistance in cancer cells, and is also required for maintaining cancer stem cells and their invasive phenotype.23–27 ALDH inhibitors therefore have great promise for improving the treatment of cancer. However, disulfiram is the only FDA-approved ALDH inhibitor available, and is challenging to use in combination with chemotherapy because it causes liver toxicity, neurotoxicity, and various other side effects.41–45 There is therefore great interest in developing new small molecules that can inhibit ALDH activity. However, developing ALDH inhibitors that are active in cells has been challenging, because of the lack of assays available for measuring ALDH activity in live cells. In particular, the inability to image ALDH activity via a plate reader format has limited the development of ALDH inhibitors. At present, high throughput screening (HTS) for ALDH inhibitors has to be done in vitro on purified enzymes, and cannot be done on cells. Only a small fraction of test tube positive hits in vitro are effective in cells, and developing HTS for ALDH inhibitors that can be performed on cells has the potential to dramatically accelerate the development of new ALDH inhibitors.We performed experiments to determine whether TBA2 could detect ALDH activity in cells in a plate reader format, and if it had the statistical robustness needed to screen chemical libraries in cells in a high throughput manner. A549 cells were selected as the cell line for assay development and validation because of their well-established expression of ALDH. A549 cells were plated in 96 well plates and incubated with either TBA2 or TBA2 and disulfiram (100 μM) and the fluorescence of the cells at 520 nm was measured via a plate reader. Fig. 6 demonstrates that TBA2 detects ALDH activity in cells via a plate reader assay and can be used for developing HTS assays for ALDH inhibitors. For example, cells treated with TBA2 (10 μM) had a five-fold increase in fluorescence over cells treated with TBA2 (10 μM) + disulfiram (100 μM). In addition, the standard deviation of cells treated with TBA2 was small, and the Z-factor for identifying ALDH inhibitors was 0.67. Thus, TBA2 has the potential to screen small molecule/fragment based libraries in cells in a high throughput manner.
Cyanoacrylamide fragments inhibit ALDH activity in cells
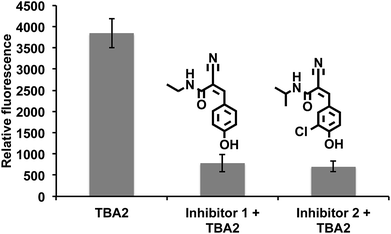
Drugs that can irreversibly inhibit ALDH activity have tremendous potential as therapeutics, because of their long lasting effects and suitable pharmacokinetic properties. Moreover, developing irreversible inhibitors against ALDH should be feasible because ALDHs contain a reactive cysteine in their active site, which acts as a nucleophile that can be targeted with activity-based inhibitors.46–48 Therefore, there is great interest in identifying electrophile fragments that can serve as lead candidates for the development of irreversible ALDH inhibitors.We therefore screened an electrophile library composed of 1460 electrophiles (obtained from Enamine) against A549 cells using the cell-based HTS assay developed above. The cells were treated with members of the library at a 500 μg mL−1 concentration for 2.5 hours, incubated with TBA2 (10 μM) for another 2.5 h, and the fluorescence intensity at 520 nm was measured. Compounds generating a 60% suppression in fluorescence intensity relative to the TBA2 treated cells were considered positive hits. Positive hits were revalidated at lower concentrations to further characterize their activity. Fig. 7 demonstrates that substituted α,β-unsaturated phenyl cyanoacrylamides are a pharmacophore with the potential to inhibit ALDH activity in cells. For example, 3 hits containing the α,β-unsaturated phenyl cyanoacrylamide pharmacophores were identified, which were able to inhibit ALDH activity in cells, and had an IC90 comparable to disulfiram (Fig. 7). α,β-unsaturated phenyl cyanoacrylamide fragments are attractive lead compounds for drug development because of their ability to generate long lasting reversible inhibitors, and have been widely used for developing inhibitors against kinases.49–52
We performed experiments to determine whether the hits identified from our HTS screen, compounds 1 and 2, could inhibit ALDH activity in glioblastoma multiforme (GBM) tumor initiating cells and sensitize them to temozolomide (TMZ). For these experiments, we used GBM cells that were collected from a clinic, isolated from a male patient who did not respond to treatment with TMZ. TMZ drug resistance in GBM cells is linked to the expression of ALDHs, and there is therefore great interest in developing combination therapeutics composed of TMZ plus ALDH inhibitors.53 Compounds 1 and 2 have the potential to sensitize GBM stem cells toward TMZ, and if successful would provide a much needed alternative to disulfiram. GBM tumor initiating cells (50 cells per well) were treated with either TMZ or TMZ and the inhibitors 1 or 2, and the number of tumor spheroids formed 10 days after treatment was measured. Fig. 8a demonstrates that the ALDH inhibitor fragments 1 and 2 sensitized GBM stem cells to TMZ and dramatically lowered the number of spheroids formed 10 days after treatment. In addition, we have performed a MTT assay with TICs using our leads and disulfiram. Fig. 8b demonstrates that the inhibitors 1 and 2 have very little toxicity by themselves, but in the presence of temozolomide they suppress formation of spheroids. Therefore, they sensitize TICs to temozolomide via inhibition of ALDH. In contrast, disulfiram was toxic to TICs at a very low concentration due to non-specificity, suggesting that the cyanoacrylamide fragments 1 and 2 have potential as lead candidates for future drug development.
Conclusions
In this report, we have developed a new family of fluorescent probes, termed TBAs, that can image ALDH activity in cells. The TBAs are composed of a bisthiophene flanked by an electron donor and an aldehyde. The TBAs image ALDH activity via a fluorescence sensing mechanism, based on modulation of intramolecular charge transfer (ICT). This feature allows these fluorophores to spectrally distinguish between an aldehyde and a carboxylic acid. We have demonstrated that TBA2 can measure ALDH in cells via flow cytometry and also enabled the imaging of ALDH in cells via fluorescence microscopy. In addition, a plate reader-based ALDH assay was developed, which has the robustness needed to screen chemical libraries. We screened a large, 1460-entry electrophile library with A549 cells and found three covalent fragments, each containing an α,β-unsaturated cyanoacrylamide, that were able to inhibit ALDH activity in cells, and are thus potential lead fragments for future drug development. The TBAs have the potential to impact multiple areas of medicine and biology given their ability to image ALDH activity in cells via flow cytometry and fluorescence microscopy, and via a plate reader.Author contributions
S. M. did all the synthesis, characterization, in vitro enzymatic assay and cell work. J-M. G. L. performed the tumor sphere study with the GBM tumor initiating cell. S. M. and C. M. S. did the high-throughput screening with the covalent library. S. M. and C. H. C. performed the in vitro assay with ALDH isozymes. All authors contributed in writing the manuscript.Conflicts of interest
There is no conflicts of interest to declare.Acknowledgements
The work was supported by the National Institute of Health (R01 AI117064, RO1 AI107116-01, RO1 EB02000801A1, and NIH R21 AI119115-01), Keck foundation and R37 AA11147 to DMR.References
- C. Bullock, Biochem. Educ., 1990, 18, 62 CrossRef CAS.
- V. Vasiliou and A. Pappa, Pharmacology, 2000, 61, 192 CrossRef CAS PubMed.
- R. Lindahl, Crit. Rev. Biochem. Mol. Biol., 1992, 27, 283 CrossRef CAS PubMed.
- J. M. Guo, A. J. Liu, P. Zang, W. Z. Dong, L. Ying, W. Wang, P. Xu, X. R. Song, J. Cai, S. Q. Zhang, J. L. Duan, J. L. Mehta and D. F. Su, Cell Res., 2013, 23, 915 CrossRef CAS PubMed.
- I. Kruman, A. J. Bruce-Keller, D. Bredesen, G. Waeg and M. P. Mattson, J. Neurosci., 1997, 17, 5089 CAS.
- E. Okun, T. V. Arumugam, S. C. Tang, M. Gleichmann, M. Albeck, B. Sredni and M. P. Mattson, J. Neurochem., 2007, 102, 1232 CrossRef CAS PubMed.
- W. C. Lee, H. Y. Wong, Y. Y. Chai, C. W. Shi, N. Amino, S. Kikuchi and S. H. Huang, Biochem. Biophys. Res. Commun., 2012, 425, 842 CrossRef CAS PubMed.
- P. Jenner, Ann. Neurol., 2003, 3(suppl. 53), S26 CrossRef PubMed.
- T. T. Reed, Free Radical Biol. Med., 2011, 51, 1302 CrossRef CAS PubMed.
- X. Zhu, M. A. Smith, G. Perry and G. Aliev, Am. J. Alzheimer’s Dis., 2004, 19, 345 CrossRef PubMed.
- C. J. Werner, H. R. Heyny-von, G. Mall and S. Wolf, Proteome Sci., 2008, 6, 8 CrossRef PubMed.
- B. Wang, J. Wang, S. Zhou, S. Tan, X. He, Z. Yang, Y. C. Xie, S. Li, C. Zheng and X. Ma, J. Neurol. Sci., 2008, 268, 172 CrossRef CAS PubMed.
- K. Kamino, K. Nagasaka, M. Imagawa, H. Yamamoto, H. Yoneda, A. Ueki, S. Kitamura, K. Namekata, T. Miki and S. Ohta, Biochem. Biophys. Res. Commun., 2000, 273, 192 CrossRef CAS PubMed.
- P. Boffetta and M. Hashibe, Lancet Oncol., 2006, 7, 149 CrossRef CAS PubMed.
- H. K. Seitz and P. Meier, Transl. Res., 2007, 149, 293 CrossRef CAS PubMed.
- A. Yokoyama, T. Muramatsu, T. Ohmori, S. Higuchi, M. Ishii and H. Hayashida, Cancer Epidemiol., Biomarkers Prev., 1996, 5, 99 CAS.
- C. H. Chen, G. R. Budas, E. N. Churchill, M. H. Disatnik, T. D. Hurley and D. Mochly-Rosen, Science, 2008, 321, 1493 CrossRef CAS PubMed.
- W. Ge and J. Ren, J. Cell. Mol. Med., 2012, 16, 616 CrossRef PubMed.
- Y. Zhang, S. A. Babcock, N. Hu, J. R. Maris, H. Wang and J. Ren, BMC Med., 2012, 10, 40 CrossRef PubMed.
- L. Sun, J. C. Ferreira and D. Mochly-Rosen, Sci. Transl. Med., 2011, 3, 107 Search PubMed.
- C. H. Chen, J. C. B. Ferreira, E. R. Gross and D. Mochly-Rosen, Physiol. Rev., 2014, 94, 1 CrossRef CAS PubMed.
- C. Liedtke, C. Bernemann, L. Kiesel and A. Rody, Breast Care, 2013, 8, 408 CrossRef PubMed.
- J. Chen, V. Y. Shin, M. T. Siu, J. C. W. Ho, I. Cheuk and A. Kwong, BMC Cancer, 2016, 16, 887 CrossRef PubMed.
- P. S. Thiagarajan, M. Hitomi, J. S. Hale, A. G. Alvarado, B. Otvos, M. Sinyuk, K. Stoltz, A. Wiechert, E. Mulkearns-Hubert, A. Jarrar, Q. Zheng, D. Thomas, T. Egelhoff, J. N. Rich, H. Liu, J. D. Lathia and O. Reizes, Cancer Stem Cells, 2015, 33, 2114 CrossRef CAS PubMed.
- D. Samanta, D. M. Gilkes, P. Chaturvedi, L. Xiang and G. L. Semenza, Proc. Natl. Acad. Sci. U. S. A., 2014, 111, E5429 CrossRef CAS PubMed.
- M. Rasper, A. Schafer, G. Piontek, J. Teufnel, G. Brock-hoff, F. Ringel, S. Heindl, C. Zimmer and J. Schlegel, Neuro-Oncology, 2010, 12, 1024 CrossRef CAS PubMed.
- S. A. Choi, J. Y. Lee, J. H. Phi, K. C. Wang, C. K. Park, S. H. Park and S. K. Kim, Eur. J. Cancer, 2014, 50, 137 CrossRef CAS PubMed.
- P. Liu, S. Brown, T. Goktug, P. Channathodiyil, V. Kannappan, J.-P. Hugnot, P.-O. Guichet, X. Bian, A. L. Armesilla, J. L. Darling and W. Wang, Br. J. Cancer, 2012, 107, 1488 CrossRef CAS PubMed.
- S. L. Xu, S. Liu, W. Cui, Y. Shi, Q. Liu, J.-J. Duan, S. C. Yu, X. Zhang, Y.-H. Cui, H.-F. Kung and X. W. Bian, Am. J. Cancer Res., 2015, 5, 1471 CAS.
- L. Liang, C. Liu, X. Jiao, L. Zhao and X. Xeng, Chem. Commun., 2016, 52, 7982 RSC.
- H. Zhu, J. Fan, J. Wang, H. Mu and X. Peng, J. Am. Chem. Soc., 2014, 136, 12820 CrossRef CAS PubMed.
- A. M. Bogdanov, A. Acharya, A. V. Titelmayer, A. V. Mamontova, K. B. Bravaya, A. B. Kolomeisky, K. A. Lukyanov and A. I. Krylov, J. Am. Chem. Soc., 2016, 138, 4807 CrossRef CAS PubMed.
- M. D. Hammers, M. J. Taormina, M. M. Cerda, L. A. Montoya, D. T. Seidencranz, R. Parthasarathy and M. D. Pluth, J. Am. Chem. Soc., 2015, 137, 10216 CrossRef CAS PubMed.
- X. Lv, Y. Yu, M. Zhou, C. Hu, F. Gao, J. Li, X. Liu, K. Deng, P. Zheng, W. Gong, A. Xia and J. Wang, J. Am. Chem. Soc., 2015, 137, 7270 CrossRef CAS PubMed.
- J. Jhang, R. E. Campbell, A. Y. Ting and R. Y. Tsien, Nat. Rev. Mol. Cell Biol., 2002, 3, 906 CrossRef PubMed.
- J. Chan, S. C. Dodani and C. J. Chang, Nat. Chem., 2012, 4, 973 CrossRef CAS PubMed.
- (a) I. Minn, H. Wang, R. Mease, Y. Byun, X. Yang, J. Wang, S. D. Leach and M. G. Pomper, Nat. Commun., 2014, 5, 3662 CAS; (b) O. Christ, K. Lucke, S. Imren, K. Leung, M. Hamilton, A. Eaves, C. Smith and C. Eaves, Haematologica, 2007, 92, 1165 CrossRef CAS PubMed; (c) I. Ma and A. L. Allan, Stem Cell Rev., 2011, 7, 292 CrossRef CAS PubMed; (d) R. W. Storms, A. P. Trujillo, J. B. Springers, L. Shah, O. M. Colvin, S. M. Ludeman and C. Smith, Proc. Natl. Acad. Sci. U. S. A., 1999, 96, 9118 CrossRef CAS PubMed; (e) J. S. Moreb, D. Ucar, S. Han, J. K. Amroy, A. S. Goldstein, B. Ostmark and L. J. Chang, Chem.-Biol. Interact., 2012, 195, 52 CrossRef CAS PubMed.
- A. A. Klyosov, Biochemistry, 1996, 35, 4457 CrossRef CAS PubMed.
- (a) M. Zambianchi, F. D. Maria, A. Cazzato, G. Gigli, M. Piacenza, F. D. Sala and G. Barbarella, J. Am. Chem. Soc., 2009, 131, 10892 CrossRef CAS PubMed; (b) M. L. Capobianco, G. Barbarella and A. Manetto, Molecules, 2012, 17, 910 CrossRef CAS PubMed; (c) A. Fin, A. V. Jentzch, N. Sakai and S. Matile, Angew. Chem., Int. Ed., 2012, 51, 12736 CrossRef CAS PubMed.
- (a) S. R. Majumdar, R. B. Majumdar, U. M. Grant and A. S. Waggoner, Bioconjugate Chem., 1996, 7, 356 CrossRef PubMed; (b) K. Kiyose, S. Aizawa, E. Sasaki, H. Kojima, K. Hanaoka, T. Terai, Y. Urano and T. Nagano, Chem.–Eur. J., 2009, 15, 9191 CrossRef CAS PubMed.
- N. Asikian, Y. Bronstein, M. Danesh and F. Torres, Neurology, 2015, 84, P5.110 Search PubMed.
- D. Laplane, N. Attal, B. Sauron, A. D. Billy and B. Du-bois, J. Neurol., Neurosurg. Psychiatry, 1992, 55, 925 CrossRef CAS.
- P. N. Karamanakos, P. Pappas, P. Stephanou and M. Marselos, Pharmacol. Toxicol., 2001, 88, 106 CAS.
- R. G. Berlin, Alcohol Alcohol., 1989, 24, 241 CAS.
- S. J. Morris, R. Kanner, R. O. Chiprut and E. R. Schiff, Gastroenterology, 1978, 75, 100 CAS.
- V. Koppaka, D. C. Thompson, Y. Chen, M. Ellermann, K. C. Nicolaou, R. O. Juvonen, D. Petersen, R. A. Deitrich, T. D. Hurley and V. Vasiliou, Pharmacol. Rev., 2012, 64, 520 CrossRef CAS PubMed.
- S. M. Yang, A. Yasgar, B. Miller, M. Lal-Nag, K. Brima-combe, X. Hu, H. Sun, A. Wang, X. Xu, K. Nguyen, U. Oppermann, M. Ferrer, V. Vasiliou, A. Simeonov, A. Jadhav and D. J. Maloney, J. Med. Chem., 2015, 58, 5967 CrossRef CAS PubMed.
- M. Khanna, C. H. Chen, A. Kimble-Hill, B. Parajuli, S. Perez-Miller, S. Baskaran, J. Kim, K. Dria, V. Vasiliou, D. Mochly-Rosen and T. D. Hurley, J. Biol. Chem., 2011, 286, 43486 CrossRef CAS PubMed.
- S. Krishnan, R. M. Miller, B. Tian, R. D. Mullins, M. P. Jacobson and J. Taunton, J. Am. Chem. Soc., 2014, 136, 12624 CrossRef CAS PubMed.
- R. M. Miller, V. O. Paavilainen, S. Krishnan, I. M. Serafimova and J. Taunton, J. Am. Chem. Soc., 2013, 135, 5298 CrossRef CAS PubMed.
- N. N. Gushwa, S. Kang, J. Chen and J. Taunton, J. Am. Chem. Soc., 2012, 134, 20214 CrossRef CAS PubMed.
- I. M. Serafimova, M. A. Pufall, S. Krishnan, K. Duda, M. S. Cohen, R. L. Maglathlin, J. M. McFarland, R. M. Miller, M. Frodin and J. Taunton, Nat. Chem. Biol., 2012, 8, 471 CrossRef CAS PubMed.
- A. Schafer, J. Teufel, F. Ringel, M. Bettstetter, I. Hoepner, M. Rasper, J. Gempt, J. Koeritzer, F. Schmidt-Graf, B. Meyer, C. P. Beier and J. Schlegel, Neuro-Oncology, 2012, 14, 1452 CrossRef PubMed.
Footnotes |
| † Electronic supplementary information (ESI) available. See DOI: 10.1039/c7sc03017g |
| ‡ These authors contributed equally. |
| This journal is © The Royal Society of Chemistry 2017 |

