Automatic high-pressure hydrogen generation from formic acid in the presence of nano-Pd heterogeneous catalysts at mild temperatures†
Heng
Zhong
a,
Masayuki
Iguchi
a,
Fu-Zhan
Song
b,
Maya
Chatterjee
 a,
Takayuki
Ishizaka
a,
Ikuhiro
Nagao
a,
Qiang
Xu
a,
Takayuki
Ishizaka
a,
Ikuhiro
Nagao
a,
Qiang
Xu
 b and
Hajime
Kawanami
 *a
*a
aResearch Institute for Chemical Process Technology, National Institute of Advanced Industrial Science and Technology, 4-2-1 Nigatake, Miyagino-ku, Sendai 983-8551, Japan. E-mail: h-kawanami@aist.go.jp; Fax: +81-22-237-2097; Tel: +81-22-237-2097
bResearch Institute of Electrochemical Energy, National Institute of Advanced Industrial Science and Technology, 1-8-31, Midorigaoka, Ikeda, Osaka 563-8577, Japan
First published on 17th May 2017
Abstract
High-pressure hydrogen is of great interest in the industrial utilization of hydrogen energy, especially for hydrogen fuel cell vehicles. In this work, a method of automatic high-pressure H2 generation by the decomposition of formic acid, a recently renowned hydrogen storage material, in the presence of a heterogeneous catalyst (palladium nano-particles on a graphene oxide catalyst (Pd/PDA–rGO)) was proposed. This catalyst can effectively catalyze the decomposition of formic acid to produce high-pressure H2 and CO2 over 35 MPa without any detectable formation of CO or other by-products. For example, a 36.3 MPa total gas pressure was successfully achieved using an aqueous solution of 6.7 mol L−1 formic acid and 6.7 mol L−1 sodium formate at 80 °C. This research provided a preliminary study on the automatic high-pressure hydrogen gas generation by the decomposition of formic acid without any compression facilities in the presence of a heterogeneous catalyst, which can be easily separated from the reaction process, for hydrogen energy utilization.
1. Introduction
Hydrogen energy is regarded as one of the most promising renewable and clean energy sources, especially for fuel cell vehicles (FCVs), to replace the fossil fuels and to contribute to the development of zero CO2 emission technology due to its high gravimetric energy density and non-toxicity.1,2 However, hydrogen under atmospheric conditions has a very low volumetric energy density (10 kJ L−1), hence, compression and a storage system under high-pressure conditions are indispensable for the utilization of hydrogen energy especially in the transportation sector.1 Solid hydrogen storage materials, such as metal hydrides and porous materials, which can absorb hydrogen chemically or physically, have been studied extensively in the past two decades.3,4 However, the requirements of low temperature and high-pressure in the hydrogen absorbing/adsorbing processes and/or high temperature in the hydrogen releasing processes during the use of solid hydrogen storage materials lead to extra energy consumption.5 On the other hand, liquid organic hydrogen carriers (LOHCs), such as hydrazine, ammonia and formic acid, have attracted considerable attention recently since they have relatively high gravimetric hydrogen energy density and can be operated under ambient conditions.6,7 Among these LOHCs, formic acid is one of the most promising carriers and has attracted significant research interest recently.7 It has several outstanding advantages such as (1) high stability, (2) high hydrogen content (4.4 wt%), (3) low-toxicity, low-flammability and bio-degradability, and (4) compatibility with the existing infrastructures used for gasoline and diesel. Furthermore, the co-product of CO2 after the decomposition of formic acid can be readily re-activated back to formic acid again by reacting with the hydrogen derived from H2O through different renewable pathways including photocatalysis.8–11 Thus, a sustainable and renewable CO2–HCOOH cycle system for continuous conversion of renewable energies into chemical energy can be realized.In the practical application of hydrogen energy, especially for charging the FCVs, high-pressure hydrogen (over 35 MPa (ref. 12)) is necessary to increase the volumetric energy density and enhance the energy conversion efficiency.13 However, the generation of high-pressure hydrogen through mechanical compression consumes large amounts of extra energy.14 Therefore, methods for in situ and automatic generation of high-pressure hydrogen without any compression are highly desirable. However, most of the reported studies related to the hydrogen generation from formic acid focused on the atmospheric hydrogen production rather than high-pressure hydrogen generation.15–18 In our previous research, we successfully accomplished the in situ and automatic high-pressure hydrogen generation from formic acid, which is thermodynamically viable, and a total gas (CO2 + H2) pressure was obtained over 120 MPa by using a homogeneous catalyst ([Cp*Ir(4DHBP)(H2O)][SO4] (Cp* = pentamethylcyclopentadienide, 4DHBP = 4,4′-dihydroxy-2,2′-bipyridine)).19,20 However, given the intrinsic disadvantages of the homogeneous catalyst such as poor recovery, a heterogeneous catalyst, which can be easily separated, is more preferred in the large-scale application such as for hydrogen stations. Recently, Song et al. have reported a diamine-alkalized reduced graphene oxide supported palladium nano-particle catalyst (Pd/PDA–rGO, PDA: p-phenylenediamine, rGO: reduced graphene oxide) for highly efficient formic acid dehydrogenation at atmospheric pressure, in which, a 3810 h−1 turnover frequency (TOF) of the Pd/PDA–rGO catalyst for the formic acid dehydrogenation at 50 °C has been achieved.21 Based on this research, we built up a high-pressure reaction system and investigated the application of the same catalyst for high-pressure hydrogen production. The objective of this research was to generate high-pressure gases (H2 + CO2) over 35 MPa, a typical hydrogen pressure for FCV utilization,12 automatically from the decomposition of formic acid by using the heterogeneous catalyst at mild temperatures without any compression facilities.
2. Experimental
2.1. Catalyst synthesis, characterization and activity evaluation
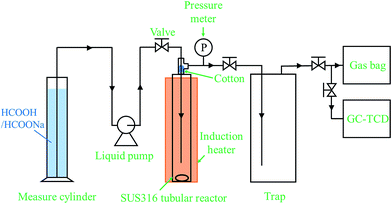
The diamine-alkalized reduced graphene oxide supported palladium nano-particle catalyst (Pd/PDA–rGO) was prepared according to the literature.21 The detailed procedure can be found in the ESI.† From the X-ray diffraction (XRD) spectra of the synthesized graphene oxide (GO) (ESI; Fig. S1†), a strong peak at 2θ of 10.2° was observed, however, this peak was not detected in the PDA–GO and Pd/PDA–rGO samples, suggesting disordered re-stacking of the PDA–GO layers. The small diffraction peak at 39.7° observed in the Pd/PDA–rGO catalyst is related to the Pd (111) facet according to the international center for diffraction data (ICDD: 00-046-1043), which suggests that the Pd was dispersed in the PDA–rGO. From the SEM images of the Pd/PDA–rGO catalyst, a continuous silk wave-like morphology was observed (ESI; Fig. S2(a) and (b)†), which is a result of the interactions between graphene oxide layers.21 Transmission electron microscopy (TEM) images of the Pd/PDA–rGO showed that fine Pd nano-particles with a size of ca. 1–2 nm were obtained although relatively large Pd nano-particles (ca. 7 nm) were also observed (ESI; Fig. S2(c) and (d)†). The loading amount of Pd on the Pd/PDA–rGO catalyst was determined to be 8.4 ± 0.1% by using ICP-AES (inductively coupled plasma atomic emission spectroscopy).A stainless steel (SUS-316) tubular reactor (1/2 inch o.d., 2.41 mm wall thickness, 7.6 mL inner volume) together with an induction heater (EYELAPPM-5512, Tokyo Rikakikai Co., LTD.), two stop valves, a liquid injection pump (Shimadzu LC-6AD) and a pressure transducer (DLS-5028, Toyo Sokki Co., Ltd.) was used to test the catalytic activity of the Pd/PDA–rGO catalyst for the decomposition of formic acid. The schematic diagram of the reaction system is shown in Fig. 1. Typically, 10 to 100 mg catalyst was first loaded into the reactor which was then sealed and connected to the reaction system. A desired amount (3–7.5 mL) of the mixture of formic acid and sodium formate aqueous solution was injected into the reactor through a liquid pump. During injection, all the valves were kept open to avoid the compression of the air in the tubular reactor. Once the injection was completed, all the valves were closed immediately followed by heating and stirring to initiate the reaction at the desired temperature within 50–90 min (ESI; Fig. S3†). The pressure inside the reactor was recorded every 5 seconds during the entire reaction time. The starting point of the reaction time was defined as the time when heating was started. The actual increase of the temperature inside the tubular reactor with time at different reaction temperatures was measured by using a thermocouple separately before the actual reaction (ESI; Fig. S3†). At the desired reaction time, the gas sample was collected through a Tedlar sampling gas bag and analyzed by GC-TCD (Shimadzu GC-8A equipped with one molecular sieve column and one Porapak Q column). The gas volume was measured by using a wet gas meter (W-NK-1, Shinagawa Co., Ltd). The liquid sample was separated from the solid precipitate by centrifugation and analyzed by HPLC after being filtered through a 0.45 μm PTFE syringe filter and diluted to 1/50 with deionized water. The liquid sample for ICP analysis was diluted to 1/10 with deionized water. The solid sample was collected from the remaining solid–liquid mixture by vacuum filtration through a 0.45 μm PTFE film, washed with de-ionized water several times, and dried in a vacuum oven at room temperature.
2.2. Catalyst re-activation
The used catalyst was re-activated in two steps. The first step is that the used catalyst was reacted with 1 mol L−1 NaOH at 60 °C for 2 h, then thoroughly washed with de-ionized water, filtered through a 0.45 μm PTFE film, and subsequently dried in a vacuum at room temperature over 12 h. The second step is that the vacuum dried catalyst was calcined in air at 200 °C for 2 h.2.3. Definition
The formic acid conversion (FAC) is defined as follows | (1) |
3. Results and discussion
3.1. High-pressure H2 generation
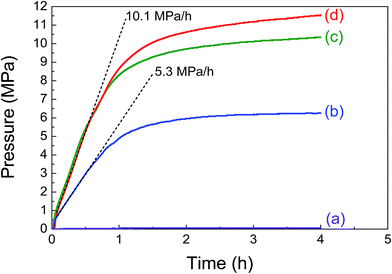
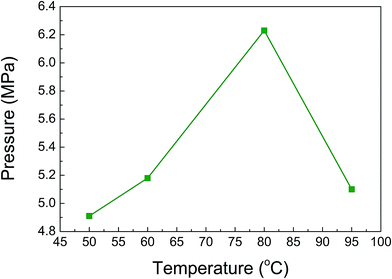
Formic acid decomposition in the presence of different amounts of the Pd/PDA–rGO catalyst was first investigated in an aqueous solution of 6.7 mol L−1 formic acid and 6.7 mol L−1 sodium formate at 80 °C. Fig. 2 shows the time course of generated gas pressure with the addition of 0, 10, 20 and 50 mg of the catalyst, respectively. No gas pressure was detected in the absence of catalyst even after 4 h of reaction as a blank test, confirming that the formic acid does not decompose in the absence of catalyst (Fig. 2(a)). When 10 mg of the Pd/PDA–rGO catalyst was used, the gas pressure was increased rapidly at the initial rate of 5.3 MPa h−1 and reached 4.9 MPa within the first hour. Then, the pressure increase slowed down and finally the gas pressure reached almost an equilibrium pressure of 6.3 MPa after 4 h (Fig. 2(b)). This phenomenon indicates that the Pd/PDA–rGO catalyst has a good catalytic activity in the formic acid decomposition even under the high-pressure conditions. Gas product analysis confirmed that the generated gas contained only CO2 and H2, and no CO was detected by GC-TCD analyses (<10 ppm). When the catalyst amount was increased to 20 mg, the gas pressure was increased to 10.4 MPa (Fig. 2(c)); 1.7 times higher than that with 10 mg of catalyst. By increasing the amount of catalyst to 50 mg, the gas pressure was further improved, but slightly, to 11.5 MPa after 4 h (Fig. 2(d)).The effect of temperature on the pressure generation by formic acid decomposition was studied at 50, 60, 80, and 95 °C, respectively. As shown in Fig. 3, the obtained gas pressure increased from 4.9 to 6.2 MPa as the temperature changed from 50 to 80 °C. However, a further increase in the temperature to 95 °C led to a rapid decrease in the gas pressure to 5.1 MPa, which is probably because the reverse reaction of the FA decomposition is enforced at higher temperature. Thus, an optimum reaction temperature exists for the FA decomposition. Furthermore, the pressure was almost unchanged until 4 h at temperatures over 80 °C, while it still increased slightly after 15 h at temperatures of 50 and 60 °C (ESI; Fig. S4†), indicating that the reaction equilibrium is more accessible at higher temperature.
For the generation of high-pressure gases over 11.5 MPa, the effect of liquid volume on the gas pressure was studied by varying the volume from 3 to 7.5 mL (Fig. 4). The gas pressure first increased slowly from 2.7 to 6.2 MPa with the increase in liquid volume from 3 to 6 mL. As the liquid volume exceeded 6 mL, a drastic increase in the gas pressure to 9.7 MPa at 80 °C was observed with the liquid volume of 7 mL. When the gas pressure is over 7.2 MPa, the generated gas is changed to a supercritical phase. Thus over 7.2 MPa, the gas pressure easily increased and reached the pressure of 19.4 MPa when the liquid volume increased to 7.5 mL.
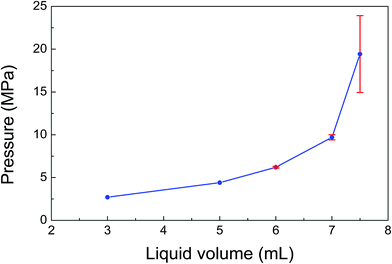 | ||
| Fig. 4 Effect of liquid volume on the gas pressure (solution: 6.7 mol L−1 formic acid + 6.7 mol L−1 sodium formate; catalyst: 10 mg; temperature: 80 °C; time: 4 h). | ||
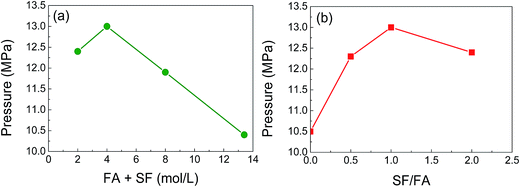
As the catalytic formic acid decomposition rate is also affected by the formic acid concentration and the ratio of sodium formate to formic acid (SF/FA),17,21,22 we studied the effect of solution concentration and the ratio of SF/FA under various conditions (Fig. 5). In Fig. 5(a), to find the best formic acid concentration for the gas evolution, the sum concentration of FA and SF was varied from 2 to 13.4 mol L−1 with the constant ratio of FA/SF = 1![[thin space (1/6-em)]](https://www.rsc.org/images/entities/char_2009.gif) :
:![[thin space (1/6-em)]](https://www.rsc.org/images/entities/char_2009.gif) 1, and the value of 4 mol L−1 was the best (13.0 MPa), but a higher concentration up to 13.4 mol L−1 can also be available with a lower pressure at 10 MPa, whereas the formic acid conversion (FAC) was decreased significantly from 88.0% (at 2 mol L−1) to 2.3% (13.4 mol L−1) (Table 1). The decrease of FAC at higher concentration might occur by the decomposition of the Pd/PDA–rGO catalyst during the reaction under high-pressure conditions. Fig. 5(b) shows the SF/FA ratio effects on the high-pressure gas generation. The results revealed that a SF/FA ratio of 1
1, and the value of 4 mol L−1 was the best (13.0 MPa), but a higher concentration up to 13.4 mol L−1 can also be available with a lower pressure at 10 MPa, whereas the formic acid conversion (FAC) was decreased significantly from 88.0% (at 2 mol L−1) to 2.3% (13.4 mol L−1) (Table 1). The decrease of FAC at higher concentration might occur by the decomposition of the Pd/PDA–rGO catalyst during the reaction under high-pressure conditions. Fig. 5(b) shows the SF/FA ratio effects on the high-pressure gas generation. The results revealed that a SF/FA ratio of 1![[thin space (1/6-em)]](https://www.rsc.org/images/entities/char_2009.gif) :
:![[thin space (1/6-em)]](https://www.rsc.org/images/entities/char_2009.gif) 1 is the best for obtaining the highest gas pressure. Further increasing or decreasing the SF/FA ratio would lead to a decline in the gas pressure. It should be noted that in the formic acid solution even without the addition of sodium formate, a gas pressure of 10.5 MPa could also be achieved.
1 is the best for obtaining the highest gas pressure. Further increasing or decreasing the SF/FA ratio would lead to a decline in the gas pressure. It should be noted that in the formic acid solution even without the addition of sodium formate, a gas pressure of 10.5 MPa could also be achieved.
| Sum concentration of FA and SF (mol L−1) | pH value | Gas pressure (MPa) | FAC (%) |
|---|---|---|---|
a Reaction conditions: catalyst, 20 mg; temperature, 80 °C; liquid volume, 6 mL; time, 4 h; FA/SF = 1![[thin space (1/6-em)]](https://www.rsc.org/images/entities/char_2009.gif) : :![[thin space (1/6-em)]](https://www.rsc.org/images/entities/char_2009.gif) 1, FAC, formic acid conversion. 1, FAC, formic acid conversion.
|
|||
| 2 | 3.48 | 12.4 | 88.0 |
| 4 | 3.52 | 13.0 | 37.8 |
| 8 | 3.62 | 11.9 | 9.3 |
| 13.4 | 3.80 | 10.4 | 2.3 |
Based on the above results, we further optimized the reaction conditions to obtain the highest gas pressure. As shown in Table 2 and Fig. 6, when increasing the catalyst amount to 50 mg and using a high liquid volume of 7 mL, a 23 MPa of gas pressure with 50.3% FAC was achieved at 80 °C. Although a higher FA concentration is adverse to the FA decomposition as already shown in Fig. 5(a), a simultaneous increase in the FA concentration and catalyst amount led to a significant increase in the obtained gas pressure. When the FA concentration was increased to 6.7 mol L−1 and the catalyst amount was increased to 100 mg, the highest gas pressure of 36.3 MPa was finally obtained at 80 °C with an initial elevation pressure rate of 60.7 MPa h−1 even though the FAC was 19.8% for 4 h. To the best of our knowledge, this is the highest record obtained with the heterogeneous catalyst to date. The generated gas under this condition consists of 50.2% H2 and 49.8% CO2 without CO by GC-TCD analyses. The detected percentage of hydrogen was slightly higher than that of CO2, which was probably because a part of the CO2 was dissolved into the solution. The increasing FA concentration did not prohibit the high-pressure hydrogen evolution, which is probably because of the use of a large amount of catalyst which partly compensates the deactivation of the catalyst in high concentration FA solution.
| Entry | Conditions | Results | |||||
|---|---|---|---|---|---|---|---|
| Catalyst amount mg | FA concentration mol L−1 | Volume mL | Gas pressure (MPa) | FAC (%) | H2 (%) | CO2 (%) | |
a Reaction conditions: SF/FA = 1![[thin space (1/6-em)]](https://www.rsc.org/images/entities/char_2009.gif) : :![[thin space (1/6-em)]](https://www.rsc.org/images/entities/char_2009.gif) 1; temperature, 80 °C; time, 4 h; FAC, formic acid conversion. 1; temperature, 80 °C; time, 4 h; FAC, formic acid conversion.
|
|||||||
| 1 | 50 | 2 | 7 | 23.0 | 50.3 | 50.8 | 49.2 |
| 2 | 100 | 4 | 6 | 28.6 | 44.1 | 50.4 | 49.6 |
| 3 | 100 | 6.7 | 6 | 36.3 | 19.8 | 50.2 | 49.8 |
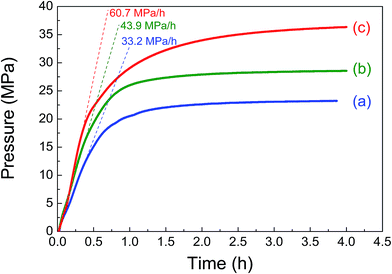 | ||
| Fig. 6 Gas pressure (solid lines) and initial pressure increasing rate (dash lines) versus time obtained from the decomposition of formic acid with various reaction conditions (reaction conditions for (a), (b) and (c) are the same as entries 1, 2 and 3 in Table 2, respectively). | ||
3.2. Recyclability of the Pd/PDA–rGO
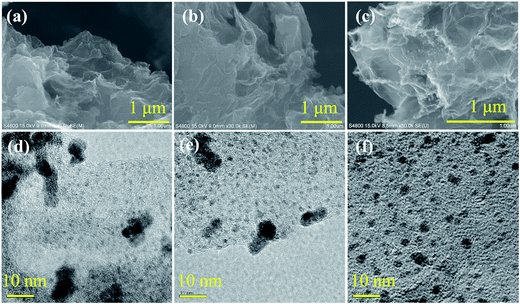
For the industrial application of this high-pressure generation in the presence of a heterogeneous catalyst, we examined the catalyst recyclability. In Table 3, the results of the high-pressure gas generation are summarized with fresh and recovered catalysts without any treatment under different reaction conditions (concentration, liquid volume and catalyst amount). All the gas pressures obtained in the presence of the recovered catalyst were comparatively lower than their counterparts using the fresh ones, which suggests a deactivation after the reaction. Furthermore, this deactivation phenomenon was prominent in low formic acid concentration (Table 2). However, XRD, TEM and SEM analyses did not find clear changes between the catalysts before and after the reaction (Fig. 7(a), (b), (d) and (e) and ESI: Fig. S5†). No Pd leaching was detected in the solution after the reaction in 2 mol L−1 formic acid (SF/FA = 1![[thin space (1/6-em)]](https://www.rsc.org/images/entities/char_2009.gif) :
:![[thin space (1/6-em)]](https://www.rsc.org/images/entities/char_2009.gif) 1) with 50 mg catalyst by ICP analysis and nullified the reason behind the deactivation. In addition, N2 adsorption analysis showed that the BET surface areas of the catalyst before and after the reaction were 11 and 20 m2 g−1, respectively (ESI: Table S1†). The determined surface area of the Pd/PDA–rGO catalyst is relatively small, and probably has negligible contribution to the high catalytic activity. On the other hand FT-IR analyses (Fig. 8(a) and (b)) indicate that the asymmetric C–N stretching (1220 cm−1) and aromatic C–C stretching (1510 cm−1) vibration peaks remained almost unchanged after the reaction, while the N–H bending and N–H stretching vibration peaks at 1575 and 3400 cm−1, respectively, decreased. A new absorption peak at 1680 cm−1 was formed after the reaction, which might be attributed to the C
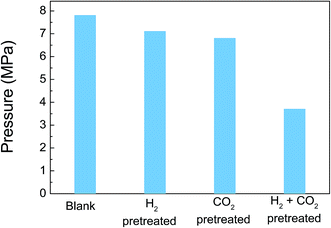
1) with 50 mg catalyst by ICP analysis and nullified the reason behind the deactivation. In addition, N2 adsorption analysis showed that the BET surface areas of the catalyst before and after the reaction were 11 and 20 m2 g−1, respectively (ESI: Table S1†). The determined surface area of the Pd/PDA–rGO catalyst is relatively small, and probably has negligible contribution to the high catalytic activity. On the other hand FT-IR analyses (Fig. 8(a) and (b)) indicate that the asymmetric C–N stretching (1220 cm−1) and aromatic C–C stretching (1510 cm−1) vibration peaks remained almost unchanged after the reaction, while the N–H bending and N–H stretching vibration peaks at 1575 and 3400 cm−1, respectively, decreased. A new absorption peak at 1680 cm−1 was formed after the reaction, which might be attributed to the C![[double bond, length as m-dash]](https://www.rsc.org/images/entities/char_e001.gif) O stretching vibration contained in the amide species.23 These clues suggest that a part of the amine groups transformed into amide groups after the reaction, which is probably one of the reasons for the deactivation of the catalyst. Further analysis of the IR spectra of the catalysts obtained after reactions conducted at different temperatures showed similar results (ESI; Fig. S6†). This suggests that the temperature was not the main factor for the transformation of amine into amide. To check whether the high-pressure reaction resulted in the amide formation, formic acid decomposition under atmospheric pressure conditions was conducted, and the results of gas generation and IR spectra of the catalyst after the reaction are shown in Fig. S7† and 8(c), respectively. Since, no obvious peak around 1675 cm−1 appeared in the IR spectra after the reaction, it suggests that the change of amine into amide was probably because of the high-pressure H2 and/or CO2, which affected the Pd/PDA–rGO catalyst. To clarify the high-pressure gas effects on the Pd/PDA–rGO catalyst activity, the catalyst was pretreated with high-pressure H2, CO2, or H2 + CO2, respectively, and the results are shown in Fig. 9. Either H2 or CO2 gas alone does not obviously affect the catalytic activity, whereas H2 and CO2 gases together do. From this result, it is understood that PDA would react with CO2 under high-pressure conditions, and then is transformed to carbonate salts which can re-generate PDA after releasing CO2, whereas with H2 and CO2, PDA reacts with CO2 to form carbamate salt, and then PDA carbamate salt might be catalyzed by Pd nano-particles with H2 into amide or urea.24,25 Thus, PDA as a stabilizer of Pd nano-particles on rGO would lose its function and hence Pd nano-particles would become less active.
O stretching vibration contained in the amide species.23 These clues suggest that a part of the amine groups transformed into amide groups after the reaction, which is probably one of the reasons for the deactivation of the catalyst. Further analysis of the IR spectra of the catalysts obtained after reactions conducted at different temperatures showed similar results (ESI; Fig. S6†). This suggests that the temperature was not the main factor for the transformation of amine into amide. To check whether the high-pressure reaction resulted in the amide formation, formic acid decomposition under atmospheric pressure conditions was conducted, and the results of gas generation and IR spectra of the catalyst after the reaction are shown in Fig. S7† and 8(c), respectively. Since, no obvious peak around 1675 cm−1 appeared in the IR spectra after the reaction, it suggests that the change of amine into amide was probably because of the high-pressure H2 and/or CO2, which affected the Pd/PDA–rGO catalyst. To clarify the high-pressure gas effects on the Pd/PDA–rGO catalyst activity, the catalyst was pretreated with high-pressure H2, CO2, or H2 + CO2, respectively, and the results are shown in Fig. 9. Either H2 or CO2 gas alone does not obviously affect the catalytic activity, whereas H2 and CO2 gases together do. From this result, it is understood that PDA would react with CO2 under high-pressure conditions, and then is transformed to carbonate salts which can re-generate PDA after releasing CO2, whereas with H2 and CO2, PDA reacts with CO2 to form carbamate salt, and then PDA carbamate salt might be catalyzed by Pd nano-particles with H2 into amide or urea.24,25 Thus, PDA as a stabilizer of Pd nano-particles on rGO would lose its function and hence Pd nano-particles would become less active.
| FA concentration (mol L−1) | Liquid volume (mL) | Catalyst amount (mg) | Gas pressure (MPa) | |
|---|---|---|---|---|
| Fresh catalyst | Recovered catalyst | |||
a Reaction conditions: temperature, 80 °C; time, 4 h; SF/FA = 1![[thin space (1/6-em)]](https://www.rsc.org/images/entities/char_2009.gif) : :![[thin space (1/6-em)]](https://www.rsc.org/images/entities/char_2009.gif) 1. 1.
|
||||
| 1 | 6 | 20 | 12.4 | 5.3 |
| 2 | 6 | 20 | 13.0 | 5.1 |
| 6.7 | 7 | 10 | 10.0 | 8.2 |
3.3. Catalyst re-activation
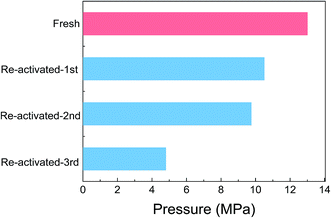
As discussed above with IR analysis of the used catalyst, the amino groups of PDA, the amine, are transformed into amide groups or others during the reaction. To improve the recyclability of the catalyst, the hydrolysis of the amide group into the amine group on the catalyst under basic conditions was investigated. Although CO was not detected in the dehydrogenation of formic acid with the Pd/PDA–rGO catalyst, a trace amount of CO generation on the surface of the catalyst might cause the deactivation of the catalyst. Therefore, calcination of the catalyst at elevated temperature to remove the possibly absorbed CO to re-activate the catalyst was also investigated. Although the FT-IR analysis results showed that the C![[double bond, length as m-dash]](https://www.rsc.org/images/entities/char_e001.gif) O absorption peak was successfully removed after re-activating the catalyst in 1 mol L−1 NaOH at 60 °C for 2 h (ESI; Fig. S8†), the obtained gas pressure with the NaOH treated catalyst was even lower than the used catalyst without any re-activation (ESI; Fig. S9†). On the other hand, calcination of the catalyst at 200 °C for 2.5 h has a positive effect on re-activating the catalyst. Interestingly, a synergic effect was observed when the catalyst was re-activated with first NaOH treatment and then calcination (two-step method), and an 11 MPa gas pressure was obtained with the two-step treated catalyst, which is much higher than that obtained with the used catalyst without re-activation. However, this pressure was still lower than that obtained with the fresh catalyst. Then, a cycling test of the used catalyst with the two-step re-activation method was conducted. The catalyst after each reaction was recovered and re-activated by the two-step method before the next reaction. As shown in Fig. 10, the gas pressure obtained with the re-activated catalyst continuously decreased with the increase in the re-activation cycles. The gas pressure decreased to 4.8 MPa after 3 cycles, suggesting that the catalyst was not stable during the FA decomposition. FT-IR analysis of the catalyst before and after the reaction after each re-activation cycle revealed that the aromatic C–C absorption peak disappeared after the re-activation several times (ESI; Fig. S10†), suggesting that the diamine group in the catalyst was probably decomposed during the re-activation steps. From the SEM and TEM images of the re-activated catalyst after the FA decomposition reaction for 3 cycles (Fig. 7(c) and (f)), it can be seen that the Pd particle size increased obviously, which is probably caused by the calcination treatment and the loss of the PDA stabilizer.
O absorption peak was successfully removed after re-activating the catalyst in 1 mol L−1 NaOH at 60 °C for 2 h (ESI; Fig. S8†), the obtained gas pressure with the NaOH treated catalyst was even lower than the used catalyst without any re-activation (ESI; Fig. S9†). On the other hand, calcination of the catalyst at 200 °C for 2.5 h has a positive effect on re-activating the catalyst. Interestingly, a synergic effect was observed when the catalyst was re-activated with first NaOH treatment and then calcination (two-step method), and an 11 MPa gas pressure was obtained with the two-step treated catalyst, which is much higher than that obtained with the used catalyst without re-activation. However, this pressure was still lower than that obtained with the fresh catalyst. Then, a cycling test of the used catalyst with the two-step re-activation method was conducted. The catalyst after each reaction was recovered and re-activated by the two-step method before the next reaction. As shown in Fig. 10, the gas pressure obtained with the re-activated catalyst continuously decreased with the increase in the re-activation cycles. The gas pressure decreased to 4.8 MPa after 3 cycles, suggesting that the catalyst was not stable during the FA decomposition. FT-IR analysis of the catalyst before and after the reaction after each re-activation cycle revealed that the aromatic C–C absorption peak disappeared after the re-activation several times (ESI; Fig. S10†), suggesting that the diamine group in the catalyst was probably decomposed during the re-activation steps. From the SEM and TEM images of the re-activated catalyst after the FA decomposition reaction for 3 cycles (Fig. 7(c) and (f)), it can be seen that the Pd particle size increased obviously, which is probably caused by the calcination treatment and the loss of the PDA stabilizer.
To further study the deactivation mechanism of the catalyst, a PdAu/PDA–rGO catalyst was newly synthesized by co-precipitating Au with Pd using the same method for Pd/PDA–rGO synthesis. The results showed that an 18.5 MPa gas pressure can be obtained with the PdAu/PDA–rGO catalyst, which is much higher than that obtained with the Pd/PDA–rGO catalyst (13.0 MPa) under the same reaction conditions (ESI; Fig. S11†), suggesting that the PdAu/PDA–rGO has a better catalytic activity in promoting the FA decomposition. However, the PdAu/PDA–rGO catalyst is subjected to the same durability problem as the Pd/PDA–rGO catalyst, indicating that the unstable supporting material of PDA–rGO under high-pressure is the main problem that causes the deactivation in the catalytic activity. Thus, the condition of high-pressure H2 and CO2 mixture in the formic acid decomposition needs to be seriously considered and methods to improve the catalyst lifetime are highly desirable and is the topic of our future research.
4. Conclusion
In this work, a diamine-alkalized reduced graphene oxide supported palladium nano-particle catalyst (Pd/PDA–rGO) was synthesized and its effect on automatic high-pressure hydrogen generation from the decomposition of formic acid was investigated. Reaction parameters, especially the liquid volume, had a significant influence on the obtained gas pressure. Evidently, large liquid volume and high formic acid concentration were preferred for high-pressure hydrogen generation. A 36.3 MPa total gas pressure was successfully achieved by decomposing a solution mixture of 6.7 mol L−1 formic acid and 6.7 mol L−1 sodium formate at 80 °C. High-pressure H2 and CO2 might cause possible deactivation of the Pd/PDA–rGO catalyst probably due to the transformation of the amine group contained in the catalyst to the amide group. This study requires further investigation on the structure–activity relationship, which is currently underway.Acknowledgements
The authors would like to acknowledge the financial support of Japan Science and Technology Agency (JST), CREST, and the International Joint Research Program for Innovative Energy Technology of the Ministry of Economy, Trade, and Industry (METI), Japan.References
- K. Mazloomi and C. Gomes, Renewable Sustainable Energy Rev., 2012, 16, 3024–3033 CrossRef CAS.
- G. Cipriani, V. Di Dio, F. Genduso, D. La Cascia, R. Liga, R. Miceli and G. R. Galluzzo, Int. J. Hydrogen Energy, 2014, 39, 8482–8494 CrossRef CAS.
- U. Eberle, M. Felderhoff and F. Schuth, Angew. Chem., Int. Ed., 2009, 48, 6608–6630 CrossRef CAS PubMed.
- J. Sculley, D. Q. Yuan and H. C. Zhou, Energy Environ. Sci., 2011, 4, 2721–2735 CAS.
- L. Zhou, Renewable Sustainable Energy Rev., 2005, 9, 395–408 CrossRef CAS.
- H. L. Jiang, S. K. Singh, J. M. Yan, X. B. Zhang and Q. Xu, Chemsuschem, 2010, 3, 541–549 CrossRef CAS PubMed.
- M. Yadav and Q. Xu, Energy Environ. Sci., 2012, 5, 9698–9725 CAS.
- S. Enthaler, J. von Langermann and T. Schmidt, Energy Environ. Sci., 2010, 3, 1207–1217 CAS.
- M. Grasemann and G. Laurenczy, Energy Environ. Sci., 2012, 5, 8171–8181 CAS.
- J. F. Hull, Y. Himeda, W. H. Wang, B. Hashiguchi, R. Periana, D. J. Szalda, J. T. Muckerman and E. Fujita, Nat. Chem., 2012, 4, 383–388 CrossRef CAS PubMed.
- A. K. Singh, S. Singh and A. Kumar, Catal. Sci. Technol., 2016, 6, 12–40 Search PubMed.
- J. Alazemi and J. Andrews, Renewable Sustainable Energy Rev., 2015, 48, 483–499 CrossRef CAS.
- M. Ozsaban, A. Midilli and I. Dincer, Int. J. Hydrogen Energy, 2011, 36, 11440–11450 CrossRef CAS.
- T. Q. Hua, R. K. Ahluwalia, J. K. Peng, M. Kromer, S. Lasher, K. McKenney, K. Law and J. Sinha, Int. J. Hydrogen Energy, 2011, 36, 3037–3049 CrossRef CAS.
- K. Tedsree, T. Li, S. Jones, C. W. A. Chan, K. M. K. Yu, P. A. J. Bagot, E. A. Marquis, G. D. W. Smith and S. C. E. Tsang, Nat. Nanotechnol., 2011, 6, 302–307 CrossRef CAS PubMed.
- X. C. Yang, P. Pachfule, Y. Chen, N. Tsumori and Q. Xu, Chem. Commun., 2016, 52, 4171–4174 RSC.
- N. Wang, Q. M. Sun, R. S. Bai, X. Li, G. Q. Guo and J. H. Yu, J. Am. Chem. Soc., 2016, 138, 7484–7487 CrossRef CAS PubMed.
- I. Mellone, F. Bertini, M. Peruzzini and L. Gonsalvi, Catal. Sci. Technol., 2016, 6, 6504–6512 CAS.
- M. Iguchi, Y. Himeda, Y. Manaka, K. Matsuoka and H. Kawanami, Chemcatchem, 2016, 8, 886–890 CrossRef CAS.
- M. Iguchi, Y. Himeda, Y. Manaka and H. Kawanami, Chemsuschem, 2016, 9, 2749–2753 CrossRef CAS PubMed.
- F. Z. Song, Q. L. Zhu, N. Tsumori and Q. Xu, ACS Catal., 2015, 5, 5141–5144 CrossRef CAS.
- Q. L. Zhu, N. Tsumori and Q. Xu, J. Am. Chem. Soc., 2015, 137, 11743–11748 CrossRef CAS PubMed.
- V. Yatsyna, D. J. Bakker, R. Feifel, A. M. Rijs and V. Zhaunerchyk, J. Chem. Phys., 2016, 145, 8 CrossRef PubMed.
- R. A. Khatri, S. S. C. Chuang, Y. Soong and M. Gray, Energy Fuels, 2006, 20, 1514–1520 CrossRef CAS.
- S. L. Peterson, S. M. Stucka and C. J. Dinsmore, Org. Lett., 2010, 12, 1340–1343 CrossRef CAS PubMed.
Footnote |
| † Electronic supplementary information (ESI) available. See DOI: 10.1039/c7se00131b |
| This journal is © The Royal Society of Chemistry 2017 |

