Highly efficient and durable water oxidation in a near-neutral carbonate electrolyte electrocatalyzed by a core–shell structured NiO@Ni–Ci nanosheet array†
Min
Ma
ab,
Yiwei
Liu
b,
Xiao
Ma
b,
Ruixiang
Ge
b,
Fengli
Qu
c,
Zhiang
Liu
c,
Gu
Du
d,
Abdullah M.
Asiri
 e,
Yadong
Yao
*a and
Xuping
Sun
 *b
*b
aCollege of Materials Science and Engineering, Sichuan University, Chengdu 610064, Sichuan, China. E-mail: yaoyd523@163.com
bCollege of Chemistry, Sichuan University, Chengdu 610064, Sichuan, China. E-mail: sunxp@scu.edu.cn
cCollege of Chemistry and Chemical Engineering, Qufu Normal University, Qufu 273165, Shandong, China
dChengdu Institute of Geology and Mineral Resources, Chengdu 610081, Sichuan, China
eChemistry Department, Faculty of Science, King Abdulaziz University, Jeddah 21589, Saudi Arabia
First published on 19th May 2017
Abstract
The development of cost-effective and high-performance water oxidation electrocatalysts operating in carbonate (Ci) electrolytes is highly desired but still remains a great challenge. In this communication, we report the in situ electrochemical development of an amorphous Ni–Ci layer on a NiO nanosheet array supported on carbon cloth (NiO@Ni–Ci/CC) as a 3D catalyst electrode for water oxidation in 1.0 M KHCO3 (pH: 8.3). To drive a geometrical catalytic current density of 15 mA cm−2, such core–shell structured NiO@Ni–Ci/CC only demands an overpotential of 387 mV, with its catalytic activity being maintained for at least 25 h. And at an overpotential of 500 mV, this catalyst electrode achieves a high turnover frequency of 0.18 mol O2 per s.
The exploitation of clean and sustainable energy systems is in great need to solve the issues of the increasing global energy demand due to the depletion of fossil fuels and their consequent environmental pollution.1,2 As a renewable and carbon-neutral energy carrier, hydrogen is regarded as an ideal alternative to fossil fuels in the future. Electrocatalytic water splitting offers a simple technique for large-scale production of pure hydrogen.3–5 The anodic oxygen evolution reaction (OER) is identified as the critical bottleneck of water splitting because of the involvement of the multi-electron transfer process, imposing serious overpotential requirement and limiting the efficiency of hydrogen production.6–8 Ru and Ir oxides, the most active water oxidation catalysts (WOCs), however, suffer from low abundance and high cost, hindering their large-scale commercial uses.9 As such, it is extremely attractive to design and develop earth-abundant alternatives.
Proton exchange membrane-based water electrolysis units10 and commercial alkaline water electrolysis11 operate at extreme pH, causing serious corrosion issues and limiting the types of electrodes and cell components that can be used.12 Microbial electrolysis cells13 and electrochemical conversion of CO2 into fuels or chemical products14–16 demand WOCs under benign conditions and earth-abundant such WOCs are thus also highly desirable. Transition metal phosphates17–19 and borates20–22 have been widely studied as efficient catalysts for water oxidation in neutral phosphate and near-neutral borate electrolytes, respectively. Carbonate is another environmentally friendly electrolyte which is potentially advantageous in combining water oxidation with CO2 reduction.23 Given that nanoarrays are favorable to enhanced catalytic activity due to more exposed active sites and facilitated diffusion of the electrolyte and gas evolved,24,25 they are highly attractive but it still remains challenging to develop transition metal carbonate-based nanoarrays for water oxidation electrocatalysis under mild conditions.
In this communication, we report that an amorphous Ni–Ci layer (6–8 nm in thickness) can be in situ developed on a crystalline NiO nanosheet array supported on carbon cloth via oxidative polarization in KHCO3 (K–Ci). As a 3D durable catalyst electrode for water oxidation in 1.0 M K–Ci, such core–shell structured NiO@Ni–Ci/CC shows high activity with the need of an overpotential of only 387 mV to drive a geometrical catalytic current density of 15 mA cm−2, 58 mV less than that of NiO/CC, and its catalytic activity can be maintained for at least 25 h. Besides, this catalyst achieves a high turnover frequency of 0.18 mol O2 per s at an overpotential of 500 mV.
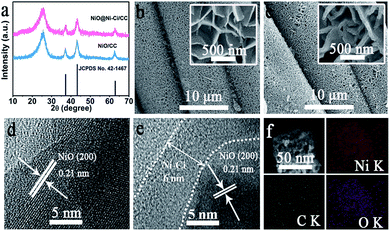
NiO@Ni–Ci/CC was electrochemically derived from NiO/CC in 1.0 M K–Ci26–30 (see ESI† for more details). Fig. 1a shows the X-ray diffraction (XRD) patterns of NiO/CC and NiO@Ni–Ci/CC. As observed, NiO/CC presents three diffraction peaks at 37.2°, 43.3° and 62.9° indexed to the (111), (200) and (220) planes of NiO (JCPDS no. 42-1467), respectively, and other peaks arise from the CC substrate. NiO@Ni–Ci/CC also shows characteristic peaks of NiO but with slightly decreased peak intensities, implying the formation of amorphous species on the NiO surface. Fig. 1b presents the scanning electron microscopy (SEM) images of NiO/CC, indicating that the entire CC is fully covered by the NiO nanosheet array. Surprisingly, the as-prepared NiO@Ni–Ci/CC still retains its initial nanoarray feature but with thicker nanosheets (Fig. 1c). The energy-dispersive X-ray (EDX) spectrum (Fig. S1†) confirms the existence of Ni, C and O elements. The high-resolution transmission electron microscopy (HRTEM) image of the NiO nanosheet (Fig. 1d) reveals well-resolved lattice fringes with an interplanar distance of 0.21 nm corresponding to the (200) plane of the NiO phase.31 The HRTEM image of NiO@Ni–Ci confirms the generation of an amorphous shell about 6–8 nm in thickness (Fig. 1e). The EDX elemental mapping images (Fig. 1f) further verify the uniform distribution of Ni, C and O elements in the resulting NiO@Ni–Ci product.
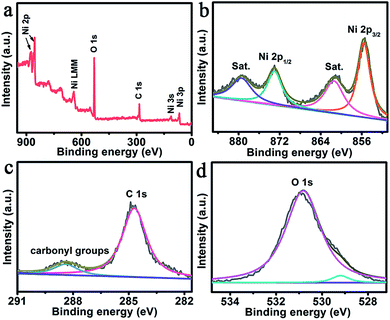
Fig. 2a shows the X-ray photoelectron spectroscopy (XPS) survey spectrum of NiO@Ni–Ci, also confirming the presence of Ni, C and O elements. As presented in Fig. 2b, the binding energies (BEs) at 855.6 and 873.1 eV in the Ni 2p region are assigned to Ni 2p3/2 and Ni 2p1/2, respectively, which verifies the existence of Ni2+ or Ni3+ bound to oxygen.32,33 The peaks at 861.4 and 879.4 eV with two shakeup satellites (identified as “Sat.”) arise from Ni2+ or Ni3+. We also collected the XPS spectra of NiO (Fig. S2†). The Ni 2p BE of NiO@Ni–Ci has a positive shift compared with that of NiO, suggesting that Ni from Ni–Ci possesses a higher valence state. In the C 1s region (Fig. 2c), the peak at 284.7 eV is observed and another one at 288.4 eV arises from the –C(O)O– group in our product.23 The weak peak at 529.2 eV in the O 1s region is assigned to O in NiO and carbonate, and the BE at 530.8 eV is attributed to the –OH in carbonate (Fig. 2d).34 These analyses confirm that the amorphous layer is Ni–Ci in nature. The in situ formation of the core–shell structured NiO@Ni–Ci nanosheet array from the NiO nanoarray could be rationally explained as follows. Ni at the NiO surface is electrochemically oxidized into higher oxidation valence states in the process of oxidative polarization, and Ci anions in K–Ci solution interact with such Ni cations for charge compensation, leading to the in situ precipitation of Ni–Ci onto the NiO surface. Such a process can proceed repeatedly until the complete coverage of the NiO surface by the amorphous Ni–Ci layer, leading to the formation of the NiO@Ni–Ci core–shell structure, finally.
 | ||
| Fig. 2 (a) XPS survey spectrum of NiO@Ni–Ci. XPS spectra of NiO@Ni–Ci in the (b) Ni 2p, (c) C 1s and (d) O 1s regions. | ||
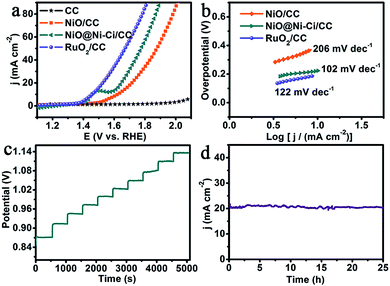
We examined the electrocatalytic water oxidation activity of NiO@Ni–Ci/CC (Ni–Ci loading: 1.8 mg cm−2) using a typical three-electrode setup in 1.0 M K–Ci (pH: 8.3). Because the first sweep of linear sweep voltammetry (LSV) measurements is always unstable owing to the effect of residual currents and capacitance currents, we adopted the second one for all the polarization curves.35 In order to eliminate the effect of ohmic resistance and thus reflect the intrinsic behavior of catalysts, we applied iR correction to all initial experimental data except specifically explained,36 and all potentials were reported on a reversible hydrogen electrode (RHE) scale unless particularly stated. For comparison study, blank CC, NiO/CC and RuO2 on CC (RuO2/CC) with approximately identical loading were also measured. Fig. 3a shows the polarization curves. As expected, RuO2/CC is highly active for water oxidation with the need of an overpotential of 265 mV to achieve 15 mA cm−2, whereas blank CC has almost no OER activity. It is to be noted that NiO@Ni–Ci/CC shows superior OER performance at the overpotential of 387 mV to drive a catalytic current density of 15 mA cm−2, 58 mV less than that of NiO/CC (445 mV). It is to be noted that this NiO@Ni–Ci/CC catalyst electrode also compares favorably to the behaviors of reported WOCs operating in neutral or near-neutral electrolytes, such as Ni–Bi/ITO (η1.0 mA cm−2 = 425 mV),20 Fe–Ci/FTO (η10 mA cm−2 = 560 mV),23 NiOx-Cat/GC (η1.15 mA cm−2 = 604 mV),34 Co–Ci/GC (η9.1 mA cm−2 = 771 mV),37 and Cu–Bi/FTO (η1.0 mA cm−2 = 525 mV).38 And a more detailed comparison is listed in Table S1.† We also measured the water oxidation performances of NiO@Ni–Ci/CC and NiO/CC in 1.0 M KOH (Fig. S3†) and found that NiO@Ni–Ci/CC is also superior in activity to NiO/CC. The Tafel plots deriving from the polarization curve were employed to evaluate the OER catalytic kinetics of the as-prepared electrodes. Fig. 3b presents the Tafel plots fitted to the equation (η = b![[thin space (1/6-em)]](https://www.rsc.org/images/entities/char_2009.gif) log
log![[thin space (1/6-em)]](https://www.rsc.org/images/entities/char_2009.gif) j + a, where j is the current density and b is the Tafel slope). NiO@Ni–Ci/CC has a Tafel slope of 102 mV dec−1, smaller than those of RuO2/CC (122 mV dec−1) and NiO/CC (206 mV dec−1), implying more rapid catalytic kinetics for the OER on the NiO@Ni–Ci/CC electrode.36 We also examined the influence of the K–Ci concentration on the water oxidation process. As presented in Fig. S4,† the increased K–Ci concentration from 0.2 to 1.0 M decreases the OER overpotentials because of the increased conductivity of the K–Ci electrolyte.39 To drive a catalytic current density of 15 mA cm−2, overpotentials of 560, 442 and 387 mV are demanded in 0.2, 0.5 and 1.0 M K–Ci, respectively.
j + a, where j is the current density and b is the Tafel slope). NiO@Ni–Ci/CC has a Tafel slope of 102 mV dec−1, smaller than those of RuO2/CC (122 mV dec−1) and NiO/CC (206 mV dec−1), implying more rapid catalytic kinetics for the OER on the NiO@Ni–Ci/CC electrode.36 We also examined the influence of the K–Ci concentration on the water oxidation process. As presented in Fig. S4,† the increased K–Ci concentration from 0.2 to 1.0 M decreases the OER overpotentials because of the increased conductivity of the K–Ci electrolyte.39 To drive a catalytic current density of 15 mA cm−2, overpotentials of 560, 442 and 387 mV are demanded in 0.2, 0.5 and 1.0 M K–Ci, respectively.
Fig. 3c shows the multi-step chronopotentiometric curve of NiO@Ni–Ci/CC with increasing the tested current density from 4 to 40 mA cm−2 (4 mA cm−2 per 500 s). The potential instantly levels off at 0.87 V vs. Ag/AgCl for the initial current value and remains constant for the rest 500 s. All other steps also present analogous results, reflecting the excellent mass transportation properties, conductivity and mechanical robustness of the NiO@Ni–Ci/CC electrode.36,39 We probed the stability of NiO@Ni–Ci/CC by conducting continuous cyclic voltammetry scanning in 1.0 M K–Ci at a scan rate of 100 mV s−1. As observed, the LSV curve after 500 cycles shows negligible loss in current density compared with the initial one (Fig. S5†), and the corresponding XRD and SEM analyses demonstrate that NiO@Ni–Ci still retains its initial phase with the preservation of its morphology feature after the test (Fig. S6†). The time-dependent current density curve at a fixed overpotential of 420 mV (Fig. 3d) suggests that NiO@Ni–Ci/CC can maintain its catalytic activity for at least 25 h, promising its practical applications.
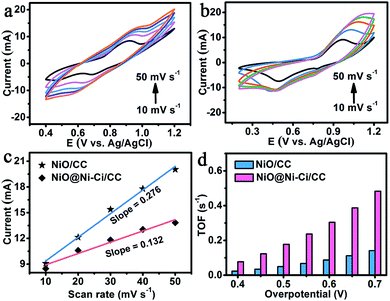
To estimate the electrochemically active surface area (ECSA), we measured the double layer capacitance (Cdl) at the solid/liquid interface of both NiO@Ni–Ci/CC and NiO/CC electrodes using the cyclic voltammetry technique.40 The cyclic voltammograms (CVs) were collected in the region of 1.13–1.23 V vs. Ag/AgCl, where the current response should only be ascribed to the charging and recharging from the double layer (Fig. S7†). Cdl is determined by this following equation: ic = v × Cdl, yielding a Cdl of 13.2 mF cm−2 for NiO@Ni–Ci/CC, much higher than that of NiO/CC (1.6 mF cm−2). This result suggests that NiO@Ni–Ci/CC has a larger surface area and thus more exposed active sites for OER catalysis. As shown in Fig. S8,† we also performed electrochemical impedance spectroscopies for NiO/CC and NiO@Ni–Ci/CC. It suggests that NiO@Ni–Ci/CC possesses a smaller radius of semicircle than that for NiO/CC, implying lower Rct and thus a higher charge-transfer rate and more fast catalytic kinetics on NiO@Ni–Ci/CC.41
We also employed turnover frequency (TOF), associated with generating oxygen molecules per second, to further reflect the intrinsic activity of the as-prepared electrocatalysts at a fixed overpotential.42 To calculate TOF, the concentration of active sites needs to be quantified through electrochemistry according to reported work.43 The CVs of NiO@Ni–Ci/CC (Fig. 4a) and NiO/CC (Fig. 4b) under different scan rates suggest a linear relationship between the oxidation peak currents for redox species and scan rates. The slope is given by the formula: slope = n2F2m/4RT, where n represents the number of electrons transferred which is equal to 1 assuming a one-electron process for the oxidation of metal centers in Ni–Ci,22F is the faradaic constant, m is the number of active species, and R and T are the ideal gas constant and the absolute temperature, respectively (Fig. 4c). Following the equation: TOF = JA/4Fm (J is the current density, A is the geometrical electrode area, and 4 expresses the moles of electron consumption for one mole oxygen evolution), we determined the TOF of NiO@Ni–Ci/CC as 0.18 mol O2 per s at an overpotential of 500 mV, which is much larger than that of NiO/CC (0.05 mol O2 per s) at the same overpotential. More detailed comparison for TOF values between NiO@Ni–Ci/CC and NiO/CC is shown in Fig. 4d. Also it is to be noted that the TOF of NiO@Ni–Ci/CC is higher than those of other reported non-noble-metal WOCs like Ni–Bi/FTO (0.01 mol O2 per s, η = 600 mV),20 NiOx-en/FTO (0.02 mol O2 per s, η = 610 mV),44 and Fe–Bi/ITO (0.17 mol O2 per s, η = 600 mV).45 We also determined the faradaic efficiency (FE) by comparing the quantity of practically evolved oxygen with theoretically calculated oxygen (assuming 100% FE). As observed in Fig. S9,† the approximate agreement of the measured value and theoretical one demonstrates nearly 100% FE for evolution oxygen on the NiO@Ni–Ci/CC electrode.
In summary, a Ni–Ci layer has been successfully in situ developed on a NiO nanosheet array supported on carbon cloth (NiO@Ni–Ci/CC) via oxidative polarization in K–Ci. The core–shell NiO@Ni–Ci/CC behaves as a 3D catalyst electrode for water oxidation with the need of an overpotential of 387 mV to drive a geometrical catalytic current density of 15 mA cm−2 in 1.0 M K–Ci (pH: 8.3). It also demonstrates strong long-term electrochemical durability with a high TOF of 0.18 mol O2 per s at an overpotential of 500 mV. This study is important because it not only provides us an attractive catalyst material for efficient and durable electrochemical water oxidation in carbonate media, but would open up an exciting new avenue to the rational design and fabrication of transition metal carbonate-based nanoarrays46 for electrolysis13–16,47,48 and sensing applications.49–51
Acknowledgements
This work was supported by the National Natural Science Foundation of China (No. 21575137 and 21375076).References
- R. F. Service, Science, 2009, 324, 1257–1259 CrossRef CAS PubMed.
- T. R. Cook, D. K. Dogutan, S. Y. Reece, Y. Surendranath, T. S. Teets and D. G. Nocera, Chem. Rev., 2010, 110, 6474–6502 CrossRef CAS PubMed.
- M. G. Walter, E. L. Warren, J. R. Mckone, S. W. Boettcher, Q. Mi, E. A. Santori and N. S. Lewis, Chem. Rev., 2010, 110, 6446–6473 CrossRef CAS PubMed.
- J. Wang, W. Cui, Q. Liu, Z. Xing, A. M. Asiri and X. Sun, Adv. Mater., 2016, 28, 215–230 CrossRef CAS PubMed.
- X. Zou and Y. Zhang, Chem. Soc. Rev., 2015, 44, 5148–5180 RSC.
- W. Hong, M. Risch, K. A. Stoerzinger, A. Grimaud, J. Suntivich and Y. Shao-Horn, Energy Environ. Sci., 2015, 8, 1404–1427 CAS.
- Q. Yin, J. M. Tan, C. Besson, Y. V. Geletii, D. G. Musaev, A. E. Kuznetsov, Z. Luo, K. I. Hardcastle and C. L. Hill, Science, 2010, 328, 342–345 CrossRef CAS PubMed.
- J. Suntivich, K. J. May, H. A. Gasteiger, J. B. Goodenough and Y. Shao-Horn, Science, 2011, 334, 1383–1385 CrossRef CAS PubMed.
- Y. Lee, J. Suntivich, K. J. May, E. E. Perry and Y. Shao-Horn, J. Phys. Chem. Lett., 2012, 3, 399–404 CrossRef CAS PubMed.
- A. Le Goff, V. Artero, B. Jousselme, P. D. Tran, N. Guillet, R. Métayé, A. Fihri, S. Palacin and M. Fontecave, Science, 2009, 326, 1384–1387 CrossRef CAS PubMed.
- R. L. Leroy, Int. J. Hydrogen Energy, 1983, 8, 401–417 CrossRef CAS.
- M. D. Symes and L. Cronin, Materials for Water Splitting, in Materials for a Sustainable Future, RSC Publishing: Cambridge, UK, 2012, pp. 592–614 Search PubMed.
- A. Kundu, J. N. Sahu, G. Redzwan and M. A. Hashim, Int. J. Hydrogen Energy, 2013, 38, 1745–1757 CrossRef CAS.
- J. P. Torella, C. J. Gagliardi, J. Chen, D. K. Bediako, B. Colón, J. C. Way, P. A. Silver and D. G. Nocera, Proc. Natl. Acad. Sci. U. S. A., 2015, 112, 2337–2342 CrossRef CAS PubMed.
- C. Liu, B. C. Colón, M. Ziesack, P. A. Silver and D. G. Nocera, Science, 2016, 352, 1210–1213 CrossRef CAS PubMed.
- S. Gao, Y. Lin, X. Jiao, Y. Sun, Q. Luo, W. Zhang, D. Li, Y. Yang and Y. Xie, Nature, 2016, 529, 68–71 CrossRef CAS PubMed.
- M. W. Kanan and D. G. Nocera, Science, 2008, 321, 1072–1075 CrossRef CAS PubMed.
- J. G. McAlpin, Y. Surendranath, M. Dinca, T. A. Stich, S. A. Stoian, W. H. Casey, D. G. Nocera and R. D. Britt, J. Am. Chem. Soc., 2010, 132, 6882–6883 CrossRef CAS PubMed.
- A. J. Esswein, Y. Surendranath, S. Y. Reece and D. G. Nocera, Energy Environ. Sci., 2011, 4, 499–504 CAS.
- M. Dincă, Y. Surendranath and D. G. Nocera, Proc. Natl. Acad. Sci. U. S. A., 2010, 107, 10337–10341 CrossRef PubMed.
- D. K. Bediako, C. Costentin, E. C. Jones, D. G. Nocera and J. M. Savéant, J. Am. Chem. Soc., 2013, 135, 10492–10502 CrossRef CAS PubMed.
- D. K. Bediako, Y. Surendranath and D. G. Nocera, J. Am. Chem. Soc., 2013, 135, 3662–3674 CrossRef CAS PubMed.
- F. Li, L. Bai, H. Li, Y. Wang, F. Yu and L. Sun, Chem. Commun., 2016, 52, 5753–5756 RSC.
- J. Tian, Q. Liu, N. Cheng, A. M. Asiri and X. Sun, Angew. Chem., Int. Ed., 2014, 53, 9577–9581 CrossRef CAS PubMed.
- Z. Ren, V. Botu, S. Wang, Y. Meng, W. Song, Y. Guo, R. Ramprasad, S. L. Suib and P. Gao, Angew. Chem., Int. Ed., 2014, 53, 7223–7227 CrossRef CAS PubMed.
- L. Xie, R. Zhang, L. Cui, D. Liu, S. Hao, Y. Ma, G. Du, A. M. Asiri and X. Sun, Angew. Chem., Int. Ed., 2017, 56, 1064–1068 CrossRef CAS PubMed.
- L. Cui, D. Liu, S. Hao, F. Qu, G. Du, J. Liu, A. M. Asiri and X. Sun, Nanoscale, 2017, 9, 3752–3756 RSC.
- X. Ji, L. Cui, D. Liu, S. Hao, J. Liu, F. Qu, Y. Ma, G. Du, A. M. Asiri and X. Sun, Chem. Commun., 2017, 53, 3070–3073 RSC.
- W. Wang, D. Liu, S. Hao, F. Qu, Y. Ma, G. Du, A. M. Asiri, Y. Yao and X. Sun, Inorg. Chem., 2017, 56, 3131–3135 CrossRef CAS PubMed.
- M. Ma, F. Qu, X. Ji, D. Liu, S. Hao, G. Du, A. M. Asiri, Y. Yao, L. Chen and X. Sun, Small, 2017 DOI:10.1002/smll.201700394.
- Q. Luo, M. Peng, X. Sun and A. M. Asiri, Catal. Sci. Technol., 2016, 6, 1157–1161 CAS.
- C. He, X. Wu and Z. He, J. Phys. Chem. C, 2014, 118, 4578–4584 CAS.
- M. Yoshida, Y. Mitsutomi, T. Mineo, M. Nagasaka, H. Yuzawa, N. Kosugi and H. Kondoh, J. Phys. Chem. C, 2015, 119, 19279–19286 CAS.
- K. S. Joya, Y. F. Joya and H. J. M. D. Groot, Adv. Energy Mater., 2014, 4, 1301929 CrossRef.
- C. Tang, A. M. Asiri and X. Sun, Chem. Commun., 2016, 52, 4529–4532 RSC.
- C. Tang, N. Chen, Z. Pu, W. Xing and X. Sun, Angew. Chem., Int. Ed., 2015, 54, 9351–9355 CrossRef CAS PubMed.
- K. S. Joya, K. Takanabe and H. J. M. D. Groot, Adv. Energy Mater., 2014, 4, 1400252 CrossRef.
- F. Yu, F. Li, B. Zhang, H. Li and L. Sun, ACS Catal., 2015, 5, 627–630 CrossRef CAS.
- X. Lu and C. Zhao, Nat. Commun., 2015, 6, 6616 CrossRef CAS PubMed.
- S. Trasatti and O. A. Petrii, J. Electroanal. Chem., 1992, 327, 353–376 CrossRef CAS.
- C. Guo, L. Zhang, J. Miao, J. Zhang and C. Li, Adv. Energy Mater., 2013, 3, 167–171 CrossRef CAS.
- R. M. Ramsundar, J. Debgupta, V. K. Pillai and P. A. Joy, Electrocatalysis, 2015, 6, 331–340 CrossRef CAS.
- Y. Li, L. Zhang, X. Xiang, D. Yan and F. Li, J. Mater. Chem. A, 2014, 2, 13250–13258 CAS.
- A. Singh, S. L. Y. Chang, R. K. Hocking, U. Bach and L. Spiccia, Energy Environ. Sci., 2013, 6, 579–586 CAS.
- D. R. Chowdhury, L. Spiccia, S. S. Amritphale, A. Paul and A. Singh, J. Mater. Chem. A, 2016, 4, 3655–3660 CAS.
- R. Ge, M. Ma, X. Ren, F. Qu, Z. Liu, G. Du, A. M. Asiri, L. Chen, B. Zheng and X. Sun, Chem. Commun., 2017 10.1039/c7cc03146g.
- L. Xie, F. Qu, Z. Liu, X. Ren, S. Hao, R. Ge, G. Du, A. M. Asiri, X. Sun and L. Chen, J. Mater. Chem. A, 2017, 5, 7806–7810 CAS.
- X. Ren, R. Ge, Y. Zhang, D. Liu, D. Wu, X. Sun, B. Du and Q. Wei, J. Mater. Chem. A, 2017, 5, 7291–7294 CAS.
- T. Chen, D. Liu, W. Lu, K. Wang, G. Du, A. M. Asiri and X. Sun, Anal. Chem., 2016, 88, 7885–7889 CrossRef CAS PubMed.
- Z. Wang, X. Cao, D. Liu, S. Hao, G. Du, A. M. Asiri and X. Sun, Chem. Commun., 2016, 52, 14438–14441 RSC.
- Z. Wang, X. Cao, D. Liu, S. Hao, R. Kong, G. Du, A. M. Asiri and X. Sun, Chem.–Eur. J., 2017, 23, 4986–4989 CrossRef CAS PubMed.
Footnote |
| † Electronic supplementary information (ESI) available: Experimental section and supplementary figures. See DOI: 10.1039/c7se00218a |
| This journal is © The Royal Society of Chemistry 2017 |


