Controlled growth of polythiophene nanofibers in TiO2 nanotube arrays for supercapacitor applications†
Rohan B.
Ambade
a,
Swapnil B.
Ambade
a,
Nabeen K.
Shrestha
 b,
Rahul R.
Salunkhe
c,
Wonjoo
Lee
d,
Sushil S.
Bagde
a,
Jung Ho
Kim
e,
Florian J.
Stadler
 *f,
Yusuke
Yamauchi
*ce and
Soo-Hyoung
Lee
*a
aSchool of Semiconductor and Chemical Engineering, Chonbuk National University, 567 Baekje-daero, Jeonju 54896, Republic of Korea. E-mail: shlee66@jbnu.ac.kr
bDepartment of Chemistry, Hanyang University, 17 Haendang-dong, Sungdong-ku, Seoul 133-791, Republic of Korea
cInternational Centre for Materials Nanoarchitectonics (MANA), National Institute for Materials Science (NIMS), 1-1 Namiki, Tsukuba, Ibaraki 305-0044, Japan. E-mail: Yamauchi.Yusuke@nims.go.jp
dDepartment of Defense Ammunitions, Daeduk College, Daejeon, 305-715, Republic of Korea
eAustralian Institute for Innovative Materials (AIIM), University of Wollongong, Squires Way, North Wollongong, NSW 2500, Australia. E-mail: yusuke@uow.edu.au
fNanshan District Key Laboratory for Biopolymers and Safety Evaluation, College of Materials Science and Engineering, Shenzhen University, Shenzhen 518060, PR China. E-mail: fjstadler@szu.edu.cn
First published on 10th November 2016
Abstract
One-dimensional (1D) nanostructured materials have attracted intense interest because they are superior for applications when compared to their bulk counterparts, owing to their unique and fascinating properties. We thus demonstrate the development of conducting 1D polythiophene (PTh) nanofibers in hollow TiO2 nanotube arrays (TNTs) by controlling nucleation and growth during the electropolymerization of the thiophene monomer. The progression of nanofiber (NF) formation in the hollow interiors of the TNTs follows a three-dimensional instantaneous nucleation and growth mode, in which the polymer grows at a rate that does not allow for the build-up of the polymer on new polymerization sites, but only on existing ones. The formation of highly conductive dienes of PTh is confirmed, with increased conjugation in PTh NFs grown in the confined matrix of TNTs. These 1D PTh–TNT NFs show potential as a promising supercapacitor electrode material, exhibiting a high specific capacitance of 1052 F g−1, which clearly highlights their importance as potential next-generation charge storage entities.
Introduction
Currently, device miniaturization, the ultimate goal for actualizing device performance and efficiency, is one of the most important current challenges in science and technology. Significant progress in one-dimensional nanostructures (1D-NS) with nanoscale and molecular scale properties for the demands of the 21st century has been achieved. 1D-NS such as rods, tubes, wires, and fibers represent the smallest dimensional structures that are usable for efficient charge transport.1,2 Also, 1D-NS offer fascinating electronic, optical, and magnetic properties, a large specific surface area, and high mechanical strength.1 Thus, these materials are expected to be crucial for the next generation of nanoscale-based device applications.Ever since the discovery of conducting polymers (CPs),3,4 extensive studies have shown their great promise for various applications, such as light emitting diodes, chemical sensors, photovoltaics, batteries, and supercapacitors.5 It is well documented that the physical properties of CPs that modulate the performance of the aforementioned optoelectronic devices are strongly influenced by the molecular orientation, organization, and geometry of the CPs.5,6 Thus, research efforts have been intensified to develop materials with well-defined configurations and improved physical properties. Moreover, to improve the device performance, CPs have to be mostly in a nanostructured form. This is because nanoscale CPs offer high specific surface areas, and therefore, can improve redox-mediated charge storage capacity in batteries and supercapacitors.7
Several general methods are available to synthesize CP nanostructures. The most common of these are template synthesis,8–12 chiral reactions,13 self-assembly,14 interfacial polymerization,15,16 and electrospinning.17 Among them, template-synthesis is an effective route to synthesize nanofibrils/nanotubes of various polymers,6,8,9 in which control of the homogeneity, length, and diameter of the polymer fibers/tubes can be achieved by an appropriate choice of the template, thus making the process cheap and simple.6 Since the early reports,18 vertically oriented TiO2 nanotube arrays (TNTs) have received much interest due to their high surface area and efficient charge transport properties.19 In contrast to their porous alumina counterparts,6,20 semiconducting TNTs as templates offer multifunctionality regarding scaffolding, as well as offering various electronic contributions, such as conductivity19 to the polymers that formed in them, which also makes them prospective templates for the development of 1D nanostructured CPs. The template synthesis of CPs primarily necessitates the infiltration of solution-phase precursors into tubes (TNTs), followed by selective nucleation and subsequent growth. A few attempts have been made towards using electrochemical synthesis to infiltrate CPs such as poly(3,4-ethylenedioxythiophene) [PEDOT],21 polypyrrole (PpY),22 or polyaniline (PANI)23 into TNTs. Kowalski et al. demonstrated the formation of PEDOT nanopores by employing critically selective potentiostatic electrodeposition, where the filling was driven by the potential applied to the electrode.21 Furthermore, they also demonstrated the formation of PpY self-organized nanopore arrays by pulse controlled electropolymerization.22 While the semiconducting nature of TNTs can be beneficial towards nucleation of the precursor infiltrated into the tube walls, on the other hand, it complicates electrochemical filling of the tubes.24 Thus, the formation of interdigitated polymeric 1D NS remains a challenge. Studies so far suggest that success in the template-assisted development of 1D polymer NS has a major influence on how effectively interactions between the tubular walls of the TNTs and the infiltrating polymer are carried out, which is an attribute of control over polymerization. Furthermore, another fundamental factor that leads to the formation of 1D NS is the monomer concentration. For example, when the monomer concentration is high, it leads to rigid NS, while long and nanoporous NS are typically formed when the concentration is low.6
Herein, we report the facile formation of 1D polythiophene nanofibers (PTh-NFs) by controlled electropolymerization in arrays of the hollow 1D nanotubular TNTs (Scheme 1). PTh has often been considered as a model for the study of charge transport in CPs with a non-degenerate ground state, while, on the other hand, its high environmental stability (doped and undoped) and structural versatility have led to various applications, including conductors, electrode materials, and organic semiconductors.25 Nevertheless, PTh does not easily favour intrinsic (template-free) 1D nano-fibrillar growth. Electropolymerization is suitable for preparing electrode-type CPs,26 as it allows for control of their thickness and morphology on the working electrode.27 The striking advantages of this method are the absence of a catalyst and the direct grafting of doped CPs onto the electrode surface (obligatory for electrochemical applications). These allow easy control of the film thickness by the deposition charge and the possibility of performing an in situ characterization of the growth process of the polymer by electrochemical or spectroscopic techniques.25 Previous findings showed that electrochemical polymerization leads to nucleation and growth on the TNT pore walls, resulting in a transition from tubules to fibers as polymerization progresses.22
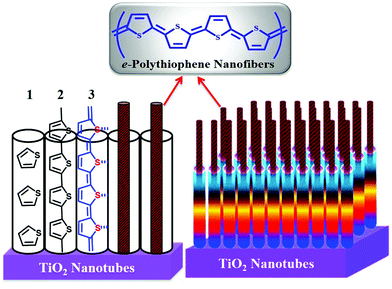 | ||
| Scheme 1 Schematic representation of the 1D PTh-NFs grown from 1D TNTs by controlled electropolymerization. | ||
Experimental section
Materials
Analytical grade thiophene monomer, tetrabutylammonium tetrafluoroborate (Bu4NBF4), acetonitrile, and titanium sheets (0.127 mm thick, 99.95%) were used as received from Sigma-Aldrich without further purification.Preparation of TiO2 nanotube arrays (TNTs)
Titanium sheets 0.127 mm in thickness (Sigma-Aldrich) were degreased by successive ultrasonication in acetone, isopropanol, and ethanol. After rinsing with deionized (DI) water and drying in a stream of nitrogen, the substrates were anodized immediately. All reagents were of analytical grade. Highly vertically oriented nanotubular TiO2 was prepared via potentiostatic anodization in a two-electrode electrochemical cell. TNTs were fabricated by a two-step anodization process. Cleaned commercial titanium foil was used as the working electrode and graphite as the counter cathode. To reduce effects on the surface, the samples were pre-anodized in a 0.5 wt% NH4F ethylene glycol solution at 50 V for 3 h, and then the TNTs were removed via ultrasonication in a 1 M HCl aqueous solution. The second anodization was carried out at 50 V for 30 min to obtain nanoporous TNTs. The TNTs thus fabricated were highly ordered, and the outer tube walls of individual nanotubes were nearly in contact with each other, which hardly leaves any space in between the nanotubes in the array. Such a nanotubular arrangement in the array prevents current leakage through pores other than the nanotubes (i.e., the pores in between the nanotubes), which enables it to direct the successful electrodeposition preferentially inside the nanotubes. After anodization, the TNTs thus formed were cleaned, before being dried in air. Finally, the anodized samples were annealed in air at 450 °C for 1 h to crystallize them in an anatase phase.Electrochemical polymerization of polythiophene (PTh)
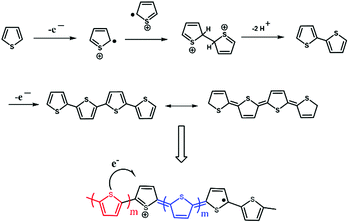
The electropolymerization process of thiophene (Th) is shown in Fig. 1. In a typical synthesis, a thiophene monomer was introduced at concentrations of 0.05 M, 0.1 M, 0.5 M, and 1 M along with a certain amount of 0.1 M tetrabutylammonium tetrafluoroborate (Bu4NBF4) salt as the supporting electrolyte.28 The two solutions were mixed under constant stirring to form a static organic/inorganic interface. With increasing salt concentration in the acetonitrile solution, the film surfaces become increasingly compact, leading to higher crystallinity.29 The TNTs served as the working electrode with Ag/AgCl as the reference electrode. Gradually, PTh-NFs were synthesized inside the TNTs by a controlled electrochemical polymerization process at the moderate rate of 25 mV s−1 in the potential regime of 2.0 to −0.6 V, avoiding polymer degradation and possible side reactions due to over-oxidation and ensuring morphological homogeneity. The selection of an appropriate potential regime is crucial to achieving a high degree of nano-infiltration, as it has a major influence on the deposition kinetics and subsequent further growth. The use of a larger potential window is suggestive of room temperature polymerization, since, at a lower temperature, higher energy is required to cause monomer oxidation. After polymerization, the samples were cleaned and dried before characterization.Characterization
All electrochemical measurements were performed on a potentiostat–galvanostat electrochemical workstation at room temperature. Crystallographic information was obtained using a D8 Discover General Area Detector X-ray Diffraction System (GADDS) with a 2D-detector having a Cu source: Cu Kα line λ = 0.154 nm 3000 watt. The morphologies were studied using a Hitachi S-4700 field emission scanning electron microscope (FE-SEM) coupled with energy-dispersive X-ray (EDX) spectroscopy. The morphology of the PTh–TNT NFs was characterized by transmission electron microscopy (TEM), and high-resolution TEM (HRTEM) images were obtained on a JEOL JEM-ARM200F microscope operated at an accelerating voltage of 200 kV. Scanning TEM (STEM) images were recorded with a probe Cs-corrected microscope operated at 200 kV. High-angle annular dark field STEM (HAADF-STEM) images were obtained with a convergence angle of 26 mrad and collection semi-angles from 50 to 180 mrad. The bonding characteristics of the samples were determined with Fourier transform infrared (FT-IR) spectroscopy (Shimadzu FT-IR-8700) using a KBr pellet technique from 4000 to 500 cm−1. Raman spectroscopy and Raman mapping were carried out on an NT-MDT NTEGRA Spectra model using a 532 nm pumped solid state laser unit. All the electrochemical measurements, including cyclic voltammetry (CV), galvanostatic charge–discharge (GCD), and electrochemical impedance spectroscopy (EIS), were performed using an Autolab-PGSTAT100 program operating on a potentiostat–galvanostat electrochemical workstation in a three electrode configuration.Results and discussion
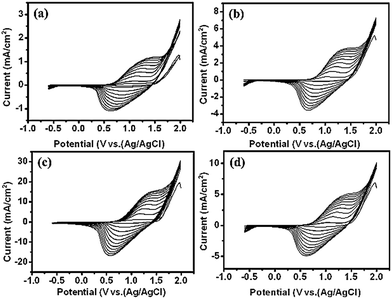
Scheme 1 depicts the formation of PTh-NFs in the TNT matrix. Electrochemical polymerization of the thiophene monomer was carried out by cyclic potential sweeps. The advantage is the capability for on-line monitoring of the electrochemical characteristics of the growth during polymerization, thus allowing for a detailed kinetic study of thiophene polymerization.25 The electropolymerization process of thiophene (Th) is shown in Fig. 1. The monomer is first oxidized by the application of an appropriate oxidation potential, producing the corresponding monomer radical cation, which concentrates at the electrode surface. In an alternative mechanism, radical cations undergo electrophilic substitution with neutral monomers to produce oligomers, which further oxidize and then precipitate on the electrode surface. The polymerization of thiophene monomer was monitored using CV within the potential window of −0.6 and 2.0 V (Fig. 2). In the anodic scan, an onset of current was observed at the potential of 1.3 V, indicating the oxidation of the polymer, which was absent in the first scan. Upon cathodic scanning, a peak corresponding to the reduction of the oxidized polymer to the neutral conjugated polymer was observed at approximately 1.7 V. During further cathodic scanning, more electrons were added to the polymer, such that the polymer became n-doped. At a potential of −0.6 V, the polymer was again subjected to a reversal scan, during which the polymer was oxidized back to the neutral form and then p-doped further. The successive p- and n-doping continued until the polymerization was terminated after 10 cycles. It is interesting to note that, on each previous scan, there was an increase in the electroactivities of the p-doping and n-doping processes, as evidenced by the constant rise in the redox current responses. In general, most intrinsically conducting polymers show a decreasing current response, in particular with each n-doping cycle, indicating reduced stability of the polymer towards n-doping. Throughout the scans, no pre-peaks were observed corresponding to the trapped charges, demonstrating that PTh is more stable against cycling through both the p- and n-doped states.As seen in Fig. 2, during electropolymerization of 1D TNTs at different concentrations of the thiophene monomer, no significant differences in CVs were observed in the anodic and cathodic peaks, although the current densities for 0.5 M thiophene appeared larger than those obtained for the 0.05 M, 0.1 M, and 1 M thiophene monomer samples. The enhancement of both the cathodic and anodic peaks with increasing number of voltammetric cycles is clear evidence of the growth of the polymer on the substrate. The polymerization was terminated after 10 cycles, and a steady-state CV was established. The redox process of the polymer is chemically reversible because the amount of cathodic charge is essentially the same as that of the anodic charge. Both anodic and cathodic peaks are quite broad, which was probably due to the slow diffusion of the dopant anions in and out of the film. Compared to the anodic peak, the cathodic peak extends over an even larger potential range. This feature is related to the reorganization processes of the polymeric chains, accompanied with the expulsion of the anions towards or inclusion of cations from the electrolytic medium. Since both the anodic and cathodic charges are related to the amount of electroactive polymers deposited on the electrode, the electrochemical polymerization can be monitored by cyclic voltammetry, recorded simultaneously with the synthesis (Fig. 2). In each of the anodic scans, two processes contribute to the total anodic charge. One is the doping charge, i.e., oxidation of the polymer that has already been deposited on the electrode. The other process relates to the charge consumed by the polymerization process. On the other hand, the cathodic charge only corresponds to the reduction (i.e., de-doping) of the polymer that has already been deposited on the electrode and is proportional to the amount of polymer. Therefore, the cathodic charges (QC) obtained from the cyclic voltammograms were used as quantitative indications of the quantity of polymer deposited on the electrode.
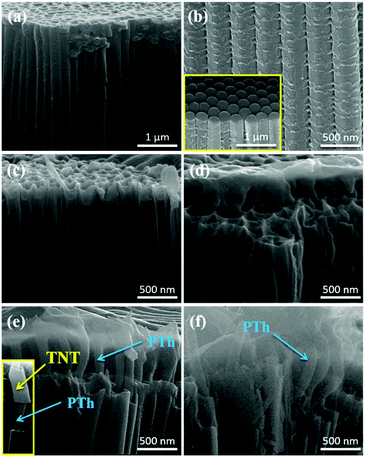
Fig. 3 and S1† shows field emission scanning electron microscope (FE-SEM) images of TNTs and PTh-NFs grown at different thiophene concentrations. It should be noted that the monomer concentration plays a vital role in the growth of PTh-NFs, as it influences the kinetics of electropolymerization, which can be observed from the current densities of the CVs in Fig. 2. When thiophene with 0.05 M concentration was employed, only one/single nanofiber was observed after 10 polymerization cycles (Fig. 3c). Interestingly, after increasing the monomer concentration to 0.1 M, the number of NFs also increased (Fig. 3d), and on further increasing the concentration to 0.5 M, highly ordered and long 1D PTh-NFs were grown from the 1D TNTs (Fig. 3e). The inset of Fig. 3e shows a cross-sectional image of PTh NFs grown through the inner regions of the TNTs, highlighting the continuous and uniform growth of the PTh-NFs inside the TNTs, and it is evident that PTh-NFs were not grown on or from the top surface, but clearly originated from the insides of the TNTs. Thus, the conducting PTh was successfully infiltrated into the matrix of 1D-TNTs, forming 1D PTh-NFs with a diameter of approximately 80 nm. When the thiophene concentration was further increased to 1.0 M, however, the NFs became distorted (Fig. 3f). The annihilation of the NFs could have occurred because of over-growth or swelling of the polymer due to excess thiophene monomer.
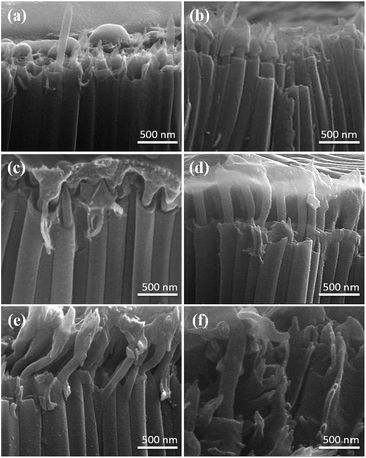
Fig. 4 shows the cross-sectional FE-SEM images of PTh-NFs grown from 1D-TNTs at the optimized thiophene monomer concentration (0.5 M) that were electropolymerized at varying scan rates from 5 to 100 mV s−1 (Fig. S2†). It can be observed that the scan rate also plays a major role in the formation of 1D PTh-NFs. When thiophene at 0.5 M concentration was electropolymerized at a minimum scan rate of 5 mV s−1, the tips of the NFs were seen to appear at the open ends of the TNTs (Fig. 4a). When the scan rate was increased to 10 mV s−1, PTh-NFs started to grow (Fig. 4b), while continuous and abundant growth was observed on further increasing the scan rate to 15 mV s−1 (Fig. 4c). The appearance of a foot-like morphology on the tops of the NFs suggests that new polymer layers tend to be mostly deposited on the previously formed nuclei of PTh rather than on any new sites. When the scan rate was further increased to 25 mV s−1, highly ordered 1D PTh-NFs were grown from the matrix of high aspect ratio 1D-TNTs with a distinct diameter (Fig. 4d). Furthermore, when polymerization was carried out at a high scan rate of 50 mV s−1, the PTh-NFs buckled from the inside and started emerging from the TNTs in a skewed shape (Fig. 4e). Finally, when the scan rate was as high as 100 mV s−1, the PTh-NFs almost destroyed the nanoporous structure of the TNTs (Fig. 4f). It is interesting to note that the NFs grown at high scan rates are quite distinct regarding thickness, length, and diameter compared to those grown at lower scan rates. This is suggestive of a difference in the kinetics of nucleation and growth that is controlled by electrical potential (variation of the scan rate). It is observed that successful infiltration and subsequent filling of TNTs by PTh leads to the formation of 1D elongated nanofibers, which tend to extrude and connect each other. Thus, these results reveal that to develop superior 1D PTh-NFs, well-controlled electropolymerization is important, which, in this case, is observed at a moderate scan rate of 25 mV s−1.
Polymer NF growth in nano-confinement is influenced by nucleation, growth, the nucleation sites, and the driving force that leads to appropriate polymerization. The progression of NF formation in the hollow cavities of TNTs follows a three-dimensional instantaneous nucleation and growth mode, in which the polymer grows at a rate that does not allow for the build-up of the polymer on new polymerization sites, only on existing ones, i.e., making additional nucleation irrelevant.21 The formation of the initial nuclei occurs by precipitation of oligomeric chains (formed from a localized higher concentration of oxidized monomers) on the growth surface once they reach a chain length at which they are insoluble. Thus, the solubility of thiophene monomers (and subsequent oligomers) at the electrode-solution interface is crucial for achieving an efficient polymerization. While the diffusion controls nucleation, the three-dimensional growth is manifested by charge transfer. Furthermore, the nucleation sites on the substrate (TNTs) are quite crucial and are influenced by the surface energies of the corresponding substrates. The higher the surface energy is, the greater will be the nucleation. In the case of TNTs, the surface energy is usually higher in the confined matrix of hollow TNTs. Thus, it is likely that nucleation and subsequent nanofiber growth are mostly initiated from the bottom-most region of the TNTs. Moreover, there are no voids/spaces between two consecutive nanotubes in the TNTs that we fabricated. Such nanotubular arrangements in the array prevent the current leakage (during electropolymerization into the nanotubular array), which enables preferential electropolymerization inside the matrix of hollow TNTs.22 On nucleation, two types of nanostructures can occur, one granular and the other fibrillar. If the inner layers are easily penetrable, the reactants easily react on the surfaces of the initially formed nano-seeds by penetrating the electronic layer, which favors the formation of the granular structure, as in the case of polypyrrole.22 In the case where denser inner layers are initially formed, the access of the reacting species to the initial nano-seeds is restricted, and granular formation is avoided. This promotes NF growth, as in the case of PANI.29 In the absence of any template, the electropolymerization of PTh belongs to the former case, where reactant species will tend to move to and react at the surfaces of the newly formed nano-seeds, favoring the granular structure, mainly because of the weaker protonation in PTh. It is thus obvious that TNTs provide an appropriate framework for PTh-NFs to grow and be extruded from the nanotubes during polymerization.
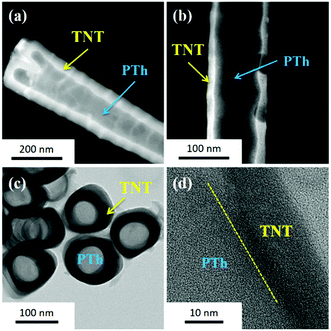
The infiltration of thiophene and subsequent nanofibrillar growth of PTh is evident from the contrast in the HAADF-STEM images presented in Fig. 5a and b. In the HAADF-STEM mode, bright contrast corresponds to elements with high atomic numbers, while lower atomic numbers yield dark contrast.30 Since titanium (Z = 22) has a high atomic number compared to carbon (Z = 6) and sulfur (Z = 16), the bright regions in the HAADF-STEM image are ascribed to Ti from TNTs. The dark region is assigned to C and S atoms, which are components of PTh. Moreover, the top view TEM image (Fig. 5c) clearly shows the growth of PTh NFs from the matrix of hollow TNTs. The HRTEM image of the boundary of a TNT (Fig. 5d) clearly reveals the formation of an amorphous PTh NF on the wall of the TNT.
The molecular orientation of the PTh–TNT NFs was examined by two-dimensional X-ray diffraction (2D-XRD). Fig. 6 shows a comparison of the 2D-XRD patterns of bare Ti foil, bare TNTs, PTh–Ti foil, and PTh–TNT NFs. Fig. 6c and d present the 2D-XRD patterns of PTh regularity on the Ti foil and inside the TNT, as indicated by arrows. As seen in Fig. 7c and d, the low angle diffraction peaks (less than 10°) indicate highly ordered PTh interchain regularity.32 The weak diffraction peak at around 22° is associated with the chain-to-chain stacking distance, showing the amorphously packed PTh main chains.33 The peak at around 25° (Fig. 7b and d) is attributed to the diffraction arising from the anatase phase of TNTs.34 This XRD study confirms the successful polymerization of PTh in the TNTs.
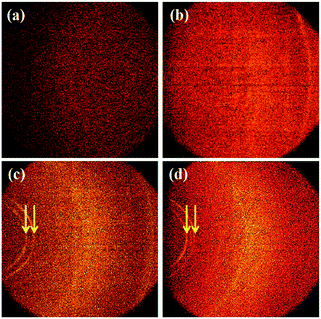 | ||
| Fig. 6 2D X-ray diffraction of (a) bare Ti foil, (b) bare TNTs, (c) PTh–Ti foil, and (d) PTh–TNT NFs. The diffraction rings derived from PTh are indicated by arrows. | ||
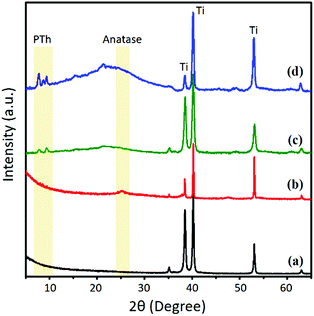 | ||
| Fig. 7 2D X-ray diffraction spectra of (a) bare Ti foil, (b) bare TNTs, (c) PTh–Ti foil, and (d) PTh–TNT NFs. | ||
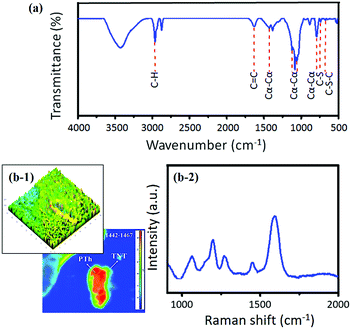
The PTh–TNT NFs were characterized by the FT-IR spectra (Fig. 8a). The peak at 2957 cm−1 is observed, showing the presence of C–H bonds in PTh. The signature peaks of C–S and C–S–C bonds in PTh appear at 724 and 672 cm−1, respectively.35 The peak at 1622 cm−1 corresponds to stretching of the C![[double bond, length as m-dash]](https://www.rsc.org/images/entities/char_e001.gif) C bonds in PTh. During polymerization, the thiophene monomer can be polymerized in three different conjunctions (i.e., α–α, α–β, and β–β) to form a radical cation.29,36 The prominent presence of peaks of the α–α conjunction at 1425, 1112, 1033, and 781 cm−1 indicates that the electrochemical ring coupling of the thiophene ring occurred preferentially at the 2, 5 position (α–α linkage). This is in accordance with density functional theory (DFT) calculations performed by Heinze et al. that predicted discrimination against all other conjunctions and strong promotion of the preferential formation of the PTh polymer through the most reactive α–α conjunction in electropolymerized PTh.26 Consequently, the electrical conductivity of PTh–TNT NFs was as high as 142 S cm−1. Moreover, the α–α conjunction is known to have excellent conductivity.29,36
C bonds in PTh. During polymerization, the thiophene monomer can be polymerized in three different conjunctions (i.e., α–α, α–β, and β–β) to form a radical cation.29,36 The prominent presence of peaks of the α–α conjunction at 1425, 1112, 1033, and 781 cm−1 indicates that the electrochemical ring coupling of the thiophene ring occurred preferentially at the 2, 5 position (α–α linkage). This is in accordance with density functional theory (DFT) calculations performed by Heinze et al. that predicted discrimination against all other conjunctions and strong promotion of the preferential formation of the PTh polymer through the most reactive α–α conjunction in electropolymerized PTh.26 Consequently, the electrical conductivity of PTh–TNT NFs was as high as 142 S cm−1. Moreover, the α–α conjunction is known to have excellent conductivity.29,36
The Raman spectrum of the PTh–TNT NFs was also measured. Characteristic peaks with wavenumbers of 146, 198, 394, 517, and 639 cm−1 correspond well to the anatase phase of TiO2.31 To further investigate the PTh structure, enlarged Raman spectrum from 1000 to 2000 cm−1 and the Raman maps are shown in Fig. 8b. The Raman spectrum of PTh–TNT NFs in the region of 1050–1460 cm−1 reflects the fingerprint of heavily doped PTh (Fig. 8b), which favours the formation of polarons.32 The presence of a Raman band at 1276 cm−1 corresponds to C–C symmetric stretching of the PTh backbone.33 Furthermore, the strongest high-frequency band at 1597 cm−1, which is assigned to C![[double bond, length as m-dash]](https://www.rsc.org/images/entities/char_e001.gif) C, indicates the formation of conjugated dienes of PTh.34 The lone-pair of S (in PTh) provides a strong driving force for the formation of a highly conjugated diene system within the framework of PTh (Scheme 1). Compared to PTh–Ti foil, the bathochromic shift of the C
C, indicates the formation of conjugated dienes of PTh.34 The lone-pair of S (in PTh) provides a strong driving force for the formation of a highly conjugated diene system within the framework of PTh (Scheme 1). Compared to PTh–Ti foil, the bathochromic shift of the C![[double bond, length as m-dash]](https://www.rsc.org/images/entities/char_e001.gif) C band associated with the diene structure is suggestive of increased conjugation in PTh NFs grown in the confined matrix of TNTs. The 2D and 3D Raman maps further show the successful formation of PTh inside the TNTs, as shown in Fig. 8b-1 and S3.†
C band associated with the diene structure is suggestive of increased conjugation in PTh NFs grown in the confined matrix of TNTs. The 2D and 3D Raman maps further show the successful formation of PTh inside the TNTs, as shown in Fig. 8b-1 and S3.†
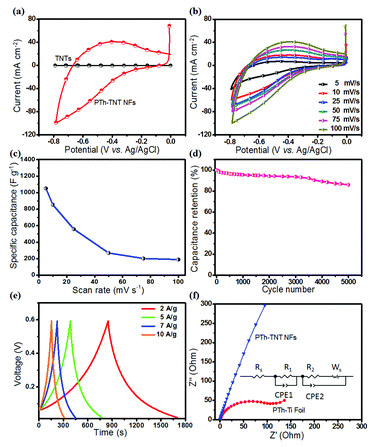
The highly conductive and well defined novel 1D PTh–TNT NFs can find application in various fields. As an example, we investigated 1D PTh–TNT NFs as an electrode material for supercapacitor applications. To evaluate the electrochemical properties of PTh–TNT NFs, CVs were collected in a three-electrode configuration. The electrochemical measurements were carried out in 1 M aqueous H2SO4 electrolyte within the potential window of −0.8 to 0.0 V, with PTh–TNT NFs as the working electrode, and Ag/AgCl and gauze platinum as the reference and counter electrodes, respectively. Fig. S4a† presents the CVs of PTh–TNT NF electrodes formed with varying concentrations of the thiophene monomer. Comparison of the CV curves of electrodes with different concentrations of thiophene obtained at a gradual scan rate of 5 mV s−1 shows a substantially higher area for the PTh–TNT NF electrode polymerized with 0.5 M thiophene concentration, reflecting the high pseudocapacitance contribution of PTh–TNT NFs (Fig. S4b†). Furthermore, the electrode with 0.5 M concentration was subjected to different scan rates from 5 to 100 mV s−1 (Fig. S4c†), and it was observed that all the CV curves showed redox properties, implying good capacitive behaviour. As can be concluded from Fig. S4d,† the best supercapacitive behaviour is exhibited by the PTh–TNT NF electrode that was electropolymerized at 0.5 M thiophene concentration and swept at a scan rate of 25 mV s−1. Thus, our high-performance 1D PTh–TNT NFs can be prepared by optimized electropolymerization (0.5 M Th monomer and 0.1 M Bu4NBF4 for 10 polymerization cycles and at a scan rate of 25 mV s−1).
Fig. 9a compares the CVs of the bare electrode (TNTs) and the PTh–TNT NFs at a scan rate of 100 mV s−1. The current density of PTh–TNT NFs is much higher than that of bare TNTs. Thus, TNTs do not show meaningful capacitance. In contrast, PTh in the TNTs shows significantly high capacitance. This clearly indicates that the major charge capacity results from the PTh and not from the TNTs. To evaluate the electrochemical performance of these ideal PTh–TNT NFs prepared with the optimized thiophene monomer concentration (0.5 M) by electropolymerization at a 25 mV s−1 scan rate, CVs at different scan rates (from 5 to 100 mV s−1) were collected, and the corresponding curves are presented in Fig. 9b. The increase in peak current density with the scan rate signifies the kinetics of the interfacial redox properties, and the ionic charge transport, even at high scan rates, precisely suggests the excellent rate capability of the PTh–TNT NFs, ultimately confirming the superior pseudocapacitive behaviour of the PTh–TNT NF electrode. The obtained specific capacitance37,38 of these novel PTh–TNT NFs is 1052 F g−1, which is the highest ever reported so far for PTh based supercapacitors (Fig. 9c).28,39–41 It should be noted that the TNTs would only contribute a minimal amount of pseudocapacitance (Fig. 9a, 0.05 F g−1). The specific energy and specific power6,42,43 of PTh–TNT NF supercapacitors are 51.4 W h kg−1 and 255.22 W kg−1, respectively. Moreover, the PTh–TNT NFs demonstrated excellent long-term stability over 5000 cycles tested using GCD at a current density of 7 A g−1 (Fig. 9d), which is a major prerequisite for supercapacitor electrode materials. The TNTs offer mechanical scaffolding to protect the PTh NFs from both agglomeration and collapse, which is extremely beneficial for long-term cycling. Thus, the PTh–TNT NFs should be a promising system for stable, as well as high, pseudocapacitive charge storage. The symmetric nature of the charge–discharge curves (Fig. 9e) obtained from the galvanostatic charge–discharge carried out at different current densities (2–10 A g−1) indicates high coulombic efficiency (∼99.76%), thereby implying excellent charge–discharge reversibility for the supercapacitor.
The excellent charge storage in PTh–TNT NFs is also supported by the relatively more vertical line in the Nyquist plot (Fig. 9f) compared to the 45° sloped lines in the Nyquist plots of other morphologies of PTh (granular, formed on non-templated, and planar Ti foil), indicating an obstruction to ion diffusion in the latter. This corresponds to the significantly reduced ion diffusion length in 1D PTh–TNT NFs, in accordance with the relation, t ≈ l2/D, where, t = ion diffusion time through the supercapacitor electrode, l = diffusion length, and D = diffusion coefficient. Second, these novel PTh–TNT NFs with their highly doped PTh diene structure showed excellent conductivity, as high as 142 S cm−1. The higher conductivity in PTh–TNT NFs suggests that the 1D polymer NS formed in the open spaces of TNTs possess superior molecular conformation as well as high doping levels, so that they yield excellent redox properties. More understanding of the polymer conformation and quantification of the polymer doping is needed, although the relevant studies are still in their infancy.
Conclusion
We have successfully synthesized highly uniform and long 1D PTh–TNT NFs by facile electropolymerization in a matrix of hollow TNTs. The critical conditions that influence the formation of such exciting NFs mainly include control over electropolymerization cycles, the scan rate, and the concentration of monomer. These polymerization conditions form the basis of the polymerization kinetics, which results in appropriate nucleation and growth that preferentially promotes the formation of 1D PTh–TNT NFs and restricts the formation of granular structures. Significantly, these novel 1D PTh–TNT NFs showed a high specific capacitance of 1052 F g−1, clearly highlighting their importance as potential next-generation charge storage entities. A detailed study of the high-performance capacitance of 1D PTh–TNT NFs is currently underway. Additionally, we believe that these 1D PTh–TNT NFs would not be limited to energy storage, but would also be of great interest for many other optoelectronic applications.Acknowledgements
This research was supported by the Basic Science Research Program through the National Research Foundation of Korea, funded by the Ministry of Science, ICT and Future Planning (No. 2015R1A2A2A01004404). F. J. S. would like to thank Nanshan District Key Lab for Biopolymers and Safety Evaluation (No. KC2014ZDZJ0001A).Notes and references
- L. Mai, X. Tian, X. Xu, L. Chang and L. Xu, Chem. Rev., 2014, 114, 11828 CrossRef CAS PubMed.
- N. P. Dasgupta, J. Sun, C. Liu, S. Brittman, S. C. Andrews, J. Lim, H. Gao, R. Yan and P. Yang, Adv. Mater., 2014, 26, 2137 CrossRef CAS PubMed.
- H. Hirakawa, E. J. Louis, A. G. MacDiarmid, C. K. Chiang and A. Heeger, J. Chem. Soc., Chem. Commun., 1977, 578 RSC.
- C. K. Chiang, C. R. Fincher, Y. W. Park, A. J. Heeger, H. Shirakawa, E. J. Louis, S. C. Gau and A. G. MacDiarmid, Phys. Rev. Lett., 1977, 39, 1098 CrossRef CAS.
- (a) C. Li, H. Bai and G. Shi, Chem. Soc. Rev., 2009, 38, 2397 RSC; (b) R. Liu and S. B. Lee, J. Am. Chem. Soc., 2008, 130, 2942 CrossRef CAS PubMed.
- S. I. Cho and S. B. Lee, Acc. Chem. Res., 2008, 41, 699 CrossRef CAS PubMed.
- G. A. Snook, P. Kao and A. S. Best, J. Power Sources, 2011, 196, 1 CrossRef CAS.
- C. R. Martin, Science, 1994, 266, 1961 CAS.
- C. R. Martin, Chem. Mater., 1996, 8, 1739 CrossRef CAS.
- C. R. Martin, Acc. Chem. Res., 1995, 28, 61 CrossRef CAS.
- Y. Liu, J. Goebl and Y. Yin, Chem. Soc. Rev., 2013, 42, 2610 RSC.
- M. Steinhart, J. H. Wendolff, A. Greiner, R. B. Wehrspohn, K. Nielsch, J. Choi and U. Gosele, Science, 2002, 296, 1997 CrossRef CAS PubMed.
- K. Akagi, G. Piao, S. Kaneko, K. Sakamaki, H. Shirakawa and M. Kyotani, Science, 1998, 282, 1683 CrossRef CAS PubMed.
- M. X. Wan, Z. X. Wei, Z. M. Zhang, L. J. Zhang, K. Huang and Y. S. Yang, Synth. Met., 2003, 135, 175 CrossRef.
- J. Huang, S. Virji, B. H. Weiller and R. B. Kaner, J. Am. Chem. Soc., 2003, 125, 314 CrossRef CAS PubMed.
- J. Huang and R. B. Kaner, J. Am. Chem. Soc., 2004, 126, 851 CrossRef CAS PubMed.
- I. D. Norris, M. M. Shaker, F. K. Ko and A. G. MacDiarmid, Synth. Met., 2000, 114, 109 CrossRef CAS.
- (a) M. Assefpour-Dezfulx, C. Vlachos and E. H. Andrews, J. Mater. Sci., 1984, 19, 3626 CrossRef; (b) V. Zwilling, E. D-Ceretti and A. B-Forveille, Electrochim. Acta, 1999, 45, 921 CrossRef CAS.
- (a) P. Roy, S. Berger and P. Schmuki, Angew. Chem., Int. Ed., 2011, 50, 2904 CrossRef CAS PubMed; (b) K. Lee, A. Mazare and P. Schmuki, Chem. Rev., 2014, 114, 9385 CrossRef CAS PubMed; (c) N. K. Shrestha, J. M. Macak, F. Schmidt-Stein, R. Hahn, C. T. Mierke, B. Fabry and P. Schmuki, Angew. Chem., Int. Ed., 2009, 48, 969 CrossRef CAS PubMed; (d) N. K. Shrestha and P. Schmuki, Electrochemistry at TiO2 nanotubes and other semiconductor nanostructures, Electrochemistry, 2013, 87–131 Search PubMed . ISBN: 978-1-84973-581-0; (e) J. Xu, X. Zhou, Z. Gao, Y.-Y. Song and P. Schmuki, Angew. Chem., Int. Ed., 2016, 55, 593 CrossRef CAS PubMed; (f) D. Kowalski, D. Kim and P. Schmuki, Nano Today, 2013, 8, 235 CrossRef CAS; (g) G. K. Mor, O. K. Varghese, M. Paulose, K. Shankar and C. A. Grimes, Sol. Energy Mater. Sol. Cells, 2006, 90, 2011 CrossRef CAS; (h) Y.-Y. Song, F. Schmidt-Stein, S. Bauer and P. Schmuki, J. Am. Chem. Soc., 2009, 131, 4230 CrossRef CAS PubMed; (i) Z.-D. Gao, Y. Qu, T. Li, N. K. Shrestha and Y.-Y. Song, Sci. Rep., 2014, 4, 6891 CrossRef CAS PubMed; (j) Z.-D. Gao, J. Guo, N. K. Shrestha, R. Hahn, Y.-Y. Song and P. Schmuki, Chem.–Eur. J., 2013, 19, 15530 CrossRef CAS PubMed.
- (a) W. Lee and S.-J. Park, Chem. Rev., 2014, 114, 7487 CrossRef CAS PubMed; (b) K. Nielsch, F. Müller, A.-P. Li and U. Gösele, Adv. Mater., 2000, 12, 582 CrossRef CAS; (c) S. I. Cho, W. J. Kwon, S.-J. Choi, P. Kim, S.-A. Park, J. Kim, S. J. Son, R. Xiao, S.-H. Kim and S. B. Lee, Adv. Mater., 2005, 17, 171 CrossRef CAS.
- (a) D. Kowalski and P. Schmuki, ChemPhysChem, 2012, 13, 3790 CrossRef CAS PubMed; (b) D. Kowalski, S. P. Albu and P. Schmuki, RSC Adv., 2013, 3, 2154 RSC.
- (a) D. Kowalski and P. Schmuki, Chem. Commun., 2010, 46, 8585 RSC; (b) D. Kowalski, A. Tighineanu and P. Schmuki, J. Mater. Chem., 2011, 21, 17909 RSC.
- S. H. Mujawar, S. B. Ambade, T. Battumur, R. B. Ambade and S.-H. Lee, Electrochim. Acta, 2011, 56, 4462 CrossRef CAS.
- (a) J. M. Macak, B. G. Gong, M. Hueppe and P. Schmuki, Adv. Mater., 2007, 19, 3027 CrossRef CAS; (b) N. Liu, K. Lee and P. Schmuki, Angew. Chem., Int. Ed., 2013, 52, 12381 CrossRef CAS PubMed.
- J. Roncali, Chem. Rev., 1992, 92, 711 CrossRef CAS.
- J. Heinze, B. A. Frontana-Uribe and S. Ludwigs, Chem. Rev., 2010, 110, 4724 CrossRef CAS PubMed.
- S. Sadki, P. Schottland, N. Brodie and G. Sabouraud, Chem. Soc. Rev., 2000, 29, 283 RSC.
- (a) R. B. Ambade, S. B. Ambade, N. K. Shrestha, Y. C. Nah, S. H. Han, W. Lee and S.-H. Lee, Chem. Commun., 2013, 49, 2308 RSC; (b) R. B. Ambade, S. B. Ambade, R. R. Salunkhe, V. Malgras, S.-H. Jin, Y. Yamauchi and S.-H. Lee, J. Mater. Chem. A, 2016, 4, 7406 RSC.
- X. Li and Y. Li, J. Appl. Polym. Sci., 2003, 90, 940 CrossRef CAS.
- J. Wang and D. Zhang, Adv. Polym. Technol., 2013, 32, E323 CrossRef CAS.
- (a) W. Wei, H. Jha, G. Yang, R. Hahn, I. Paramasivam, S. Berger, E. Spiecker and P. Schmuki, Adv. Mater., 2010, 22, 4770 CrossRef CAS PubMed; (b) B. Patrick, H. C. Ham, Y. Shao-Horn, L. F. Allard, G. S. Hwang and P. J. Ferreira, Chem. Mater., 2013, 25, 530 CrossRef CAS; (c) H. Chen, S. Chen, X. Quan, H. Yu, H. Zhao and Y. Zhang, J. Phys. Chem. C, 2008, 112, 9285 CrossRef CAS.
- B. S. Ong, Y. Wu, P. Liu and S. Gardner, Adv. Mater., 2005, 17, 1141 CrossRef CAS.
- (a) J. Mardalen, H. J. Fell, E. J. Samuelsen, E. Bakken, P. H. J. Carlsen and M. R. Anderson, Macromol. Chem. Phys., 1995, 196, 553 CrossRef CAS; (b) J. Mardalen, E. J. Samuelsen and P. H. Carlsen, Synth. Met., 1992, 48, 363 CrossRef.
- Y.-C. Nah, A. Ghicov, D. Kim, S. Berger and P. Schmuki, J. Am. Chem. Soc., 2008, 130, 16154 CrossRef CAS PubMed.
- A. Acharya, R. Mishra and G. S. Roy, Arm. J. Phys., 2010, 3, 195 CAS.
- F. Wu, J. Chen, R. Chen, S. Wu, L. Li, S. Chen and T. Zhao, J. Phys. Chem. C, 2011, 115, 6057 CAS.
- R. R. Salunkhe, J. Tang, N. Kobayashi, J. Kim, Y. Ide, S. Tominaka, J. H. Kim and Y. Yamauchi, Chem. Sci., 2016, 7, 5704 RSC.
- H. B. Li, M. H. Yu, F. X. Wang, P. Liu, Y. Liang, J. Xiao, C. X. Wang, Y. X. Tong and G. W. Yang, Nat. Commun., 2013, 4, 1894 CrossRef CAS PubMed.
- S. Nejati, T. E. Minford, Y. Y. Smolin and K. K. S. Lau, ACS Nano, 2014, 8, 5413 CrossRef CAS PubMed.
- A. Laforgue, P. Simon, C. Sarrazin and J. F. Fauvarque, J. Power Sources, 1999, 80, 142 CrossRef CAS.
- S. R. P. Gnanakan, N. Murugananthem and A. Subramania, Polym. Adv. Technol., 2011, 22, 788 CrossRef CAS.
- Y. Wang, Y. Song and Y. Xia, Chem. Soc. Rev., 2016, 45, 5925 RSC.
- D. Chen, Q. Wang, R. Wang and G. Shen, J. Mater. Chem. A, 2015, 3, 10158 CAS.
Footnote |
| † Electronic supplementary information (ESI) available: Fig. S1–S4. See DOI: 10.1039/c6ta08038c |
| This journal is © The Royal Society of Chemistry 2017 |

