Alleviation of oxidative stress-mediated nephropathy by dietary fenugreek (Trigonella foenum-graecum) seeds and onion (Allium cepa) in streptozotocin-induced diabetic rats
Seetur R.
Pradeep
and
Krishnapura
Srinivasan
 *
*
Department of Biochemistry, CSIR–Central Food Technological Research Institute, Mysore 570 020, India. E-mail: ksri.cftri@gmail.com; Fax: +91-821-2517233; Tel: +91-821-2514876
First published on 29th September 2017
Abstract
Oxidative stress plays a major role in the progression of diabetes and the pathogenesis of diabetic nephropathy. In this study, the beneficial influence of dietary fenugreek (Trigonella foenum-graecum) seeds and onion (Allium cepa) on oxidative stress-mediated renal injury was evaluated in streptozotocin-induced diabetic rats. Diabetes was induced in adult Wistar rats by the administration of streptozotocin (i.p. 45 mg kg−1). Dietary interventions were made with 10% fenugreek seeds or 3% onion (freeze-dried) or their combination for 6 weeks. These dietary interventions countered nephromegaly in the diabetic animals, the increase in creatinine clearance and oxidative stress in renal tissue. These dietary interventions significantly countered the increased renal cholesterol and triglycerides associated with the diabetic condition. The up-regulation of the receptor for advanced glycation end products, inflammatory cytokines and oxidative stress markers in the renal tissue of the diabetic rats was effectively countered. Renal 8-hydroxy-2-deoxyguanosine, its excretion, DNA fragmentation and mitochondrial DNA deletion were significantly annulled in the diabetic rats by these dietary interventions. Generally, the beneficial effects were greater in the combined intervention, although they were not additive. Thus, the beneficial influence of dietary fenugreek and onion on oxidative stress-mediated renal injury is higher when consumed together and this may be a strategy to ameliorate diabetic nephropathy.
Introduction
It is widely accepted that persistent hyperglycemia plays a key role in the pathogenesis and progression of diabetic complications including nephropathy. The adverse influence of hyperglycemia in this context has been explained by several biochemical mechanisms. The various mechanisms include enhanced oxidative stress,1 increased production of advanced glycation end products (AGEs),2 activation of protein kinase C,3 and enhanced polyol pathway.4 Oxidative stress resulting from an imbalance between the generation of reactive oxygen species (ROS) and the organism's antioxidant potential plays a major role in the progression of diabetic complications. ROS are generated through several ways in the hyperglycaemic condition. The excess of intracellular glucose increases superoxide radical formation at the site of the electron transport chain in the mitochondria which is likely to damage cellular macromolecules including DNA.2 Mitochondrial DNA (mtDNA) is 10 to 20 times more vulnerable to oxidative damage, leading to base pair modification, such as the oxidation of deoxyguanosine to 8-hydroxy-2-deoxyguanosine (8-OHdG) and subsequent mutations, than nuclear DNA.5Hyperglycemia also results in irreversible renal damage by glycation of proteins, which leads to the formation of glycosylated proteins and AGEs.6,7 The extracellular AGEs thus formed interact with their receptor (RAGE) and induce various intracellular degenerative events. Intracellular AGEs also initiate several signalling events by activating protein kinase C, mitogen-activated protein kinase, and transcription factors such as NF-κB. These events lead to an increase in the activity of various transcriptional and growth factors, such as transforming growth factor-β1 (TGF-β1), and subsequently induce mesangial cell hypertrophy, glomerular sclerosis and apoptosis.6,7
Dietary fenugreek (Trigonella foenum-graecum) seeds are well recognised to possess hypoglycemic and hypolipidemic properties which, understandably, contribute to antidiabetic potential.8 Onion (Allium cepa) is known to have hypoglycemic and insulin sparing actions on pancreatic β-cells.9 Both these spices have been proven to have antidiabetic and hypocholesterolemic potential in both clinical and preclinical trials. We have recently observed the amelioration of hyperglycemia and associated metabolic abnormalities by a combination of fenugreek seeds and onion in experimental diabetes.10 We have also documented a higher reduction of oxidative stress by the combination of dietary fenugreek seeds and onion in streptozotocin-induced diabetic rats.11 Since there is a possibility of an additive/synergistic effect between fenugreek seeds and onion, as their mechanisms of action are different, such a possibility needs to be evaluated with regard to the nephroprotective influences of their specific combination. With this point of view, the present study has evaluated the nephroprotective potential of fenugreek seeds as a provider of dietary fibre and onion, a well-established hypoglycemic and insulin secretagogue agent, both individually and in combination in a streptozotocin-induced diabetic rat model. The present study has particularly focussed on the level of markers related to oxidative stress in the renal tissue of diabetic animals.
Materials and methods
Materials
Ascorbic acid, bovine serum albumin, t-butyl hydroperoxide (TBHP), cholesterol, 1-chloro-2,4-dinitrobenzene (CDNB), cytochrome-C, o-dianisidine, dipalmitoyl phosphatidylcholine, 2,4-dinitrophenylhydrazine, 5,5′-dithiobis (2-nitrobenzoic acid) (DTMB), ethylene diamino tetraacetic acid (disodium salt; EDTA), glucose oxidase, glutathione reductase, glutathione reduced (GSH), glutathione oxidised (GSSG), heparin, horseradish peroxidase, nicotinamide adenine dinucleotide phosphate reduced (tetra sodium salt hydrate; NADPH), streptozotocin, thiobarbituric acid, triolein, xanthine and xanthine oxidase were procured from Sigma-Aldrich (St Louis, MO, USA). All other reagents used were of analytical grade and of the highest purity. Fenugreek seeds were purchased from a local market and powdered, and stored at 4 °C. Onion procured from the local market was chopped, freeze-dried and powdered, and stored at 4 °C. Casein (food grade) was procured from Nimesh Corporation (Mumbai, India). Maize starch, cane sugar powder, and refined groundnut oil were purchased from the local market.Animals and induction of diabetes
This animal study was carried out with due approval from the Institutional Animal Ethics Committee (CSIR–Central Food Technological Research Institute, Mysore), regulated by the Committee for the Purpose of Control and Supervision of Experiments on Animals (CPCSEA), Ministry of Social Justice and Empowerment, Government of India (registration number: 49/1999/CPCSEA) and appropriate measures have been taken to minimize pain or discomfort. Male Wistar rats (140–150 g body mass, n = 80) raised by the Experimental Animal Production Facility Unit of this institute were used in this investigation. All experimental animals were housed individually in stainless steel cages under standard laboratory conditions at 25 ± 2 °C temperature with 12 h of light and dark cycles, and 40–60% humidity. Experimental diabetes was induced by a single intra-peritoneal injection of streptozotocin at a dose of 45 mg kg−1 body weight (in freshly prepared 0.1 M citrate buffer, pH 4.5) to animals fasted overnight. The rats had free access to 5% glucose water and ad libitum basal diets during the next 48 h. Blood was collected from the retro-orbital plexus at 72 h after an overnight fast. Fasting blood glucose levels were determined by the glucose oxidase method12 and rats having blood glucose levels above 250 mg dL−1 were recruited as diabetic animals.Experimental design and diets
The animals were maintained on various experimental semisynthetic diets and water ad libitum for six weeks. The basal diet consisted of (%): casein, 21; cane sugar, 10; corn starch, 54; National Research Council (NRC) vitaminized starch, 1; Bernhardt–Tommarelli modified NRC salt mixture, 4; fat-soluble vitamins at the recommended levels; and refined groundnut oil, 10. The three experimental diets used in this study consisted of 10% fenugreek seed powder, 3% onion powder, and a combination of 10% fenugreek seed powder and 3% onion powder, respectively, replacing an equivalent amount of starch in the basal semisynthetic diet. Rats were divided into eight groups out of which four groups were diabetic (twelve rats in each group) and the other four groups were non-diabetic (8 rats in each group). Thus, the eight animal groups were as follows: (1) normal control (C), (2) C + fenugreek (10%), (3) C + onion (3%), (4) C + fenugreek (10%) + onion (3%), (5) diabetic control (D), (6) D + fenugreek (10%), (7) D + onion (3%), and (8) D + fenugreek (10%) + onion (3%). These dietary doses were evolved based on the earlier findings from this laboratory which have proved hypoglycemic and hypolipidemic influences in rat models.13,14Urine samples were collected towards the end of the feeding schedule, in ice-cold bottles for 24 h, clarified by filtration, and used for various biochemical analyses. At the end of six weeks, the animals were euthanized by exsanguination from the heart under diethyl ether anesthesia; blood was collected in heparinised tubes and the kidney tissue was quickly excised, weighed and processed for various analyses. A 10% (w/v) kidney homogenate was prepared in 0.05 M phosphate buffer (pH 7.4) and centrifuged at 15![[thin space (1/6-em)]](https://www.rsc.org/images/entities/char_2009.gif) 000g at 4 °C for 15 min; the supernatant was used for all biochemical analysis.
000g at 4 °C for 15 min; the supernatant was used for all biochemical analysis.
Creatinine clearance was calculated using the formula:
Measurement of oxidative stress markers
Reactive oxygen species (ROS) formation in the kidneys and its excretion in urine were quantified from a standard DCF-curve.15 Lipid peroxides in urine and kidney homogenates were assayed by measuring the malondialdehyde (MDA) concentration as thiobarbituric acid reactive substances spectrophotometrically (Shimadzu UV-1800; Shimadzu Corporation, Kyoto, Japan) according to the method described by Ohkawa et al.16 Protein carbonyl levels were quantified as described earlier17 and the results are expressed in nmol carbonyls per mg protein (e-22![[thin space (1/6-em)]](https://www.rsc.org/images/entities/char_2009.gif) 000 M−1 cm−1).
000 M−1 cm−1).
Activities of antioxidant enzymes and concentrations of antioxidant molecules
Catalase (CAT) activity was assayed according to the method of Aebi18 by following the decomposition of hydrogen peroxide. Superoxide dismutase (SOD) activity was measured by quantitating the inhibition of cytochrome-C reduction in the xanthine–xanthine oxidase system.19 Glutathione peroxidase (GPx) was estimated using nicotinamide adenine dinucleotide phosphate (reduced) (NADPH) oxidation in a coupled reduction system of hydrogen peroxide and oxidized glutathione.20 Glutathione reductase (GR) activity was measured following the oxidation of NADPH at 340 nm by oxidized glutathione.21 Glutathione-S-transferase (GST) activity was assayed by measuring the chlorodinitrobenzene–glutathione conjugate formed using 1-chloro-2,4-dinitrobenzene as the substrate.22 Ascorbic acid was estimated spectrophotometrically by measuring the 2,4-dinitrophenylhydrazone derivative of dehydroascorbic acid.23 Total sulfhydryl (TSH) was measured by the spectrophotometric method.24 Glutathione was estimated using Ellman's reagent.25Advanced glycation related and tryptophan fluorescence
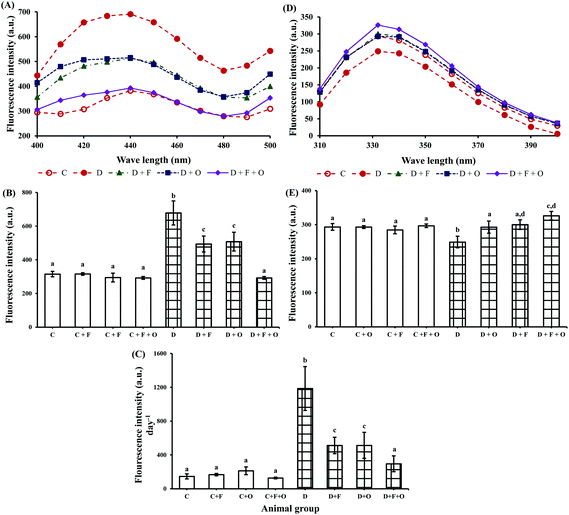
Renal and urinary advanced glycation-related fluorescence spectra were obtained from 400–500 nm with excitation at 370 nm in a spectrofluorometer (Shimadzu RF-5301PC)26 and tryptophan fluorescence spectra were obtained at the excitation wavelength of 295 nm and an emission wavelength between 315 and 400 nm.Lipid profile and fatty acid composition
Renal lipids were extracted by the procedure of Folch et al.27 and total cholesterol,28 phospholipid29 and triglycerides30 were quantified. The fatty acid methyl esters were analysed by gas chromatography (PerkinElmer) using an Elite-Wax (30 m × 9.25 mm) fused silica capillary column and a flame ionization detector. The analysis was carried out under isothermal conditions. The operating conditions were as follows: column temperature, 240 °C: injection temperature, 250 °C; and detector temperature, 260 °C. Nitrogen was used as the carrier gas. Individual fatty acids were identified by comparing with the retention times of reference fatty acids. The results are expressed as the relative percentage peak area of individual fatty acids.Real-time polymerase chain reaction (RT-PCR) analysis
Total RNA was extracted from the kidney tissue using TRI-reagent as per the instructions given by the manufacturer which was previously stored in RNA-later. The RNA samples were quantified using a biospectrophotometer. A complementary DNA strand was synthesized by using a Verso cDNA synthesis kit (Thermo Fisher Scientific Inc., MA, USA) as per the instructions given by the manufacturer. Primers for the PCR amplifications used were synthesized from Sigma-Aldrich as listed in Table 1. The RNA expression was quantified using Bio-Rad CFX96 Touch RT-PCR and SYBR-Green PCR reagents. The relative quantification was determined considering the Ct value as per the manufacturer's instructions. The fold changes were calculated by considering the Ct value of β-actin amplified with samples in order to ensure normalized quantification.| Gene | Sequence 5′–3′ (forward) | Sequence 5′–3′ (reverse) | Binding site on rat mtDNA |
|---|---|---|---|
| RAGE | CCCCTAAGAAGCCAACCCAG | GGAGTGAACCATTGGGGAGG | — |
| NF-κB | CTCAGCTGCGACCCCG | GGGCTGCTCAATGATCTCCA | — |
| TGF-β1 | GGAAAGGGCTCAACACCTG | CAGTTCTTCTCTGTGGAGCTGA | — |
| TNF-α | TACTCCCAGGTTCTCTTCAAGG | GGAGGCTGACTTTCTCCTGGTA | — |
| COX-2 | CGGAGGAGAAGTGGGGTTTAGGAT | TGGGAGGCACTTGCGTTGATGG | — |
| Bcl-2 | GGGATGCCTTTGTGGAACTA | CTCACTTGTGGCCCAGGTAT | — |
| Bax | CGAGCTGATCAGAACCATCA | CTCAGCCCATCTTCTTCCAG | — |
| β-Actin | AGGCCCCTCTGAACCCTAAG | CCAGAGGCATACAGGGACAA | — |
| L768 | GCTTAGAGCGTTAACCTTTTAAG | — | 7687 to 7709 |
| L782 | TTTCTTCCCAAACCTTTCCT | — | 7825 to 7844 |
| L797 | GTTCCCATCAATTCTATTCC | — | 7978 to 7997 |
| L1576 | GGTTCTTACTTCAGGGGCCATC | — | 15![[thin space (1/6-em)]](https://www.rsc.org/images/entities/char_2009.gif) 768 to 15 768 to 15![[thin space (1/6-em)]](https://www.rsc.org/images/entities/char_2009.gif) 789 789 |
| H1296 | CAGCAGTTATGGATGTGGCG | — | 12![[thin space (1/6-em)]](https://www.rsc.org/images/entities/char_2009.gif) 981 to 12 981 to 12![[thin space (1/6-em)]](https://www.rsc.org/images/entities/char_2009.gif) 962 962 |
| H1309 | AAGCCTGCTAGGATGCTTC | — | 13![[thin space (1/6-em)]](https://www.rsc.org/images/entities/char_2009.gif) 117 to 13 117 to 13![[thin space (1/6-em)]](https://www.rsc.org/images/entities/char_2009.gif) 099 099 |
| H1626 | GTGGAATTTTCTGAGGGTAGGC | — | 16![[thin space (1/6-em)]](https://www.rsc.org/images/entities/char_2009.gif) 288 to 16 288 to 16![[thin space (1/6-em)]](https://www.rsc.org/images/entities/char_2009.gif) 267 267 |
Measurement of 8-hydroxy-2-deoxyguanosine
Kidney and urinary 8-hydroxy 2-deoxyguanosine (8-OHdG) was estimated by using a commercial kit (Cat.#ab101245; Abcam, Cambridge, MA, USA) according to the manufacturer's instructions.DNA fragmentation and semi-quantitation of mtDNA deletion
The genomic DNA fragmentation was assayed by electrophoresing DNA samples on agarose/EtBr gel by the methods of Biase et al.31 Total mtDNA was extracted from the renal tissue according to the method of Kakimoto et al.5 The primer sets for the amplification of 4834 bp mtRNA deletion are listed in Table 1. Amplification was carried out in a thermal cycler system and PCR products were electrophoresed on 1% agarose/EtBr gel. The mtDNA deletion products were determined for each sample by using Syngene G: Box and GeneSnap v7.09 acquisition software (Syngene). Band intensity was quantified using GeneTools v4.01 analysis software (Syngene).Western blotting analysis
The kidney tissue was homogenized in ice-cold lysis buffer (pH 7.5). Fifty microgram protein of each sample was electrophoresed on 10% sodium dodecyl sulphate polyacrylamide gel electrophoresis (SDS-PAGE) gel and electro-transferred to a polyvinylidene difluoride (PVDF) membrane. The protein blots were blocked with 5% skimmed milk solution for 2 h, and incubated with primary antibodies for RAGE (Cat.#R5278, Sigma Chemicals Co., St Louis, MO, USA), 4-hydroxynonenal (4-HNE) (Cat.#ab46545), Bax (Cat.#ab32503), Bcl-2 (Cat.#ab18210) and β-actin (Cat.#ab25894; Abcam, Cambridge, MA, USA) as per the instructions given by the manufacturer. Immunoreactive bands were then detected by incubating with the horseradish peroxidase (HRP)-conjugated secondary antibody and visualized using enhanced chemiluminescence reagents (Sigma Aldrich, St Louis, MO, USA). Band intensity was quantified as the ratio to β-actin using GeneTools v4.01 analysis software (Syngene).Immunohistological and confocal laser scanning microscopic analysis
The renal tissues were fixed in 4% paraformaldehyde and embedded in paraffin. To measure tissue 4-HNE, 8-OHdG, Bax, and Bcl-2 levels, rehydrated sections were incubated overnight with the respective polyclonal antibodies, followed by the HRP-conjugated secondary antibody. Immunoreactivity was visualized with 3,3′-diaminobenzidine and the sections were counter stained with haematoxylin. Images were analysed using a microscope (Olympus Model: BX-5, Japan; ProgRes C-5 software). For confocal microscopic study (Carl Zeiss, LSM 700, Jena, Germany; ZEN 2009 software), fluorescent dye was excited at 488 nm to observe the images. The fluorescence of the respective protein spectra emitted was analyzed by using a T-PMT detector with a spectral increment of 1 a.u., with a 30.5 μm pinhole size, and a scanning time of 11.3 s. The images were captured at pixels of 512 × 512, with a pixel size of 1.25 μm, and a pixel dwell time of 25.6 μs.Statistical analysis
The results are expressed as mean ± standard errors of the mean. Comparisons between different groups were made by one way analysis of variance (ANOVA), followed by Tukey's multiple comparison test using GraphPad Instat statistical software (GraphPad Software, Inc., La Jolla, CA, USA). The values with p < 0.05 were considered statistically significant.Results
Influence on kidney weight and creatinine clearance
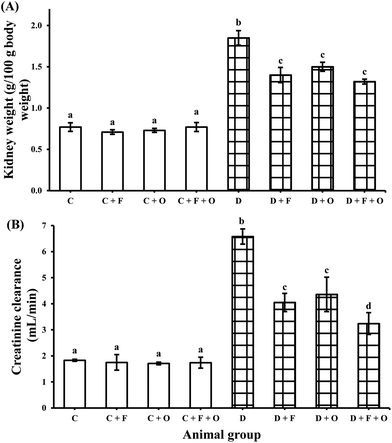
The diabetic rats were characterized by markedly large kidneys (nephromegaly), the weights of which (as % body mass) were approximately more than two times those of normal rats (Fig. 1A). The diabetic animals maintained on fenugreek, onion, and fenugreek + onion diets showed a significant decrease (by 24, 19 and 29%, respectively) in kidney weight, compared with those of the diabetic control group. The calculated creatinine clearance of the diabetic control group (6.58 mL min−1) was markedly higher compared with that of the normal control group (1.8 mL min−1). The elevated creatinine clearance was significantly countered (p < 0.05) by the three dietary interventions to an extent of 38%, 34%, and 49%, respectively (Fig. 1B). In the case of normal animals, these dietary interventions did not make any difference in kidney weights or creatinine clearance.Influence on oxidative stress markers
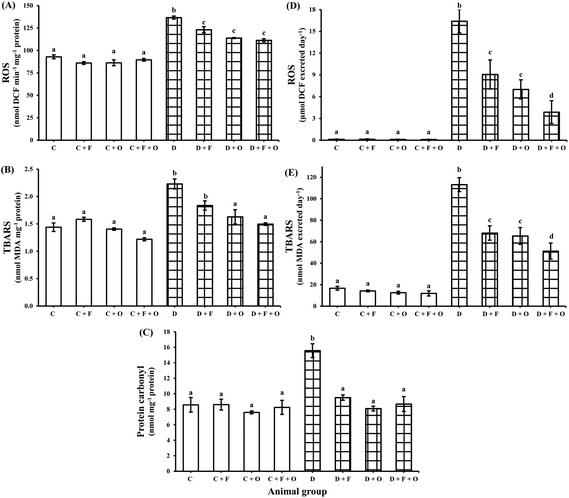
The influence of fenugreek seeds, onion and fenugreek + onion on oxidative stress markers in renal tissue and their urinary excretion is shown in Fig. 2. The diabetic condition resulted in a marked increase (p < 0.05) in ROS, lipid peroxides and protein carbonyls (47, 55, and 82% increase) in the renal tissue and caused their higher excretion in urine (>125 fold and >6 fold), compared to that of the normal control (C) group. The dietary intervention with fenugreek resulted in lowered ROS, lipid peroxides and protein carbonyl content by 10, 17 and 39%, respectively, while the dietary intervention with onion produced a decrease of 17, 27, and 48%, respectively, and Fenugreek + onion produced a decrease of 18, 33, and 44%, respectively. This was accompanied by a reduced excretion of ROS and lipid peroxides in the diabetic rats’ urine by the dietary intervention with fenugreek (45 and 40%), onion (57 and 42%), and fenugreek + onion (76% and 55%), respectively, compare to that of the diabetic control (D).Influence on AGEs and tryptophan protein fluorescence
Renal and urinary excretion of AGEs and tryptophan-related fluorescence intensity data are presented in Fig. 3. Diabetes induced increased AGE-related fluorescence protein intensity in the kidneys by >2 fold (Fig. 3A and B) and in urine by >8 fold (Fig. 3C). Feeding diabetic animals with fenugreek and onion individually or in combination significantly (p < 0.05) reduced the hyperglycemia-induced formation of AGEs in the renal tissue by 27, 25, and 57%, respectively. This was accompanied by the reduced urinary excretion of AGE-related fluorescence protein by 48, 48, and 70%, respectively, compared to that of the diabetic control group. On the other hand, the tryptophan-related fluorescence protein of the renal tissue was markedly decreased by diabetes (Fig. 3D and E). Feeding experimental diets significantly restored the tryptophan-related fluorescence by 18, 21, and 31%, respectively, the beneficial countering being more effective in the group fed with fenugreek + onion.Influence on renal antioxidant status
Altered renal antioxidant status by the diabetic condition and the influence of these dietary interventions on the same are shown in Table 2. An increased activity of SOD (by 44%; p < 0.05) was seen in the diabetic animals; the dietary intervention with fenugreek or onion or their combination partially annulled the same by 19, 30, and 25%, respectively. The activity of all glutathione-linked enzymes, viz., GPx, GR and GST, was significantly increased (by 62, 8, and 17%, respectively) in the diabetic situation. The dietary intervention to these diabetic rats showed the partially restored activity of these enzymes (0, 17, and 27% by fenugreek; 22, 14, and 33% by onion; and 27, 25, and 36% by fenugreek + onion), the effect being higher in the case of the latter. TSH and GSH were predominantly decreased in the diabetic group, while the ascorbic acid content was increased compared to the normal control (C). The dietary interventions resulted in partially restored antioxidant molecules (p < 0.05) (12, 17, and 37%, respectively, by fenugreek; 19, 20, and 99%, respectively, by onion; 27, 35, and 77%, respectively, by fenugreek + onion). Thus, fenugreek + onion showed significantly higher beneficial effects than the individuals on the antioxidant status in the diabetic renal tissue.| Animal group | Antioxidant enzymes | Antioxidant molecules | ||||||
|---|---|---|---|---|---|---|---|---|
| SOD (units min−1 mg−1 protein) | CAT (mmol min−1 mg−1 protein) | GPx (μmol min−1 mg−1 protein) | GR (μmol min−1 mg−1 protein) | GST (μmol min−1 mg−1 protein) | Ascorbic acid (μg g−1 tissue) | TSH (μmol g−1 tissue) | GSH (μg g−1 tissue) | |
| Values are mean ± SEM of 8 animals in each group. Means within the same column (in each parameter) bearing different superscripts (a, b, c, d, e) are significantly different (p < 0.05). C, normal control; D, diabetic control; F, fenugreek; O, onion; SOD, superoxide dismutase; CAT, catalase; GPx, glutathione peroxidase; GR, glutathione reductase; GST, glutathione-S-transferase; TSH, total sulfhydryl; GSH, reduced glutathione. | ||||||||
| C | 18.02 ± 0.13a,b | 95.81 ± 1.11a | 131.02 ± 5.86a | 101.70 ± 1.96a,b | 105.41 ± 3.65a | 36.74 ± 2.31a | 350.49 ± 12.70a,b | 9.41 ± 0.13a |
| C + F | 17.95 ± 0.59a,b | 88.77 ± 1.10a,b | 136.75 ± 5.17a | 99.0 ± 1.93a,c | 101.57 ± 4.77a,b | 34.81 ± 1.17a | 332.72 ± 0.67a,b | 7.73 ± 1.10a |
| C + O | 17.69 ± 0.28b | 86.3 ± 0.75a,b | 108.93 ± 2.90a | 100.46 ± 1.04a,c | 105.37 ± 0.35a | 39.89 ± 0.85a,b | 365.19 ± 8.0a | 13.46 ± 1.05a |
| C + F + O | 16.57 ± 1.09b | 84.95 ± 1.07b | 122.09 ± 5.86a | 92.08 ± 0.47a,d | 97.58 ± 4.26a,b | 35.05 ± 1.07a | 335.78 ± 15.45a,b | 12.57 ± 2.16a |
| D | 25.93 ± 0.25c | 48.23 ± 1.57c | 212.16 ± 8.30b | 108.40 ± 1.05b,c | 122.95 ± 1.05c | 48.95 ± 0.27c | 261.70 ± 2.71c | 4.76 ± 1.42b |
| D + F | 21.03 ± 0.42a | 62.94 ± 2.56d | 212.56 ± 7.45b | 89.86 ± 4.66a,e | 89.18 ± 1.85b,d | 43.11 ± 1.01b,d | 305.8 ± 2.54b | 6.53 ± 1.35a,b |
| D + O | 18.08 ± 0.18a,b | 57.49 ± 3.11c,d | 166.34 ± 9.67a | 93.62 ± 0.79a,d | 82.51 ± 2.46d | 39.58 ± 0.37a,d | 314.3 ± 5.06b | 9.46 ± 0.69a |
| D + F + O | 19.44 ± 1.65a,b | 57.83 ± 2.91d | 154.14 ± 8.36a | 81.35 ± 1.72e | 78.38 ± 1.81d | 35.65 ± 0.82a | 354.5 ± 3.28a | 8.42 ± 1.57a |
Influence on renal lipid profile and fatty acid composition
The diabetic situation elevated the level of renal cholesterol, triglycerides and phospholipids, the increase in these lipid classes being 35, 96, and 31%, respectively, compared to the normal rats (Table 3). Feeding diabetic rats with fenugreek, onion, and fenugreek + onion lowered renal cholesterol by 27, 25, and 33%, respectively (p < 0.05). Increased triglycerides by the diabetic condition was countered by dietary fenugreek (28%), onion (19%) and fenugreek + onion (60%), respectively (p < 0.05), the latter indicating a more than additive effect. Renal phospholipid was further increased with these dietary interventions, the elevation being more in the fenugreek + onion group. In the normal animals, cholesterol, triglycerides, and phospholipids were similarly affected by the dietary interventions with fenugreek, onion or their combination (p > 0.05). Consequently, these dietary interventions had a favourable effect on the cholesterol![[thin space (1/6-em)]](https://www.rsc.org/images/entities/char_2009.gif) :
:![[thin space (1/6-em)]](https://www.rsc.org/images/entities/char_2009.gif) phospholipid ratio in both the diabetic and normal rats.
phospholipid ratio in both the diabetic and normal rats.
| Animal group | Cholesterol | Triglyceride | Phospholipids | Cholesterol![[thin space (1/6-em)]](https://www.rsc.org/images/entities/char_2009.gif) : :![[thin space (1/6-em)]](https://www.rsc.org/images/entities/char_2009.gif) phospholipids phospholipids |
|---|---|---|---|---|
| Values (mg g−1 tissue) are mean ± SEM of 8 animals in each group. Means within the same column (in each parameter) bearing different superscripts (a, b, c, d) are significantly different (p < 0.05). C, normal control; D, diabetic control; F, fenugreek; O, onion. | ||||
| C | 7.95 ± 0.42a | 26.30 ± 2.21a | 34.90 ± 1.77a | 0.227 ± 0.005a |
| C + F | 6.17 ± 0.15a | 19.53 ± 1.27a | 28.58 ± 1.49a | 0.215 ± 0.021a |
| C + O | 7.25 ± 0.38a | 26.07 ± 0.17a | 33.76 ± 2.22a | 0.214 ± 0.013a |
| C + F + O | 6.99 ± 0.04a | 22.44 ± 2.42a | 40.19 ± 4.49a,b | 0.173 ± 0.002b |
| D | 10.77 ± 1.31b | 51.63 ± 2.07b | 45.60 ± 1.01b,c | 0.236 ± 0.002a |
| D + F | 7.83 ± 0.36a | 37.18 ± 2.70c | 59.23 ± 4.73d | 0.132 ± 0.017c |
| D + O | 8.04 ± 0.02a | 41.92 ± 2.32b,c | 56.32 ± 8.65c,d | 0.142 ± 0.001c |
| D + F + O | 7.16 ± 0.36a | 20.75 ± 0.48a | 65.78 ± 3.32d | 0.108 ± 0.003c |
The fatty acid composition of renal tissue (Table 4) revealed that the diabetic rats (D) exhibited a prominent decrease in polyunsaturated fatty acid (PUFA)–arachidonic acid (20![[thin space (1/6-em)]](https://www.rsc.org/images/entities/char_2009.gif) :
:![[thin space (1/6-em)]](https://www.rsc.org/images/entities/char_2009.gif) 4) (59% decreases as compared to the normal control (C)). The reduction of arachidonic acid in the diabetic rats was also accompanied by a significant increase in linoleic acid (57%), oleic acid (21%), stearic acid (33%), and palmitic acid (30%), respectively. The ratio of PUFA to saturated fatty acids (SFA) was thus significantly decreased in the diabetic condition (by about 51%) as compared to the normal control group. The dietary interventions to these diabetic animals resulted in an improvement of PUFA
4) (59% decreases as compared to the normal control (C)). The reduction of arachidonic acid in the diabetic rats was also accompanied by a significant increase in linoleic acid (57%), oleic acid (21%), stearic acid (33%), and palmitic acid (30%), respectively. The ratio of PUFA to saturated fatty acids (SFA) was thus significantly decreased in the diabetic condition (by about 51%) as compared to the normal control group. The dietary interventions to these diabetic animals resulted in an improvement of PUFA![[thin space (1/6-em)]](https://www.rsc.org/images/entities/char_2009.gif) :
:![[thin space (1/6-em)]](https://www.rsc.org/images/entities/char_2009.gif) SFA ratio (by about 37% in fenugreek; 26% in onion; 60% in fenugreek + onion).
SFA ratio (by about 37% in fenugreek; 26% in onion; 60% in fenugreek + onion).
| Fatty acid | Animal group | |||||||
|---|---|---|---|---|---|---|---|---|
| C | C + F | C + O | C + F + O | D | D + F | D + O | D + F + O | |
| Values are mean ± SEM of 8 animals in each group. Means within the same row (in each parameter) bearing different superscripts (a, b, c, d, e) are significantly different (p < 0.05). C, normal control; D, diabetic control; F, fenugreek; O, onion. | ||||||||
14![[thin space (1/6-em)]](https://www.rsc.org/images/entities/char_2009.gif) : :![[thin space (1/6-em)]](https://www.rsc.org/images/entities/char_2009.gif) 0 0 |
0.29 ± 0.03a,b | 0.12 ± 0.03a | 0.16 ± 0.04a | 0.13 ± 0.02a | 0.61 ± 0.06c | 0.60 ± 0.04c | 0.57 ± 0.04c,d | 0.40 ± 0.03b,d |
14![[thin space (1/6-em)]](https://www.rsc.org/images/entities/char_2009.gif) : :![[thin space (1/6-em)]](https://www.rsc.org/images/entities/char_2009.gif) 1 1 |
0.40 ± 0.02a | 0.57 ± 0.04b | 0.48 ± 0.05a,b | 0.60 ± 0.02b | 0.14 ± 0.01c | 0.38 ± 0.02a | 0.32 ± 0.02a | 0.45 ± 0.05a |
16![[thin space (1/6-em)]](https://www.rsc.org/images/entities/char_2009.gif) : :![[thin space (1/6-em)]](https://www.rsc.org/images/entities/char_2009.gif) 0 0 |
16.59 ± 0.23a | 16.08 ± 0.31a | 17.18 ± 0.14a | 16.56 ± 0.53a | 21.53 ± 0.39b | 20.50 ± 0.46b | 20.26 ± 0.31b | 19.83 ± 0.48c |
16![[thin space (1/6-em)]](https://www.rsc.org/images/entities/char_2009.gif) : :![[thin space (1/6-em)]](https://www.rsc.org/images/entities/char_2009.gif) 1 1 |
1.23 ± 0.03a | 1.12 ± 0.02b | 1.04 ± 0.01b | 1.05 ± 0.03b | 0.29 ± 0.01c | 0.43 ± 0.02d,e | 0.35 ± 0.02c,d | 0.50 ± 0.02e |
18![[thin space (1/6-em)]](https://www.rsc.org/images/entities/char_2009.gif) : :![[thin space (1/6-em)]](https://www.rsc.org/images/entities/char_2009.gif) 0 0 |
27.81 ± 0.93a | 27.11 ± 0.46a | 27.58 ± 0.19a | 26.12 ± 0.35a | 36.92 ± 1.67b | 32.12 ± 0.95c | 34.77 ± 1.46b,c | 30.65 ± 1.13a,c |
18![[thin space (1/6-em)]](https://www.rsc.org/images/entities/char_2009.gif) : :![[thin space (1/6-em)]](https://www.rsc.org/images/entities/char_2009.gif) 1 1 |
10.20 ± 0.09a | 9.88 ± 0.19a | 9.92 ± 0.24a | 9.57 ± 0.15a | 12.34 ± 0.93b | 10.92 ± 0.24a,b | 10.65 ± 0.35a,b | 9.77 ± 0.41a |
18![[thin space (1/6-em)]](https://www.rsc.org/images/entities/char_2009.gif) : :![[thin space (1/6-em)]](https://www.rsc.org/images/entities/char_2009.gif) 2 2 |
6.61 ± 0.32a | 5.98 ± 0.05a | 6.54 ± 0.13a | 5.42 ± 0.20a | 10.39 ± 0.34b | 9.99 ± 0.02b,c | 10.03 ± 0.15b,c | 9.19 ± 0.10c |
18![[thin space (1/6-em)]](https://www.rsc.org/images/entities/char_2009.gif) : :![[thin space (1/6-em)]](https://www.rsc.org/images/entities/char_2009.gif) 3 3 |
0.68 ± 0.03a,b | 0.57 ± 0.02a,b | 0.59 ± 0.03a,b | 0.50 ± 0.01a | 0.83 ± 0.15b | 0.45 ± 0.04a,b | 0.65 ± 0.02a,b | 0.38 ± 0.04a |
20![[thin space (1/6-em)]](https://www.rsc.org/images/entities/char_2009.gif) : :![[thin space (1/6-em)]](https://www.rsc.org/images/entities/char_2009.gif) 0 0 |
0.24 ± 0.01a | 0.20 ± 0.01a | 0.22 ± 0.02a | 0.20 ± 0.03a | 0.94 ± 0.03b | 0.66 ± 0.01b | 0.74 ± 0.02b | 0.46 ± 0.01a |
20![[thin space (1/6-em)]](https://www.rsc.org/images/entities/char_2009.gif) : :![[thin space (1/6-em)]](https://www.rsc.org/images/entities/char_2009.gif) 4 4 |
34.39 ± 2.15a | 35.83 ± 1.85a | 34.17 ± 1.50a | 37.09 ± 2.00a | 13.95 ± 1.60b | 20.65 ± 1.57b,c | 19.99 ± 1.62b,c | 25.59 ± 1.95c |
20![[thin space (1/6-em)]](https://www.rsc.org/images/entities/char_2009.gif) : :![[thin space (1/6-em)]](https://www.rsc.org/images/entities/char_2009.gif) 5 5 |
1.25 ± 0.05a | 1.76 ± 0.03a | 1.33 ± 0.04a | 1.98 ± 0.06a | 0.50 ± 0.01b | 1.81 ± 0.03a | 1.19 ± 0.04a | 1.79 ± 0.01a |
22![[thin space (1/6-em)]](https://www.rsc.org/images/entities/char_2009.gif) : :![[thin space (1/6-em)]](https://www.rsc.org/images/entities/char_2009.gif) 6 6 |
0.90 ± 0.05a | 0.80 ± 0.01a | 0.81 ± 0.03a | 0.80 ± 0.02a | 1.61 ± 0.15b | 1.50 ± 0.05b | 1.52 ± 0.03b | 1.07 ± 0.05a |
| PUFA | 43.83 | 44.94 | 43.44 | 45.79 | 27.29 | 34.40 | 32.37 | 38.02 |
| SFA | 56.18 | 55.8 | 56.59 | 54.21 | 72.77 | 65.61 | 67.67 | 62.06 |
| PUFA/SFA | 0.78 | 0.82 | 0.77 | 0.84 | 0.38 | 0.52 | 0.48 | 0.61 |
Influence on renal mRNA transcriptional profile
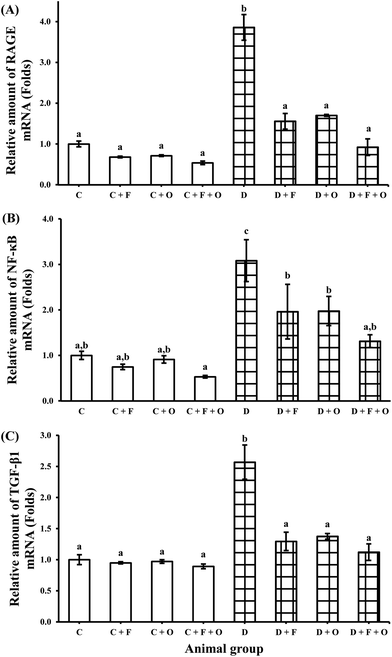
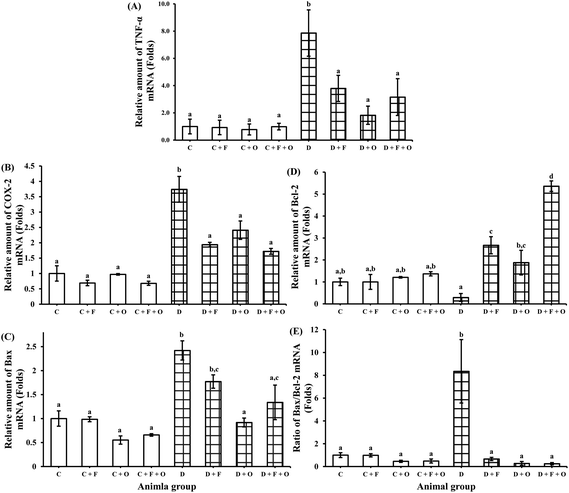
Transcriptions of mRNA for RAGE (receptor for AGEs), NF-κB, inflammatory cytokines (TNF-α, TGF-β1), COX-2, pro-apoptotic marker Bax and anti-apoptotic marker Bcl-2 were quantified using RT-PCR. The mRNA expression of RAGE, NF-κB, and TGF-β1 in the renal tissue was increased during the diabetic condition by >2.8, 2.0 and 1.5 fold, respectively, when compared to the normal control (Fig. 4). Feeding diabetic rats with fenugreek and onion significantly down-regulated RAGE, NF-κB and TGF-β1 in the kidneys of the diabetic rats. The maximum beneficial influence was produced by fenugreek + onion (76, 57, and 56% lesser expression of RAGE, NF-κB and TGF-β1, respectively), when compared to the diabetic control (D). Diabetes also resulted in the up-regulation of TNF-α and COX-2 mRNA (about >6.8 and 2.7 fold), compared to the normal control (Fig. 5A and B). Feeding diabetic rats with dietary fenugreek seeds and onion significantly down-regulated the mRNA expression of these genes. The pro-apoptotic and anti-apoptotic mRNA expression was altered in the diabetic condition (142% increase and 71% decrease, respectively), compared to the normal control (C) (Fig. 5C and D). The onion group evidenced a higher positive (down-regulated) mRNA expression of Bax (62.1%) and TNF-α (77%) than the fenugreek and fenugreek + onion group. The intervention with fenugreek + onion resulted in a significantly higher up-regulation of anti-apoptotic gene Bcl-2 (>18.5 fold) and down-regulation (p > 0.05) of COX-2 (54%), compared to the diabetic control (D). Thus, the renal mRNA expression profile suggests that dietary fenugreek, onion or fenugreek + onion produced an overall reduction of hyperglycemia-mediated renal damage.Influence on renal protein expressions
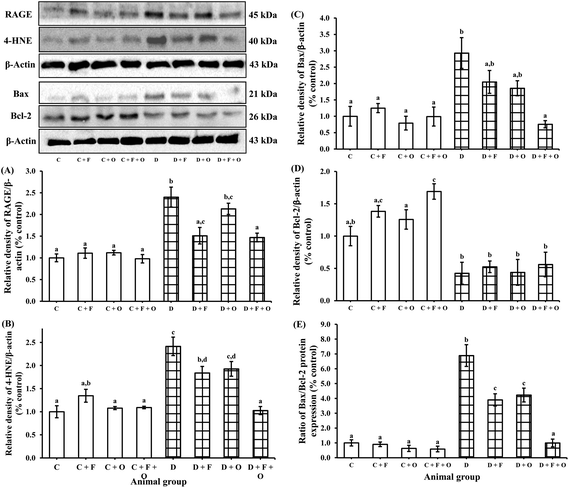
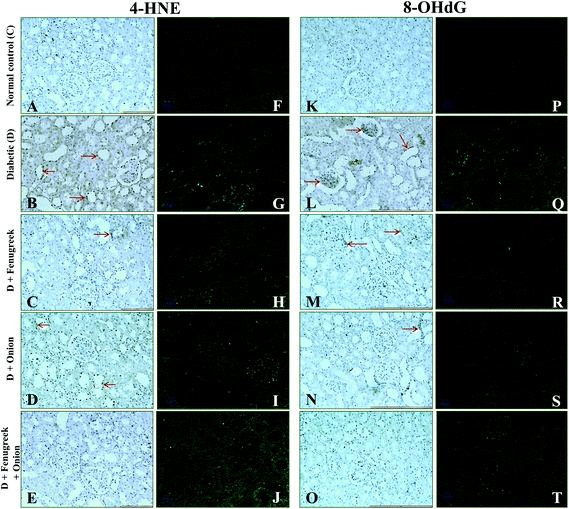
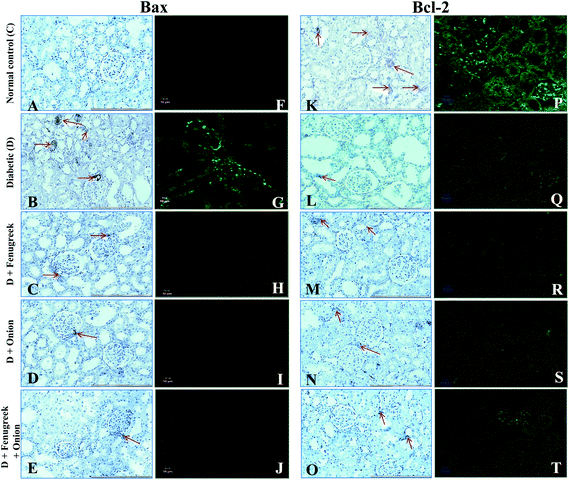
To understand the molecular mechanism underlying the alleviation of oxidative stress by fenugreek, onion or their combination, the protein expression of RAGE, 4-HNE, Bax and Bcl-2 was also assessed (Fig. 6). The diabetes condition resulted in an up-regulation of RAGE and 4-HNE expression by >2.4 fold compared to the normal control group. These diabetic rats treated with fenugreek (47 and 24%), onion (11 and 20%) and fenugreek + onion (57%) significantly countered the same (p < 0.05), the latter being more effective, amounting to an additive effect. Diabetes-induced oxidative stress was featured by up-regulated Bax (193%) and down-regulated Bcl-2 (57.5%), which was partially annulled by dietary fenugreek (30 and 23%), onion (36.7 and 3%) and fenugreek + onion (81 and 32%). An immunohistochemical and fluorescence image study also supported this wherein the kidneys were similarly affected with respect to 4-HNE (Fig. 7A–J), pro-apoptotic (Fig. 8A–J) and anti-apoptotic (Fig. 8K–T) related protein expressions.Influence on renal and urinary 8-OHdG content
Renal 8-OHdG was significantly increased in the diabetic rats (135%) at 6th week after the onset of diabetes (Table 5). Dietary fenugreek, onion or their combination partially restored the same (11, 16 and 17%, respectively). In support of this, an immunohistochemical and fluorescence image study of the kidneys showed that the accumulation of 8-OHdG content was predominantly increased in the diabetic animals, which was partially reversed by these dietary interventions (Fig. 7K–T). Similarly, the excretion of 8-OHdG was also profoundly increased (>10 fold; p < 0.05) by diabetes. The animals fed with fenugreek, onion or their combination significantly reduced the urinary excretion of 8-OHdG by 48, 49, and 68%, respectively (p < 0.05), compared to the diabetic control.| Animal group | Renal mtDNA (ng mg−1 DNA) | Urinary excretion of 8-hydroxy 2-deoxyguanosine (ng day−1) |
|---|---|---|
| Values are mean ± SEM of 8 animals in each group. Means within the same column (in each parameter) bearing different superscripts (a, b, c) are significantly different (p < 0.05). C, normal control; D, diabetic control; F, fenugreek; O, onion. | ||
| C | 3.67 ± 0.31a | 78.1 ± 21.5a |
| C + F | 3.68 ± 0.05a | 70.8 ± 7.5a |
| C + O | 3.65 ± 0.16a | 70.0 ± 3.1a |
| C + F + O | 3.64 ± 0.21a | 67.9 ± 11.4a |
| D | 8.62 ± 0.05b | 1021.2 ± 127.0b |
| D + F | 7.68 ± 0.11b | 532.2 ± 86.2c |
| D + O | 7.27 ± 0.42b | 519.4 ± 16.6c |
| D + F + O | 7.15 ± 0.55b | 330.4 ± 73.9a,c |
Influence on renal genomic DNA fragmentation and mtDNA deletion
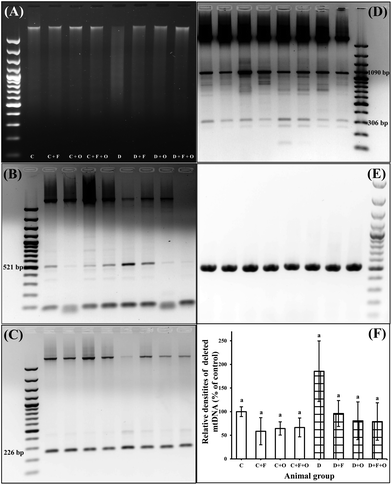
STZ-induced apoptosis was also evident from the ladder pattern in DNA gel electrophoresis (Fig. 9). All of the three dietary interventions in the diabetic groups showed partially restored DNA integrity at the end of the treatment (Fig. 9A). Semi-quantitative analysis of the PCR amplification product of renal mtDNA showed that the 4834 bp mtDNA deletion products had increased at the 6th week after the onset of diabetes (Fig. 9B–F). In our study, there was a difference between deletion frequency in the mtDNA of the diabetic and normal control groups (p < 0.05), but any of the dietary intervention groups did not produce any statistically significant differences.Discussion
Oxidative-stress mediated by the hyperglycaemia-induced generation of free radicals and formation of AGEs contributes to the development and progression of diabetes and its complications such as nephropathy.32 The morphological characteristics of diabetic nephropathy include glomerular hypertrophy, basement membrane thickening, mesangial expansion, tubular atrophy, interstitial fibrosis and arteriolar thickening, all of which are parts of the microvascular complications of diabetes.33 The potentiation of antioxidant defence mechanisms has been considered as the foremost pharmacological effect of antioxidant systems to balance oxidative stress. Recently, there has been growing interest in natural antioxidants for alleviating the oxidative damage. The beneficial influence of fiber-rich fenugreek and sulfur compound-rich onion in the prevention of certain chronic diseases has caught renewed interest in this context. The present animal study has particularly examined the additive/synergistic effect of a combination of fenugreek seeds and onion on oxidative stress-mediated renal injury in the STZ-induced diabetic rats. We have recently reported that the dietary interventions with fenugreek seeds and onion (for 6 weeks) significantly countered hyperglycemia in the STZ-diabetic rats, with their combination producing the highest effect.10 Hypoinsulinemia and the loss of body weight were also simultaneously reversed in the diabetic rats fed with fenugreek and onion diets, the intervention with fenugreek + onion producing the higher effect.10 The attendant metabolic abnormalities such as higher excretions of glucose, urea, creatinine and albumin by the diabetic animals were moderated throughout these dietary interventions.10The diabetic rats were characterised by relatively large kidneys and an increased glomerular filtration rate, one of the typical early signs of diabetic nephropathy34 that is used as an index of renal function in clinical practices. In our present study, the dietary interventions of the diabetic rats with fenugreek seeds and onion significantly countered nephromegaly and an increase in the creatinine clearance rate. The diabetic condition intensified renal and urinary ROS, lipid peroxides and protein carbonyls, as also observed in a previous study.14 These increased ROS levels, in turn, markedly increased the auto-oxidation of PUFA in renal membranes leading to an over-production of the lipid peroxidation product namely 4-HNE35 and an auto-oxidation of amino acids in proteins leading to an oxidised protein (carbonyl). Elevated ROS, lipid peroxides and protein carbonyls were effectively countered in all of the three treatment groups, with a higher effect in the fenugreek + onion fed group. This is probably because of their hypoglycemic nature that allows a smaller amount of glucose to undergo metal catalysed auto-oxidation reactions, thereby lowering the free radical generation.
Antioxidant enzymes such as SOD, CAT, GPx, GR, and GST and antioxidant molecules such as ascorbic acid and glutathione (GSH) are involved in the endogenous antioxidant defence system. Hyperglycemia derived oxidative stress impairs the endogenous antioxidant defence system in many ways which lead to altered activities of these enzymes and concentration of antioxidant molecules. In our study, SOD, GSH-linked antioxidant enzymes, and ascorbic acid were increased, concomitant with decreased catalase and GSH in the diabetic state. This contradictory trend in the antioxidant defence may be incidental to the specific time point during the disease progression. This is an adaptation in the antioxidant status during diabetes to combat oxidative stress. The activity of SOD is increased at the onset of diabetes as body's first level of defence to neutralize the ROS. The higher activity of SOD, which generates H2O2, is accompanied by an increase in the activities of GSH-linked enzymes in response to oxidative stress. This results in a decreased level of renal GSH, which is used by GSH-linked enzymes to counter the increased oxidative stress.
The increased activities of some antioxidant enzymes are probably due to an adaptive mechanism wherein during oxidative stress, some genes will over-express for a period of time. The overall antioxidant status was restored by these dietary interventions; these observations were corroborated with decreased oxidative stress markers. Fenugreek produced a beneficial effect on the activity of CAT, while feeding onion had the maximum effect on the activity of SOD, restoring GSH and protein carbonyl. The combination of fenugreek and onion had the maximum beneficial effect on the activities of all of the three GSH-linked enzymes and ascorbic acid, which were corroborated with restored renal and urinary ROS and peroxides, along with reduced 4-HNE protein expression by these dietary interventions. The beneficial effect of fenugreek and onion on the antioxidant status in the diabetic situation is also reported by several researchers.9,36
Hyperlipidemia is a recognised abnormality of diabetes mellitus which is also characterised by the elevated level of renal cholesterol and triglycerides. The elevated neutral lipid classes in the diabetic rats suggest the possibility of glomerulosclerosis; in particular, hypercholesterolemia plays a major role in promoting vascular changes. Similarly, altered fatty acid composition in the diabetic rats would affect the renal function. The fluidity and functionality of the membrane are influenced by the length and degree of unsaturation of fatty acyl chains.34 In our study, the total PUFA of the renal tissue was decreased with a concomitant increase in SFA and further indicated that the arachidonic acid content in the renal membrane lipids of the diabetic animals is considerably low. The decreased PUFA in diabetes is because of a decrease in Δ5 and Δ6 desaturase activities or the auto-oxidation of PUFA to the lipid peroxidation product 4-HNE.35 Arachidonic acid may also be metabolized by the lipoxygenase and cyclooxygenase pathway in the kidney glomeruli.34 The present study revealed that the feeding of fenugreek, onion and their combination significantly reduced renal cholesterol and triglycerides along with a significant increase in the phospholipid content, thus resulting in a beneficial lowering of cholesterol![[thin space (1/6-em)]](https://www.rsc.org/images/entities/char_2009.gif) :
:![[thin space (1/6-em)]](https://www.rsc.org/images/entities/char_2009.gif) phospholipid ratio. The effect of fenugreek + onion appeared to be additive in this regard. The reason behind this hypolipidemic effect of fenugreek or onion is due to their ingredients such as insoluble fibre, besides saponins in fenugreek,8 and the presence of sulfur-containing compounds such as S-methylcysteine sulfoxide and S-allyl cysteine sulfoxide, besides flavonoids in onion.9
phospholipid ratio. The effect of fenugreek + onion appeared to be additive in this regard. The reason behind this hypolipidemic effect of fenugreek or onion is due to their ingredients such as insoluble fibre, besides saponins in fenugreek,8 and the presence of sulfur-containing compounds such as S-methylcysteine sulfoxide and S-allyl cysteine sulfoxide, besides flavonoids in onion.9
During prolonged hyperglycemia, reducing sugars react with the amino group of proteins non-enzymatically and irreversibly to cross-linked moieties termed AGEs, the accumulation of which is an important feature in the development of diabetic complications. In the hyperglycemic condition, the formation and accumulation of AGEs in various tissues have been shown to progress at an accelerated rate.37 The interaction of AGEs with RAGE induces oxidative stress and subsequently evokes inflammatory reactions, resulting in an increased membrane permeability and the loss of integrity, progressive alteration in renal architecture, finally leading to the loss of renal function.37 AGEs also interfere with the function of other proteins, increasing the complication further. In the present study, we evidenced for the first time that the treatment with fenugreek, onion or fenugreek + onion significantly inhibited the formation of AGEs and the expression of their receptor (RAGE) in the kidneys of the diabetic animals, which were corroborated with the decreased urinary excretion of AGEs.
There are several pieces of evidence on the hypoglycemic influence of fenugreek in both animal and human studies.8 The possible mechanism of action of fenugreek is due to delayed gastric emptying by a direct interaction with glucose absorption. In addition, a gel-forming dietary fibre reduces the release of insulinotropic hormones and gastric inhibitory polypeptides. The hypoglycemic potency of onion is attributed to the sulfur-containing compounds such as S-methylcysteine sulfoxide and S-allyl cysteine sulfoxide.9 The possible mechanism of hypoglycaemic action probably involves the direct or indirect stimulation of secretion of insulin by the pancreas. It is also suggested that these disulfide compounds have the effects of sparing insulin from SH inactivation by reacting with endogenous thiol-containing molecules such as cysteine, glutathione, and serum albumins.38 Thus, it can be concluded that the hypoglycemic property of fenugreek and onion is directly related to reduced AGE formation. AGEs are thought to be involved in the pathogenesis of diabetic nephropathy via a series of mechanisms such as oxidative stress generation and over-production of various growth factors and cytokines.39 AGE accumulation in kidney has been regarded as an index of progressive renal damage in diabetic nephropathy. The treatment with these spices not only reduced the AGE accumulation but also down-regulated the over-expression of RAGE mRNA and protein.
There was an up-regulation of NF-κB, cytokines (TNF-α and TGF-β1), COX-2, and the pro-apoptotic marker Bax along with the down-regulated anti-apoptotic marker Bcl-2 in the kidneys of the diabetic rats. NF-κB represents a family of transcription factors which regulate cellular processes including immunological responses, inflammation, apoptosis, cell growth and development. An increased expression of NF-κB has often been seen in many diverse diseases, which transcribe DNA to mRNA, to translate new proteins which result in a change of cell function.40 COX-2 is considered as an inducible enzyme and is upregulated under inflammatory conditions, preceding the renal increases in cytokines.41 Our study further observed an increased expression of renal COX-2, which is directly related to the reduced arachidonic acid, further leading to 4-HNE formation in diabetes that has been implicated in the structural and functional changes of renal tissue.35 The regulation of the apoptosis-related genes, Bax and Bcl-2 in diabetes mellitus, has been reported.42 The ratio of Bcl-2 to Bax determines cell survival or death following an apoptotic stimulus and ultimately contributes to extracellular matrix (ECM) pathology and renal injury.
The present study has documented for the first time that the diabetic rats treated with fenugreek seeds, onion and their combination beneficially down-regulated NF-κB, COX-2, cytokines and Bax, associated with the up-regulation of Bcl-2. This is corroborated with diminished glomerular hypertrophy, inflammatory cell infiltration, glycogen deposition, ECM synthesis and mesangial expansion as evidenced by H & E, PAS and Masson's trichrome staining. In addition, these dietary interventions significantly down-regulated the over-expression of ECM synthesis components such as fibronectin and type I collagen in the diabetic rats, thereby reducing the fibrosis of kidney (our unpublished data). This is consistent with a previous report of fenugreek down-regulating cytokines in the diabetic model.43
Hyperglycemia-induced ROS generation can also damage cellular macromolecules such as DNA. Nucleic acids exposed to oxygen radicals generate various modified bases such as 8-OHdG and subsequently result in the mutations of mtDNA.44 An increased level of 8-OHdG has been reported in urine and various tissues in the diabetic condition.5 The level of 8-OHdG in renal mtDNA and its urinary excretion is used as a marker for renal failure both in clinical and in preclinical studies. The efficacy of dietary fenugreek and onion on renal and urinary 8-OHdG is novel information. While the 8-OHdG content in the renal tissue was not significantly reversed by fenugreek or onion, the combination of these spices showed benefits on the oxidative damage of renal DNA provoked by diabetes. Urinary 8-OHdG excretion was markedly increased in diabetes while this was reversed by dietary fenugreek, onion or their combination, the highest effect being with the latter.
This led to the further exploration of the beneficial effect of these spices on genomic DNA integrity and mtDNA deletions caused by diabetes. Genomic DNA isolated from the kidneys of the diabetic rats shows a smear pattern, which is characteristic of random DNA fragmentation.45 The treatment with fenugreek or onion partially restored the integrity of genomic DNA. The brain tissue of alloxan-induced diabetic rats treated with fenugreek powder is reported to have shown a similar result.46 Deletions of mtDNA contributing to alterations in mitochondrial gene integrity are associated with ageing and chronic hyperglycemia. Oxidative damage of renal mtDNA and accumulation of mtDNA with a 4834 bp deletion have been reported in STZ-induced diabetes.5 Hyperglycemia-induced formation of AGEs and their integration with RAGE can generate ROS that can mediate or directly injure cells or DNA.44 The increased level of deleted mtDNA in the diabetic kidneys is not reversed with the insulin treatment.5 Our present study evidenced similar results, where dietary fenugreek or onion somewhat hindered the deletion of mtDNA and this is a novel information. This result suggests that mtDNA deletions are not easily reversed by glycemic control once after they have been established.
The present animal study which has evidenced the health beneficial influence of fenugreek seeds has employed 50 to 100 times the human intake level (0.3 to 0.6 g per day per adult).8 Such dietary levels are possible through fenugreek-rich dishes employing liberal amounts of these seeds and are in vogue in India. The liberal consumption of fenugreek seeds is also proved to be safe.8 The consumption of large amounts of onion as a vegetable in the daily meal is not uncommon. The components of fenugreek seeds behind their health beneficial attributes have been considered as flavonoids, saponins, soluble fibre galactomannans and 4-hydroxyisoleucine. The soluble dietary fibre fraction of fenugreek seeds improves glucose homeostasis in type 1 and type 2 diabetes by delaying carbohydrate digestion and absorption, and enhancing insulin action.47 The antioxidant activity of fenugreek seeds is attributed to flavonoids; flavonoids are reported to ameliorate experimental nephrotoxicity.48 It may be considered that the nephroprotective activity of fenugreek is due to a synergic antioxidant and free radical scavenging activity.49 The antidiabetic action of onion is presumably mediated by the antioxidant properties of its components resulting in moderating hyperglycemia and hyperlipidemia.50 Onion contains high concentrations of organosulfur compounds, viz., alk(en)yl cysteine sulfoxides, which may contribute to the protective effects of onion against oxidative stress in the diabetic rats. Onion is also a rich source of flavonoids, mainly quercetin, which could contribute to the nephroprotective action by virtue of its antioxidant potential.
In conclusion, the present study shows that fibre-rich fenugreek seeds and sulfur compound-rich onion elicit a nephroprotective influence by down-regulating the AGE-RAGE, NF-κB, COX-2, cytokines, and pro-apoptotic expression with countering the oxidation of genomic and mtDNA, and the concomitant up-regulation of Bcl2 expression. These dietary interventions considerably arrested the elevated propensity of creatinine clearance and nephromegaly. Thus, it seems that these spices not only influence the AGE-RAGE pathway, but also activate a cascade of NF-κB and TGF-β1 signalling (apoptosis) pathways, leading to an attenuation of renal damage caused by the protein glycation induced by hyperglycemia (Fig. 10). Furthermore, antioxidative and hypolipidemic properties of fenugreek and onion cannot be excluded. Thus, it is important to consume these two spices, especially together as functional foods to ameliorate renal damage.
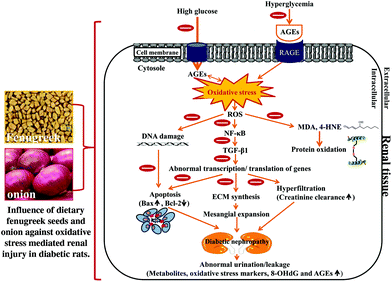 | ||
| Fig. 10 The possible mechanisms of action of dietary fenugreek seeds and onion against oxidative stress-mediated renal injury in the diabetic rats. | ||
Conflicts of interest
There are no conflicts to declare.Acknowledgements
The first author (SRP) is thankful to the Council of Scientific and Industrial Research, New Delhi, for the award of a senior research fellowship. This research did not receive any specific grant from funding agencies in the public, commercial, or not-for-profit sectors.References
- S. P. Wolff, Z. Y. Jiang and J. V. Hunt, Protein glycation and oxidative stress in diabetes mellitus and ageing, Free Radicals Biol. Med., 1991, 10, 339–352 CrossRef CAS PubMed.
- M. Brownlee, A. Cerami and H. Vlassara, Advanced glycosylation end products in tissue and the biochemical basis of diabetic complications, N. Engl. J. Med., 1988, 318, 1315–1321 CrossRef CAS PubMed.
- P. A. Craven and F. R. DeRubertis, Protein kinase C is activated in glomeruli from streptozotocin diabetic rats. Possible mediation by glucose, J. Clin. Invest., 1989, 83, 1667–1675 CrossRef CAS PubMed.
- R. Kikkawa, K. Umemura, M. Haneda, T. Arimura, K. Ebata and Y. Shigeta, Evidence for existence of polyol pathway in cultured rat mesangial cells, Diabetes, 1987, 36, 240–243 CrossRef CAS PubMed.
- M. Kakimoto, T. Inoguchi, T. Sonta, H. Y. Yu, M. Imamura and T. Etoh, et al., Accumulation of 8-hydroxy-2′-deoxyguanosine and mitochondrial DNA deletion in kidney of diabetic rats, Diabetes, 2002, 51, 1588–1595 CrossRef CAS PubMed.
- S. I. Yamagishi, K. Fukami, S. Ueda and S. Okuda, Molecular mechanisms of diabetic nephropathy and its therapeutic intervention, Curr. Drug Targets, 2007, 8, 952–959 CrossRef CAS PubMed.
- Y. S. Kanwar, J. Wada, L. Sun, P. Xie, E. I. Wallner, S. Chen and F. R. Danesh, Diabetic nephropathy: mechanisms of renal disease progression, Exp. Biol. Med., 2008, 233, 4–11 CrossRef CAS PubMed.
- K. Srinivasan, Fenugreek (Trigonella foenum-graecum): A review of health beneficial physiological effects, Food Rev. Int., 2006, 22, 203–224 CrossRef CAS.
- H. A. R. Suleria, M. S. Butt, F. M. Anjum, F. Saeed and N. Khalid, Onion: nature protection against physiological threats, Crit. Rev. Food Sci. Nutr., 2015, 55, 50–66 CrossRef CAS PubMed.
- S. R. Pradeep and K. Srinivasan, Amelioration of hyperglycemia and associated metabolic abnormalities by a combination of fenugreek (Trigonella foenum-graecum) seeds and onion (Allium cepa) in experimental diabetes, J. Basic Clin. Physiol. Pharmacol., 2017, 28, 493–505 CAS.
- S. R. Pradeep and K. Srinivasan, Amelioration of oxidative stress by dietary fenugreek (Trigonella foenum-graecum L.) seeds is potentiated by onion (Allium cepa L.) in streptozotocin-induced diabetic rats, Appl. Physiol., Nutr., Metab., 2017, 42, 816–828 CrossRef CAS PubMed.
- A. S. G. Huggett and D. A. Nixon, Use of glucose oxidase, peroxidase, and o-dianisidine in determination of blood and urinary glucose, Lancet, 1957, 270, 368–370 CrossRef.
- P. Mukthamba and K. Srinivasan, Beneficial hypolipidemic influence of a combination of dietary fenugreek (Trigonella foenum-graecum) seeds and garlic (Allium sativum) in induced hypercholesterolemic rats, Eur. Food Res. Technol., 2015, 240, 1049–1058 CrossRef CAS.
- P. S. Babu and K. Srinivasan, Influence of dietary capsaicin and onion on the metabolic abnormalities associated with streptozotocin induced diabetes mellitus, Mol. Cell. Biochem., 1997, 175, 49–57 CrossRef CAS PubMed.
- A. S. Driver, P. R. S. Kodavanti and W. R. Mundy, Age-related changes in reactive oxygen species production in rat brain homogenates, Neurotoxicol. Teratol., 2000, 22, 175–181 CrossRef CAS PubMed.
- H. Ohkawa, N. Ohishi and K. Yagi, Assay for lipid peroxides in animal tissues by thiobarbituric acid reaction, Anal. Biochem., 1979, 95, 351–358 CrossRef CAS PubMed.
- A. Z. Reznick and L. Packer, Oxidative damage to proteins: spectrophotometric method for carbonyl assay, Methods Enzymol., 1994, 233, 357–363 CAS.
- H. Aebi, Catalase in vitro, Methods Enzymol., 1984, 105, 121–126 CAS.
- L. Flohe and F. Otting, Superoxide dismutase assays, Methods Enzymol., 1984, 105, 93–104 CAS.
- L. Flohé and W. A. Günzler, Assays of glutathione peroxidase, Methods Enzymol., 1984, 105, 114–120 Search PubMed.
- I. Carlberg and B. Mannervik, Glutathione reductase, Methods Enzymol., 1985, 113, 484–490 CAS.
- M. Warholm, C. Guthenberg, C. von Bahr and B. Mannervik, Glutathione transferases from human liver, Methods Enzymol., 1984, 113, 499–504 Search PubMed.
- S. T. Omaye, J. D. Tumball and H. E. Sauberlich, Selected methods for the determination of ascorbic acid in animal cells, tissues and fluids, Methods Enzymol., 1979, 62, 3–11 CAS.
- J. Sedlak and R. H. Lindsay, Estimation of total, protein-bound, and nonprotein sulfhydryl groups in tissue with Ellman's reagent, Anal. Biochem., 1968, 25, 192–205 CrossRef CAS PubMed.
- E. Beutler, O. Duron and B. M. Kelly, Improved method for the determination of blood glutathione, J. Lab. Clin. Med., 1963, 61, 882–888 CAS.
- V. M. Monnier and A. Cerami, Nonenzymatic browning in vivo: possible process for aging of long-lived proteins, Science, 1981, 211, 491–493 CAS.
- J. Folch, M. Lees and G. H. Sloane-Stanley, A simple method for the isolation and purification of total lipids from animal tissues, J. Biol. Chem., 1957, 226, 497–509 CAS.
- R. L. Searcy and L. M. Bergquist, A new color reaction for the quantitation of serum cholesterol, Clin. Chim. Acta, 1960, 5, 192–199 CrossRef CAS.
- J. C. M. Stewart, Colorimetric determination of phospholipids with ammonium ferrothiocyanate, Anal. Biochem., 1980, 104, 10–14 CrossRef CAS PubMed.
- M. J. Fletcher, A colorimetric method for estimating serum triglycerides, Clin. Chim. Acta, 1968, 22, 393–397 CrossRef CAS.
- F. H. Biase, M. M. Franco, L. R. Goulart and R. C. Antunes, Protocol for extraction of genomic DNA from swine solid tissues, Genet. Mol. Biol., 2002, 25, 313–315 CrossRef CAS.
- T. Nishikawa and E. Araki, Impact of mitochondrial ROS production in the pathogenesis of diabetes mellitus and its complications, Antioxid. Redox Signaling, 2007, 9, 343–353 CrossRef CAS.
- N. Kashihara, Y. Haruna, V. K. Kondetim and Y. S. Kanwar, Oxidative stress in diabetic nephropathy, Curr. Med. Chem., 2010, 17, 4256–4269 CrossRef CAS PubMed.
- P. S. Babu and K. Srinivasan, Amelioration of renal lesions associated with diabetes by dietary curcumin in streptozotocin diabetic rats, Mol. Cell. Biochem., 1998, 181, 87–96 CrossRef CAS.
- G. Liu, W. Ji, J. Huang, L. Liu and Y. Wang, 4-HNE expression in diabetic rat kidneys and the protective effects of probucol, J. Endocrinol. Invest., 2016, 39, 865–873 CrossRef CAS PubMed.
- C. V. Anuradha and P. Ravikumar, Restoration on tissue antioxidants by fenugreek seeds (Trigonella Foenum-graecum) in alloxan-diabetic rats, Indian J. Physiol. Pharmacol., 2001, 45, 408–420 CAS.
- K. Fukami, S. I. Yamagishi, M. T. Coughlan, B. E. Harcourt, P. Kantharidis and V. Thallas-Bonke, et al., Ramipril inhibits AGE-RAGE-induced matrix metalloproteinase-2 activation in experimental diabetic nephropathy, Diabetol. Metab. Syndr., 2014, 6, 86 CrossRef PubMed.
- K. Srinivasan, Plant foods in the management of diabetes mellitus: Spices as potential antidiabetic agents, Int. J. Food Sci. Nutr., 2005, 56, 399–414 CrossRef CAS PubMed.
- K. Fukami, S. I. Yamagishi, S. Ueda and S. Okuda, Role of AGEs in diabetic nephropathy, Curr. Pharm. Des., 2008, 14, 946–952 CrossRef CAS PubMed.
- T. D. Gilmore, Introduction to NF-κB: players, pathways, perspectives, Oncogene, 2006, 25, 6680–6684 CrossRef CAS PubMed.
- J. Quilley, M. Santos and P. Pedraza, Renal protective effect of chronic inhibition of COX-2 with SC-58236 in streptozotocin-diabetic rats, Am. J. Physiol., 2011, 300, H2316–H2322 CrossRef CAS PubMed.
- Y. Kikuchi, H. Nonoguchi, K. Machida, S. Wakamatsu, H. Koga and K. Tomita, Regulation of the apoptosis-related genes, Bax and Bcl-2 in the early stage of diabetes mellitus, Nephrology, 2002, 7, 294–302 CrossRef CAS.
- Y. Jin, Y. Shi, Y. Zou, C. Miao, B. Sun and C. Li, Fenugreek prevents the development of STZ-induced diabetic nephropathy in a rat model of diabetes, Evid. Based. Compl. Altern. Med., 2014, 259368 Search PubMed.
- R. H. Hsieh, L. M. Lien, S. H. Lin, C. W. Chen, H. J. Cheng and H. H. Cheng, Alleviation of oxidative damage in multiple tissues in rats with streptozotocin-induced diabetes by rice bran oil supplementation, Ann. N. Y. Acad. Sci., 2005, 1042, 365–371 CrossRef CAS PubMed.
- P. B. Pal, K. Sinha and P. C. Sil, Mangiferin attenuates diabetic nephropathy by inhibiting oxidative stress mediated signalling cascade, TNF-α related and mitochondrial dependent apoptotic pathways in streptozotocin-induced diabetic rats, PLoS One, 2014, 9, e107220 Search PubMed.
- P. Kumar, R. K. Kale and N. Z. Baquer, Antihyperglycemic and protective effects of Trigonella foenum-graecum seed powder on biochemical alterations in alloxan diabetic rats, Eur. Rev. Med. Pharmacol. Sci., 2012, 16, 18–27 Search PubMed.
- J. M. A. Hannan, L. Ali, B. Rokeya, J. Khaleque, M. Akhter, P. R. Flatt and Y. H. Abdel-Wahab, Soluble dietary fibre fraction of Trigonella foenum-graecum (fenugreek) seed improves glucose homeostasis in animal models of type 1 and type 2 diabetes by delaying carbohydrate digestion and absorption, and enhancing insulin action, Br. J. Nutr., 2007, 97, 514–521 CrossRef CAS PubMed.
- P. S. Devi and D. C. Shyamala, Protective effect of quercetin in cisplatin-induced cell injury in the rat kidney, Indian J. Pharmacol., 1999, 31, 422–426 Search PubMed.
- W. Xue, J. Lei, X. Li and R. Zhang, Trigonella foenum-graecum seed extract protects 694 kidney function and morphology in diabetic rats via its antioxidant activity, Nutr. Res., 2011, 31, 555–562 CrossRef CAS PubMed.
- N. A. El-Soud and M. Khalil, Antioxidative effects of Allium cepa essential oil in streptozotocin induced diabetic rats, Maced. J. Med. Sci., 2010, 3, 344–351 Search PubMed.
| This journal is © The Royal Society of Chemistry 2018 |


