 Open Access Article
Creative Commons Attribution 3.0 Unported Licence
Facile surface modification of nickel ferrite nanoparticles for inherent multiple fluorescence and catalytic activities
Souvanik Talukdar *a,
Rupali Rakshit
 ab,
André Krämerc,
Frank A. Müllerc and
Kalyan Mandala
aDepartment of Condensed Matter Physics & Material Science, S. N. Bose National Centre for Basic Sciences, JD Block, Sector-III, Salt Lake, Kolkata-700106, India. E-mail: souvanik.talukdar@bose.res.in
bIndian Institute of Science Education and Research Bhopal, Bhopal Bypass Road, Bhauri, Huzur, Bhopal, 462066, Madhya Pradesh, India
cOtto-Schott-Institut für Materialforschung (OSIM), Friedrich-Schiller-Universität Jena, Löbdergraben 32, 07743 Jena, Germany
First published on 2nd January 2018
Abstract
We synthesized biocompatible NiFe2O4 nanoparticles (NPs) with diameters below 10 nm by coating their surface with a tartrate ligand, which interestingly give rise to photoluminescence covering the entire visible region. The analyses with various spectroscopic tools reveal that the reason behind the unique fluorescence properties of functionalized NiFe2O4 NPs is ligand-to-metal charge-transfer transition from the highest occupied energy level of tartrate ligand to the lowest unoccupied energy level of Ni2+ and d–d transitions centered over Ni2+ ions in the NPs. These fluorescent NPs are also found to be suitable for cell imaging. Moreover, the functionalized NiFe2O4 NPs show a good catalytic activity on biologically and environmentally toxic pigments, such as bilirubin and methylene blue which leads to their wide application towards therapeutics and waste water treatment. We believe that the developed multifunctional NiFe2O4 NPs would stimulate the opportunities for advanced biomedical applications.
1. Introduction
With increasing applications, particularly in biomedical fields,1–5 multifunctional magnetic nanoparticles (MNPs) have attracted tremendous attention due to their potential to be used in ultrasound,6 optical and fluorescence imaging combined with targeted drug delivery,7–9 separation and purification of cells,10 tissue repairing,11 hyperthermia for cancer treatment12 as they result from biocompatibility, chemical stability and controlled transport properties. The MNPs are also useful in the field of catalysis since they are efficient for specific chemical transformations. In addition they are propitious economically and environmentally due to their elevated activity, sufficient stability, controlled separation by an external magnetic field, low cost, and facile synthesis.13–19MNPs with intrinsic fluorescence are in high demand. To be used in biomedical fields, they should possess criteria such as biocompatibility, monodispersity, dispersibility in water, and non-toxicity. The commonly used procedure for synthesizing magneto-fluorescent NPs involves processes like making nanocomposites with quantum dots (QDs) or coatings with fluorescent dyes. In order to make the NPs biocompatible, surface modifications were carried out with biomolecules like proteins, DNA, RNA, small organic ligands, and polymers, but none of them were able to generate intrinsic fluorescence. In addition, their applications towards the biomedical field are narrowed due to chemical instability, photobleaching of fluorescent dyes, and inherent toxicity of QDs (due to the presence of heavy metals like Cd2+, Pb2+).20 Therefore, to open up a wide applicability of the nanoparticles (NPs) in biomedical field, a facile and proper process for surface modification is highly required. The main purpose of our present work is to design water dispersible 3d transition metal oxide based MNPs with intrinsic fluorescence for their applications in cell imaging.
Our work has involved both the synthesis and development of NiFe2O4 NPs as multifunctional nano-probes bearing inherent multicolour photoluminescence and their development of in vitro cell imaging. Moreover, we have utilized the developed MNPs in catalysis. Using ligand field theory (LFT), we have assigned the electronic transitions responsible for the coloured photoluminescence of the functionalized NiFe2O4 NPs. We tried the functionalized NPs as cell imaging agent and found them worthy to be used in imaging applications.
2. Experiment
We synthesized NiFe2O4 NPs with minimal modification, by following a wet chemical method previously reported by Sun et al.21 We heated a solution mixture of iron(III) acetylacetonate, nickel(II) acetate, diphenyl ether, oleylamine, and oleic acid to 270 °C for 1 h in presence of cetyl alcohol instead of 1,2-hexadecanediol used by Sun et al.21 The as-synthesized NiFe2O4 NPs were then washed by ethanol, and subsequently collected after centrifugation followed by removal of mother solution. Then as-synthesized NiFe2O4 NPs were dried by heating the NPs on a hotplate at a temperature of 80 °C for 30 min. In order to functionalize the as-prepared NiFe2O4 NPs with tartrate ligands, we put the as-prepared solid NPs with 0.5 M Na-tartrate solution (pH ∼ 7) in glass vial. Then the glass vial was placed on a vibrator rotor for vigorous vibration, and the rotation was done at room temperature for 12 h. The non-solubilised NiFe2O4 NPs were filtered by passing the functionalized NP-solution mixture through a syringe filter of diameter 0.22 μm. We obtained a clear solution of tartrate-functionalized NiFe2O4 NPs, called T-NiFe2O4 NPs.The X-ray powder diffraction (XRD) of as-prepared NiFe2O4 NPs was carried out using Rikagu miniflex II diffractometer equipped with Cu Kα radiation (at 40 mA and 40 kV) at the scanning rate of 3° per minute in the 2θ range of 20–70°. A FEI Technai G2 TF-20 field-emission high-resolution transmission electron microscope (TEM), operated at 200 kV was used to study the size distribution, shape, morphology and to record the Energy-dispersive X-ray analysis (EDX) spectrum of the as-prepared and functionalized NiFe2O4 NPs. The ultraviolet-visible (UV/Vis) absorbance spectra of T-NiFe2O4 NPs were obtained on a Shimadzu UV-2600 spectrophotometer, using a quartz cuvette of 1 cm path length. A Horiba Jovin Yvon Model Fluorolog fluorimeter was used to carry out the steady-state fluorescence emission and excitation study of T-NiFe2O4 NPs. Fluorescence micrographs of T-NiFe2O4 NPs were captured using a Leica DM1000 LED fluorescence microscope.
To be sure of the attachment of tartrate molecules to the NPs' surface, Fourier transform infrared spectroscopy (FTIR) measurements were performed using a JASCO FTIR-6300 spectrometer. For FTIR study, pellets were made after homogeneous mixing of lyophilized T-NiFe2O4 powder samples with KBr. The background was corrected using a reference KBr pellet. To estimate the loading of the tartrate functionalization, we performed thermogravimetry (TG) on the T-NiFe2O4 and bare NiFe2O4 NPs using PerkinElmer Diamond TG/DTA with the heating rate of 10 °C min−1. The magnetic measurements were performed using a Lake Shore Vibrating Sample Magnetometer (VSM).
For cell culture tests, cells of the human osteosarcoma cell line Cal-72 were ordered from the DSMZ (Leibniz Institute DSMZ – German Collection of Microorganisms and Cell Culture, DSMZ no. ACC 439). The cells were cultivated in Dulbecco's Modified Eagle Medium with a concentration of 10% foetal bovine serum. After three days the medium was removed and replaced by mixtures of culture medium and functionalized NPs at concentrations of 6, 2, and 0.5 mg mL−1. After one day those mixtures were removed and the cells were fixed using 3% paraformaldehyde in Phosphate Buffered Saline (PBS). Cytotoxicity was performed by watching the phenotype and condition of the cells for several hours using a high resolution optical microscope. Images of the cells along with NPs were taken using a Laser Scanning Microscope (LSM).
In the photocatalytic study, an 8 W UV lamp with a wavelength of 253.7 nm (UV-C) was used. The aqueous solution of T-NiFe2O4 NPs (50 μL, containing 0.06 mg NPs) and 5 μM aqueous solution of methylene blue (MB) (pH ∼ 3) were uniformly mixed in a quartz cuvette for 1 h in the dark. Then, the cuvette was kept 2 cm away from the light source and the absorbance spectra of MB in presence of T-NiFe2O4 NPs solution was measured periodically by Shimadzu UV-2600 UV/Vis spectrophotometer. The very first recorded set of data of absorbance was marked as 0 minute. After 60 minutes of irradiation (first cycle), we further added 5 μL methylene blue solution to the reaction mixture but the catalyst solution was not added for the second cycle. Similar procedure was maintained up to 5 cycles.
In order to determine the catalytic activity of functionalized NPs, the aqueous solution of T-NiFe2O4 NPs (50 μL, containing 0.06 mg NPs) were added to 15 μL of aqueous solution of bilirubin (BR) (pH ∼ 7) kept in a quartz cuvette under continuous stirring in the dark. Then the absorbance spectra of BR in presence of T-NiFe2O4 NPs solution were recorded at times by using UV/Vis spectrophotometer. The reusability study was carried out by the similar procedure as we did for photocatalysis up to 3 cycles.
3. Results and discussion
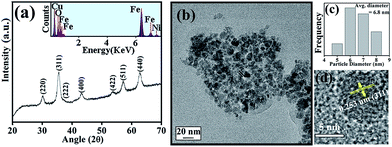
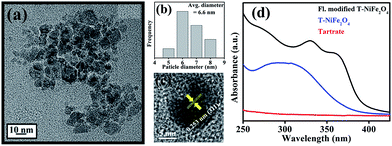
The XRD pattern as shown in Fig. 1(a) is consistent with the standard inverse spinel face centered cubic structure of NiFe2O4 (JCPDS card no. 10-0325). The EDX spectrum of NiFe2O4 NPs in the inset of Fig. 1(a) affirms the presence of nickel, iron and oxygen. To obtain the morphology and particle size of as-synthesized NiFe2O4 NPs, we carried out TEM analysis, as shown in Fig. 1(b). From Fig. 1(c), it is apparent that the NPs have a size distribution with an average diameter of 6.8 nm. The high-resolution transmission electron microscope (HRTEM) image, as shown in Fig. 1(d) depicts the highly crystalline nature of the as-prepared NiFe2O4 NPs. The measured interplanar distance between lattice fringes is around 0.253 nm, which corresponds to the distance between the (311) planes of the NiFe2O4 crystal lattice.To make the NiFe2O4 NPs biocompatible and water-dispersible, we have functionalized the as-prepared NPs with the aqueous solution of a small organic ligand, Na-tartrate. After surface functionalization, the size of the NPs was found to remain almost unchanged with an average diameter of 6.6 nm, as evident from Fig. 2(a) and the size distribution graph shown in Fig. 2(b). The HRTEM image (shown in Fig. 2(c)) of the functionalized NPs (T-NiFe2O4) shows its crystalline nature. Interestingly, the UV/Vis absorption spectra of T-NiFe2O4 NPs (pH ∼ 7) is found to exhibit a broad absorption feature at around 302 nm as shown in Fig. 2(d), indicates that the tartrate ligand affects the surface electronic structure of bare NiFe2O4 NPs significantly upon functionalization.
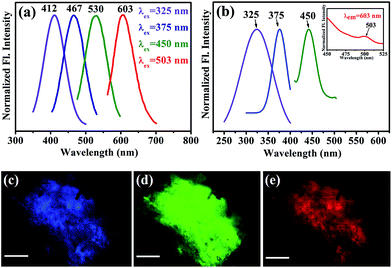
After obtaining knowledge from the UV/Vis spectra of functionalized NiFe2O4 NPs, we have performed a photoluminescence study and have observed photoluminescence at 412 nm (low intensity) on exciting the sample at wavelength of 325 nm. To intensify the photoluminescence, we have carried out further surface modification by heating the functionalized NiFe2O4 NPs solution for 42 h at 70 °C and pH ∼ 12 which we call fluorescence modified (fl. mod.) T-NiFe2O4 NPs. They were found to exhibit another absorption band at 365 nm in addition to the band at 325 nm as shown in Fig. 2(d). The surface modification is found to result in three photoluminescence peaks with many fold increase in overall intensity, upon excitation at proper wavelengths as shown in Fig. 3(a), the normalized steady state photoluminescence emission spectra of fl. mod. T-NiFe2O4 NPs. This is due to an increase in the strength of the coordination between the functional groups of the ligand (–COO− and –OH moieties) and the metal ion (Ni2+) which leads to three more photoluminescence peaks as well as a huge increase in photoluminescence intensity of T-NiFe2O4 NPs. Upon exciting with wavelengths of 325, 375, 450, and 503 nm, the NPs solution gave rise to significant photoluminescence peaks at 412, 467, 530, and 603 nm, respectively. These bands are clearly distinguishable also in the excitation study as shown in Fig. 3(b). The fluorescence micrographs of fl. mod. T-NiFe2O4 NPs show the photoluminescent colors like blue (Fig. 3(c)), green (Fig. 3(d)) and red (Fig. 3(e)) on excitation of at 375, 450, and 515 nm, respectively, by using proper filters for the excitation wavelengths.
The LFT efficiently explains the generation of multicolour photoluminescence. Based on the LFT a ligand co-ordination with the NPs' surface plays the key role, which yields the crystal field splitting energy (CFSE) (Δ) generated from d orbital splitting with a magnitude determined by the ligands and a given coordination symmetry. The strength of the metal–ligand σ bond increases as a function of increasing basicity of the solution. As the basicity of the solution increases, the 2-carboxyl and 2-hydroxyl groups become deprotonated resulting in larger interactions with the metal ions and as an outcome, CFSE (Δ) associated with the ligand increases which finally lead to an increased splitting between the previous degenerate d orbitals. The emission peaks at 467, 530 and 603 nm can be attributed to 3A2g (F) → 3T1g (P), 3A2g (F) → 3T1g (F) and 3A2g (F) → 3T2g (F) transitions involving d–d orbitals of Ni2+ ions respectively, where these energy levels were obtained from the Tanabe Sugano diagram of Ni2+. These d–d transitions are formally spin allowed transitions. Note that d–d transitions involving only Fe3+ are not efficient for the development of intense fluorescence.22 On the other hand, due to strong ligand to metal charge transfer (LMCT) from HOMO (Highest Occupied Molecular Orbital, centered on the ligand) to LUMO (Lowest Unoccupied Molecular Orbital, centered on the metal ions), bonding interactions between the metal and the ligand increases considerably. Therefore, the photoluminescence peak arising at 412 nm can be attributed to LMCT involving HOMO of tartrate ligand and LUMO centered over metal ion Ni2+.23 The Quantum Yield (QY) is calculated by taking rhodamine B (Rh B) as the standard fluorescent compound and the obtained QYs are 15.13% for the 412 nm band, 1.6% for the 467 nm band and the 0.15% for 530 nm band of fl. mod. T-NiFe2O4 NPs.
In order to confirm the attachment of the tartrate molecules to the surface of NiFe2O4 NPs, we carried out the FTIR study of bare NiFe2O4 NPs, T-NiFe2O4 NPs and pure tartrate ligand. As depicted in Fig. 4(a), the peak arising at 587 cm−1 is due to stretching vibration of metal–oxygen bonds in NiFe2O4. The peak at 587 cm−1 is absent in T-NiFe2O4 NPs. Two sharp peaks arising at 1066 and 1112 cm−1 in the case of tartrate ligand are due to C–OH stretching modes24 and two other peaks at 1411 and 1621 cm−1 are due to the symmetric and asymmetric stretching of the COO−.25 In the case of T-NiFe2O4 NPs, due to the interactions between NPs surface and the functional group moieties of the ligand, all the bands are distinctly perturbed along with the band at 3399 cm−1 which arises because of the stretching vibrational modes of the O–H group.24 This clearly indicates the involvement of –COO− and –OH group in the functionalization. thermogravimetric analysis (TGA) data of the as-prepared and tartrate functionalized Nickel ferrite measured under nitrogen atmosphere from 100 to 400 °C and shown in Fig. 4(b). The amount of tartrate ligand bound to the nanoparticle surface was calculated from the TGA data and found to be ∼1.88 wt% of the T-NiFe2O4 NPs.
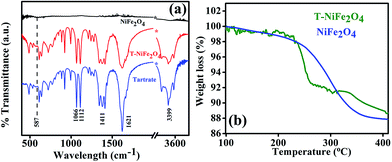 | ||
| Fig. 4 (a) FTIR spectra of as-prepared NiFe2O4 and T-NiFe2O4 NPs together with pure Na-tartrate, (b) TGA curve of as-prepared NiFe2O4 and T-NiFe2O4 NPs. | ||
The room temperature magnetic behaviour of the as-prepared and T-NiFe2O4 NPs were studied by VSM. Fig. 5 depicts the M–H loops of both as-prepared and functionalized NiFe2O4 NPs. From Fig. 5(a) and (b) it is found that the saturation magnetization and coercivity are reduced from 37.1 emu g−1 to 11.7 emu g−1 and from 0.04 kOe to 0.02 kOe, respectively, in case of T-NiFe2O4 NPs in comparison with as-prepared NiFe2O4 NPs. The tartrate ligand contains both σ donor (–OH) and π donor (–COO−) groups which results in immense LMCT and spin pairing of Ni2+ ions in T-NiFe2O4 NPs, which reduces the saturation magnetization.26
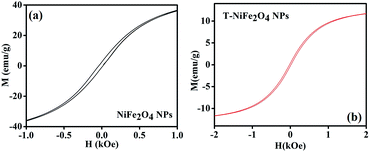 | ||
| Fig. 5 (a) Plot of magnetization versus applied magnetic field (M–H) of as-prepared NiFe2O4 NPs at 300 K, (b) M–H plot for T-NiFe2O4 NPs at 300 K. | ||
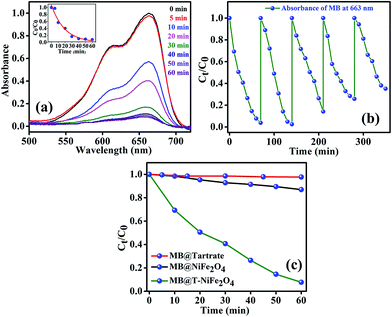
After efficiently incorporating the intrinsic fluorescence in NiFe2O4 NPs, we inspected the optical excitation of the functionalized NiFe2O4 NPs in photocatalysis for waste water treatment. The functionalized NiFe2O4 NPs were found to possess efficient photocatalytic properties (as shown in Fig. 6(a)). In case of the degradation of MB, a frequently used dye in textile industries and a model water-contaminant, a catalytic effect occur after UV light irradiation. We found that the photodegradation of MB in presence of functionalized NiFe2O4 NPs at pH ∼ 3 takes place exponentially with time following a first-order rate equation (by fitting with equation A = A0e−kt) with a kinetic rate constant k = 2.82 × 10⁻² min−1. We also carried out a reusability test of the catalyst with 70 min of time interval as shown in Fig. 6(b). We kept adding MB up to 5 cycles by keeping the concentration of the catalyst same (by not adding more catalyst after the 1st cycle). We measured the decomposition rate of the MB by monitoring the absorbance at 663 nm by UV/Vis spectroscopy that had led to conclude the reusability of T-NiFe2O4 NPs as a catalyst. The comparative rate of degradation of MB by Na-tartrate, bare NiFe2O4 NPs and T-NiFe2O4 NPs is shown in Fig. 6(c).
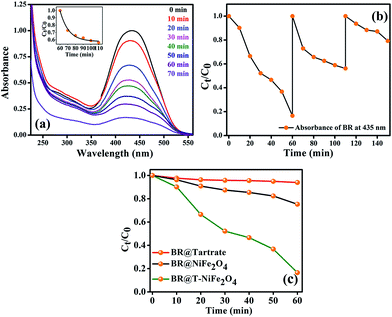
Stimulated by the photocatalytic property of the functionalized NiFe2O4 NPs on MB, we have performed similar experiment on a biologically toxic pigment, BR which is responsible for the occurrence of yellow coloration of skin in jaundice. T-NiFe2O4 NPs shows a good catalytic activity in the degradation of BR without any photoexcitation at pH ∼ 7 at room temperature as shown in Fig. 7(a). The reaction follows first order kinetics with the reaction rate constant k = 6.5 × 10⁻³ min−1. We investigated the recyclability of the catalytic efficiency of T-NiFe2O4 for degradation of BR by adding the same amount of BR to the reaction mixture in every 60 min up to 3 cycles, keeping the concentration of the catalyst unchanged. We measured the fall in absorbance of the BR at 435 nm at regular intervals by UV/Vis spectroscopy. The plot of relative BR concentration as a function of time for up to three consecutive cycles, as demonstrated in Fig. 7(b), confirms the reusability of the T-NiFe2O4 NPs catalyst. Fig. 7(c) depicts the rate of degradation of BR by Na-tartrate, bare NiFe2O4 NPs and T-NiFe2O4 NPs.
Fig. 8 shows human osteosarcoma cells in the presence of culture medium with a NP concentration of 2 mg mL−1. From Fig. 8(a) it can be deduced that the cells are alive and in a good condition indicating the non-toxicity of the NPs. Fig. 8(b) shows that NPs adhere to cells and fluoresce under illumination with light of appropriate wavelength and intensity.
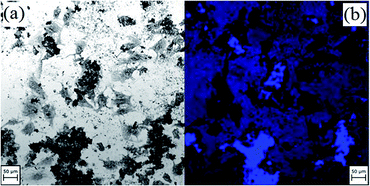 | ||
| Fig. 8 Osteosarcoma cells with T-NiFe2O4 NPs at a concentration of 2 mg mL−1 cell medium in (a) bright field and (b) LSM with an excitation wavelength of 370 nm. | ||
4. Conclusions
Through easy surface modification of NiFe2O4 NPs with Na-tartrate ligands, we have prepared biocompatible multifunctional nanoparticles with intrinsic fluorescence properties covering the whole visible region, ranging from blue, and green, to red. The NPs are found to be efficient in cell imaging using this inherent fluorescent property. Additionally, the T-NiFe2O4 NPs show good catalytic and photocatalytic activity in the degradation of biologically and environmentally toxic pigments [bilirubin and methylene blue] respectively. A thorough experimental and theoretical study has revealed that the LMCT transition from the highest occupied energy level of the tartrate ligand to lowest unoccupied energy levels of Ni2+ and d–d transitions centered over Ni2+ ions on the NPs' surface play crucial roles in the generation of multicolor fluorescence from the T-NiFe2O4 NPs. We trust that the development of these multifunctional T-NiFe2O4 NPs will open new opportunities in the field of diagnostics, such as bio-imaging, therapeutics and drug delivery, as well as in wastewater treatment of contaminants.Conflicts of interest
There are no conflicts to declare.Acknowledgements
Authors like to thank Mr Samik Roy Moulik, Ms Urmi Chakraborty and Mr Dipankar Roy for performing TEM, TGA and VSM measurements, respectively. Financial support to one of the authors (K. M.) from Alexander von Humboldt Foundation, Germany is gratefully acknowledged.References
- L. H. Reddy, J. L. Arias, J. Nicolas and P. Couvreur, Chem. Rev., 2012, 112, 5818–5878 CrossRef CAS PubMed.
- A. K. Gupta and M. Gupta, Biomaterials, 2005, 18, 3995–4021 CrossRef PubMed.
- R. Rakshit, M. Pal, A. Chaudhuri and K. Mandal, APL Mater., 2015, 3, 110701–110706 CrossRef.
- M. Colombo, S. Carregal-Romero, M. F. Casula, L. Gutiérrez, M. P. Morales, I. B. Böhm, J. T. Heverhagen, D. Prosperi and W. J. Parak, Chem. Soc. Rev., 2012, 41, 4306–4334 RSC.
- F. Yang, Y. Li, Z. Chen, Y. Zhang, J. Wu and N. Gu, Biomaterials, 2009, 30, 3882–3890 CrossRef CAS PubMed.
- H. B. Na, I. C. Song and T. Hyeon, Adv. Mater., 2009, 21, 2133–2148 CrossRef CAS.
- O. Veiseh, J. W. Gunn and M. Zhang, Adv. Drug Delivery Rev., 2010, 62, 284–304 CrossRef CAS PubMed.
- M. Liong, J. Lu, M. Kovochich, T. Xia, S. G. Ruehm, A. E. Nel, F. Tamanoi and J. I. Zink, ACS Nano, 2008, 2, 889–896 CrossRef CAS PubMed.
- D. L. J. Thorek, A. K. Chen, J. Czupryna and A. Tsourkas, Ann. Biomed. Eng., 2006, 34, 23–38 CrossRef PubMed.
- M. Tamura, F. Yanagawa, S. Sugiura, T. Takagi, K. Sumaru, H. Matsui and T. Kanamori, Sci. Rep., 2014, 4, 4793–4798 CrossRef CAS PubMed.
- N. Tran and T. J. Webster, Wiley Interdiscip. Rev.: Nanomed. Nanobiotechnol., 2009, 1, 336–351 CrossRef CAS PubMed.
- M. Johannsen, U. Gneveckow, L. Eckelt, A. Feussner, N. Waldöfner, R. Scholz, S. Deger, P. Wust, S. A. Loening and A. Jordan, Int. J. Hyperthermia, 2005, 21, 637–647 CrossRef CAS PubMed.
- Y. Li, H. Tan, X. Y. Yang, B. Goris, J. Verbeeck, S. Bals, P. Colson, R. Cloots, G. V. Tendeloo and B. L. Su, Small, 2011, 7, 475–483 CrossRef CAS PubMed.
- P. Zhang, Y. Zhan, B. Cai, C. Hao, J. Wang, C. Liu, Z. Meng, Z. Yin and Q. Chen, Nano Res., 2010, 3, 235–243 CrossRef CAS.
- M. B. Gawande, V. D. B. Bonifacio, R. S. Varma, I. D. Nogueira, N. Bundaleski, C. A. A. Ghumman, O. M. N. D. Teodoro and P. S. Branco, Green Chem., 2013, 15, 1226–1231 RSC.
- M. B. Gawande, A. K. Rathi, I. D. Nogueira, R. S. Varma and P. S. Branco, Green Chem., 2013, 15, 1895–1899 RSC.
- M. B. Gawande, P. S. Branco and R. S. Varma, Chem. Soc. Rev., 2013, 42, 3371–3393 RSC.
- M. Pal, A. K. Singh, R. Rakshit and K. Mandal, RSC Adv., 2015, 5, 16311–16318 RSC.
- M. Pal, R. Rakshit and K. Mandal, Appl. Phys. Lett., 2014, 104, 233110–233114 CrossRef.
- X. Ren, L. Tong, X. Chen, H. Ding, X. Yang and H. Yang, Phys. Chem. Chem. Phys., 2014, 16, 10539–10547 RSC.
- S. Sun, H. Zeng, D. B. Robinson, S. Raoux, P. M. Rice, S. X. Wang and G. Li, J. Am. Chem. Soc., 2004, 126, 273–279 CrossRef CAS PubMed.
- J. E. Huheey, E. A. Keiter, R. L. Keiter and O. K. Medhi, Inorganic Chemistry: Principles of Structure and Reactivity (Fourth Edition), Pearson Education, 2006 Search PubMed.
- M. Pal, R. Rakshit and K. Mandal, ACS Appl. Mater. Interfaces, 2014, 6, 4903–4910 CAS.
- N. Kaneko, M. Kaneko and H. Takahashi, Spectrochim. Acta, Part A, 1984, 40, 33–42 CrossRef.
- V. Ramakrishnan and J. M. T. Maroor, Infrared Phys., 1988, 28, 201–204 CrossRef CAS.
- R. Rakshit, M. Pal, M. Mandal and K. Mandal, Mater. Lett., 2015, 151, 64–67 CrossRef CAS.
| This journal is © The Royal Society of Chemistry 2018 |

