 Open Access Article
The effect of MDI on the structure and mechanical properties of poly(lactic acid) and poly(butylene adipate-co-butylene terephthalate) blends
Hongwei Panab,
Zonglin Liab,
Jia Yangc,
Xin Lic,
Xue Aid,
Yanping Haoa,
Huiliang Zhang *a and
Lisong Donga
aKey Laboratory of Polymer Ecomaterials, Chinese Academy of Sciences, Changchun Institute of Applied Chemistry, Changchun 130022, China. E-mail: hlzhang@ciac.ac.cn; Tel: +86-431-85262689
bUniversity of Chinese Academy of Sciences, Beijing, 10080, China
cChangchun University of Technology, Changchun 130012, China
dCollege of Chemical and Environmental Engineering, Shandong University of Science and Technology, Qingdao 266510, China
First published on 25th January 2018
Abstract
In this work, poly(lactic acid) and poly(butylene adipate-co-terephthalate) (PLA/PBAT 50/50) were melt-blended in the presence of 4,4′-methylene diphenyl diisocyanate (MDI) which acted as a reactive chain extender. The mechanical properties, phase morphology, thermal behavior and crystalline structure of the blends were investigated. Fourier transform infrared measurements revealed that some remarkable chemical interaction had taken place between the two polymers and MDI. Upon increasing the content of MDI, the blends showed increased tensile strength and elongation at break. With the addition of 0–2 wt% MDI, the impact strength of PLA/PBAT-MDI blends increased from 7.0 kJ m−2 to 70.0 kJ m−2. A large shift towards each other in terms of the glass transition temperature was observed by DMA and DSC analysis. SEM micrographs showed not only a reduction in the PBAT phase size but also a significant increase in interfacial adhesion between the PLA and PBAT phases with increasing of MDI. Furthermore, the toughening mechanism of the oriented samples was confirmed by wide-angle X-ray diffraction (WAXD) and small-angle X-ray scattering (SAXS) images; it was possible for the smaller crystallites of blends to form during the course of chain extension.
1. Introduction
Among bio-sourced polymers, poly(lactic acid) (PLA) is a linear aliphatic polyester which can be produced from the renewable biomass such as corn, and it is also biodegradable in the ambient environment.1,2 Extensive works related to PLA synthesis, chemical, physicochemical and mechanical properties have been performed. However, low degradation rate, relatively high cost and high inherent brittleness are considered as limitations for its applications. Blending PLA with other polymers is one of the several methods to overcome the aforementioned limitations. The toughening modification of PLA has been extensively investigated, such as copolymerizing lactides with other monomers or macromolecules, and blending PLA with flexible polymers or plasticizers to obtain flexible PLA-based copolymers.3 The biodegradable aliphatic polyesters used for toughening PLA mainly include polypropylene carbonate (PPC),2,4–6 poly(butylene adipate-co-terephthalate) (PBAT),7–10 poly(ε-caprolactone) (PCL),11,12 polyamide 11 (PA11).13 poly(butylene-succinate-co-adipate) (PBSA),14 poly(butylenes succinate) (PBS),15,16 poly[(ethylene oxide)-block-(amide-12)](PEBA),17–19 etc.Compared with copolymerization, blending modification of PLA is more economical and more suitable for industrialized production. However, most of these blends are immiscible. A chain extender is used to modify and improve the properties of the immiscible polymer, not only the intrinsic properties of the blend components, but also the control of the dispersed phase diameter. The final properties of the blend can be affected profoundly.
Macroscopic deformation behavior and physical properties of immiscible heterogeneous polymer blends may be enhanced by compatibilization through the introduction of physical or (and) chemical interactions between the components.20 The presence of functional groups in polymer chains, giving rise to specific interactions with the blend constituent, can enhance the interfacial adhesion and phase dispersion, and improve the overall characteristics of the systems.21
Poly(butylene adipate-co-terephthalate), a copolymer of butylene adipate (BA) and butylene terephthalate (BT) characterized as an ideal random copolymer with a molar ratio of aliphatic to aromatic units around 1![[thin space (1/6-em)]](https://www.rsc.org/images/entities/char_2009.gif) :
:![[thin space (1/6-em)]](https://www.rsc.org/images/entities/char_2009.gif) 1,22 has been studied more extensively due to its compatibility with PLA, high elongation at break, high impact strength and biodegradability. Concerning the PBAT polymer, it was reported that the introduction of aromatic polyester into the backbone chain of aliphatic polyester improved both the mechanical properties and the melt strength. Moreover, the crystallization phenomena of the two polymers were disparate.
1,22 has been studied more extensively due to its compatibility with PLA, high elongation at break, high impact strength and biodegradability. Concerning the PBAT polymer, it was reported that the introduction of aromatic polyester into the backbone chain of aliphatic polyester improved both the mechanical properties and the melt strength. Moreover, the crystallization phenomena of the two polymers were disparate.
The earlier attempt has shown that PBAT effectively increased the impact strength of PLA in melting process.23 Nevertheless, the compatibility is not sufficient due to the poor interactions and poor interfacial adhesion at a molecular level which lead to non-thermodynamically stable morphologies after mixing.24,25 Recently, the PLA/PBAT blends containing two crystalline components have been investigated and documented in the literature. A challenge exists for the immiscible is the phase-separated morphology, which leads to deterioration of desirable properties. Zhou et al. reported the miscibility and crystallization behavior of PBAT and PLA blends. They investigated that the synergetic function of elongational flow field and “chain mobility promoter” could efficaciously promote the motion of PLA molecular chain to develop oriented crystalline architecture, and elongational flow field could deform the dispersed phase PBAT into nanofibrils featuring large specific surface area to perfect the phase interface.26 Dil et al. studied the morphology and miscibility of PLA and PBAT blends in detail, the dispersed PBAT phase diameter showed a significant increase in diameter with incorporate minor phase concentration, but more a result of the partial miscibility phenomenon, and the continuous and co-continuous morphology development in polymer blends with different types of the interfaces showed a highly interacting.27 The results of these studies clearly indicate that the level of interaction between components in low interfacial tension polymer blends and their mutual miscibility/immiscibility can have a determining effect on the morphology development.
Recently, additives called chain extenders as well as compatibilizers in polymer blends have been developed to improve melt strength, thermal stability in polymer blends.28 Al-Itry et al.29–32 demonstrated that incorporation of a chain extender lead to an improvement of the melt strength and a better compatibilization for PLA/PBAT blends. In order to enhance the in situ compatibilization, crosslinking was also introduced in the work by adding triallyl isocyanurate (TAIC), dicumyl peroxide (DCP), and 4,4′-methylene diphenyl diisocyanate (MDI). MDI is one of the chain extenders widely used in two component systems based on reactive polyurethane chemistry because it contains two isocyanate groups, and it has highly reactive to carboxyl and hydroxyl groups, thus MDI was employed to improve the interfacial compatibility.33 The isocyanate groups readily react with the hydroxyl and carboxylic acid groups to form urethane groups. Li et al.34 have studied that the thermal and mechanical performance of PLA can be increased by reacting with MDI at an appropriate portion. Zhao et al.35 used MDI to improve the compatibility of PLA and TPU phases, and decreased the dispersed TPU phase size. Wang et al.36,37 approved that the MDI appeared to function as a coupling agent, improved the interfacial interaction, and consequently, enhanced the mechanical properties of the PLA and starch blends.
In this study, the biodegradable PLA/PBAT blends were prepared by melt compounding using chain extenders to enhance in compatibilization. This study explained the question of the influence of a crystalline phase on the tensile drawing behavior and the strain-induced structural changes in PLA and PBAT. The phase morphologies and crystallization behaviors of PLA/PBAT-MDI blends were examined by using SEM, WAXD, and SAXS. The purpose of the present study is to understand the miscibility and crystallization behavior in the crystalline polymer blends. It was expected that chain extension technology would be effective in improving the properties of the immiscible polymer and consequently expanding the utilization of PLA and PBAT.
2. Experimental
2.1 Material and sample preparation
2.2 Characterization and measurements
 | (1) |
 ” is the enthalpy of fusion for a crystal having infinite crystal thickness (93 J g−1 for PLA and 114 J g−1 for PBAT).38
Wide angle X-ray diffraction experiments of blends were performed on a D8 advance X-ray diffractometer (Bruker, Germany) at room temperature in the range of 5–55° at a scanning rate of 4° min−1. The Cu Kα radiation (λ = 0.15418 nm) source was operated at 40 kV and 200 mA.
The apparent crystal size (ACS) of PLA/PBAT blends was estimated by Scherrer's eqn (2) and (3):39
 | (2) |
| β = (B2 − b2)1/2 | (3) |
In situ synchrotron SAXS measurements were performed at the beamline 1W2A at BSRF, Beijing, China, with the wavelength of synchrotron X-ray radiation being 0.154 nm. At this distance the effective scattering vector q (q = (4π![[thin space (1/6-em)]](https://www.rsc.org/images/entities/char_2009.gif) sin
sin![[thin space (1/6-em)]](https://www.rsc.org/images/entities/char_2009.gif) θ)/λ, where 2θ is the scattering angle and λ is the wavelength) range is 0.20–1.60 nm−1. The X-ray exposure time was 60 min. Here, I is the experimental SAXS intensity. The long spacing (dac), which was defined as the crystal layer thickness together with one interlamellar amorphous layer, measured along the lamella normal and calculated using Bragg eqn (4).40 The crystal layer thickness dc and the amorphous layer thickness da can be calculated using eqn (5) and (6), respectively.
θ)/λ, where 2θ is the scattering angle and λ is the wavelength) range is 0.20–1.60 nm−1. The X-ray exposure time was 60 min. Here, I is the experimental SAXS intensity. The long spacing (dac), which was defined as the crystal layer thickness together with one interlamellar amorphous layer, measured along the lamella normal and calculated using Bragg eqn (4).40 The crystal layer thickness dc and the amorphous layer thickness da can be calculated using eqn (5) and (6), respectively.
 | (4) |
| dc = dac × Xc,2 | (5) |
| da = dac − dc | (6) |
3. Results and discussion
3.1 Fourier transform infrared spectroscopy analysis
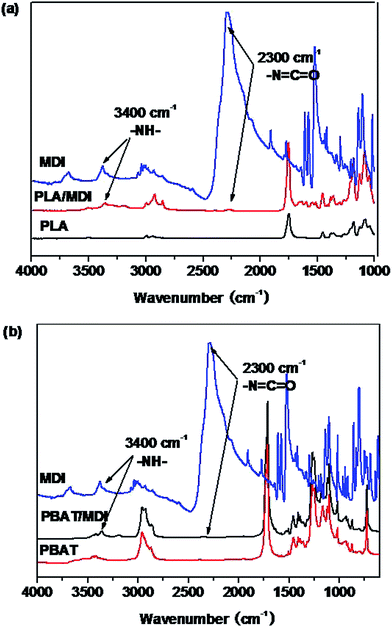
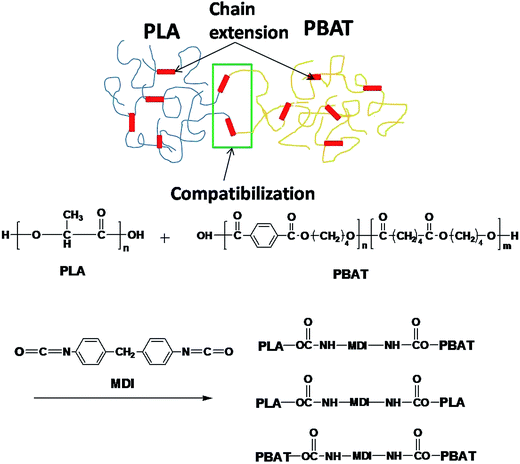
Fig. 1 shows the FTIR spectra of the PLA/MDI and PBAT/MDI blends. Both PLA and PBAT can form branched and/or crosslinked structures with chain extender as shown in Scheme 1. As a consequence, complex reaction products could be obtained, including branched PLA, branched PBAT and PLA-crosslink-PBAT network. It was suggested that diisocyanate can connect the hydroxyl end groups of PLA and PBAT molecules through urethane bonds as shown in reaction of Scheme 1. The N–H absorption peak appeared at 3400 cm−1, the stretching band corresponding to the isocyanate group was not found at 2270 cm−1, indicating that the initial isocyanate groups completely reacted with the PLA and PBAT. The sharp absorption peaks around 1730–1700 cm−1 are typical for the stretching vibration of esters C![[double bond, length as m-dash]](https://www.rsc.org/images/entities/char_e001.gif) O, the 1220 cm−1 absorption peak caused by the vibration of C
O, the 1220 cm−1 absorption peak caused by the vibration of C![[double bond, length as m-dash]](https://www.rsc.org/images/entities/char_e001.gif) C in benzene ring. As in the Scheme 1 shows the chain extension reaction of free radicals.
C in benzene ring. As in the Scheme 1 shows the chain extension reaction of free radicals.
3.2 Rheological properties
Fig. 2 shows the rheological test results of the plate and rotor from a dynamic frequency sweep test of the two polymers. Master curves of G′ and |η*| at a reference temperature of 200 °C were built using the time–temperature superposition principle. The PBAT could enhance the elasticity of PLA, and improve largely its melt strength. The G′ of the PLA/PBAT-MDI blends showed special viscoelastic relaxation behavior and exhibited a distinct plateau at low frequencies. With the addition of 1.0 to 2.0 wt% MDI, the G′ slopes of the blends increased at low frequencies. These results revealed that the compatibility behavior of MDI enhanced the interaction in the blends and promoted formation of the network structure. With the addition of MDI, it was worth noting that |η*| of the PLA/PBAT-MDI samples increased at all frequency. However, a decreasing complex viscosity is observed with the frequency increases. These changes indicated that the addition of MDI greatly increased the molecular interactions of the blend, and the movement of molecular chains was hindered remarkably due to the chain extension. It is because isocyanate group in the MDI molecules form N–H bonds with the oxygen atoms of PLA and PBAT, so that the elasticity and viscosity of the blends increase simultaneously.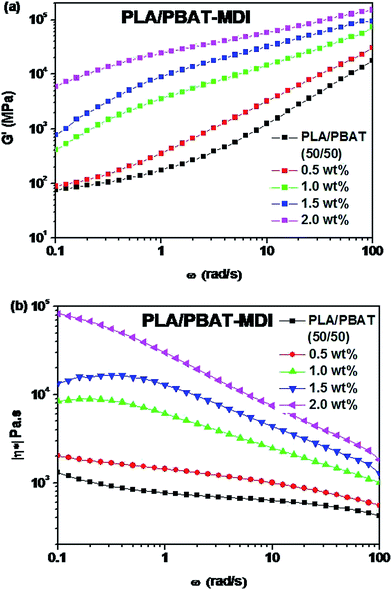 | ||
| Fig. 2 Rheological behaviors of PLA/PBAT-MDI blends: (a) storage modulus (G′), (b) complex viscosity (|η*|). | ||
3.3 Mechanical properties
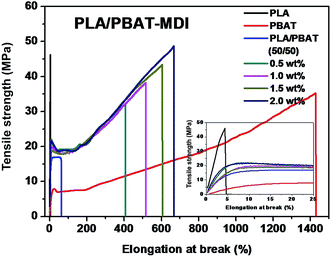
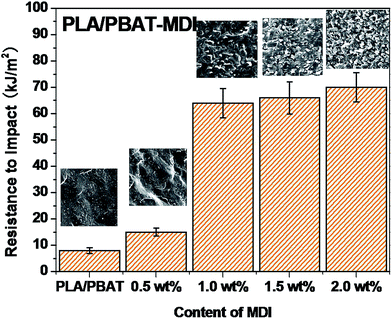
A tensile deformation test was performed to assess the extent of mechanical reinforcement with the incorporation of chain extender into polymers. Typical stress–strain curves of PLA/PBAT-MDI blend are shown in Fig. 3, it shows the tensile strength and elongation at break of pure PLA, pure PBAT, and the PLA/PBAT-MDI blends in the presence of various MDI. PLA is very rigid and brittle with tensile strength near 46.4 MPa and elongation at break only 4.7%. The results showed that the brittle properties of PLA can be modified by the addition of PBAT. Compared with other mechanical properties of PLA/PBAT-MDI blends, the elongation at break is more sensitive to the compatibilization effect in immiscible binary blends. It can be observed the evolution of the stress–strain curves, the tensile strength and elongation at break increases from 17.0 to 48.8 MPa and from 62 to 663% with increasing the MDI content, respectively. With the increase of MDI, enhanced interfacial adhesion and higher molecular weight of PLA and PBAT would be obtained, thus resulting in gradually higher tensile strength and elongation at break.PLA is very rigid at room temperature and shows low impact strength, while its modulus and tensile strength are comparatively high.41 Fig. 4 shows the notched Izod impact strength of the PLA/PBAT-MDI blends. As included in the figure, poor compatibility between PLA/PBAT phases, the poor interfacial adhesion due to the thermodynamic immiscibility of the two components resulted in a co-continuous phase morphology, thus reducing the impact strength. There was an increase in resistance to impact when MDI added to PLA/PBAT (50/50) phase, the impact strength increased from 7 to 70.0 kJ m−2. As such, even though the two polymers are immiscible, the extent of some chains from both polymers intermingling at the interface would be maximal for the PLA/PBAT-MDI blends. From the Scheme 1, these intermingled chains at the interface acted as the bridge between the PLA and PBAT phases.42 In the compatibilized blends, greater applied energy is consumed for the above-mentioned processes, volume dilation, void initiation and propagation, hence more toughening is obtained compared to that of the neat blend.43 This observation is an indication of the role of improved interfacial adhesion in the enhancement of both impact and tensile toughness. The main reason is the addition of MDI, the branch structure formed, which restricted the mobility of the polymer chains to dissipate energy under a tensile load.
3.4 Miscibility and SEM micrographs analysis
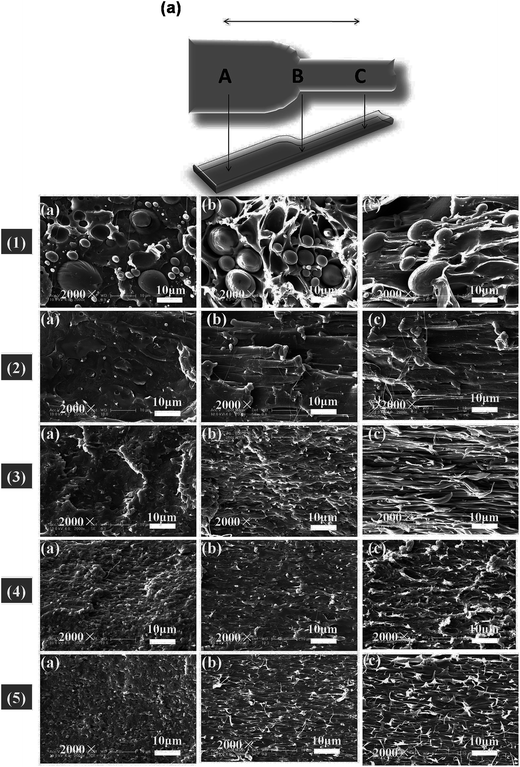
The morphology and glass transition temperatures of the blends provide information on miscibility of PLA and PBAT. To further investigate the toughening mechanism of PLA/PBAT-MDI blends, the morphology of different necking regions of the tensile specimen was cryo-fractured longitudinally to verify the interfacial adhesion effect on the micromechanical deformation processes.44 The cryo-fractured surface morphology of the stretched PLA/PBAT-MDI blends was analyzed by using SEM in Fig. 5. It could be seen that the dispersed PBAT were spherical. The total surface area exposed by the droplets per volumetric space of the PLA/PBAT blend is shown in the Fig. 5(1). The initial droplets size, the polymer elasticity, the dispersed phase percentage and the draw ratio are the main factors affecting the morphology formed during drawing. Dil et al. used the AFM and SEM to observe the surface of PLA/PBAT blend, they also found the dispersed phase PBAT droplets were in a flat plane surface in the image.27 When the dispersed phase concentration gets to 1![[thin space (1/6-em)]](https://www.rsc.org/images/entities/char_2009.gif) :
:![[thin space (1/6-em)]](https://www.rsc.org/images/entities/char_2009.gif) 1, complex structures, such as platelet, ribbon- or sheet-like, stratified and co-continuous structures, are formed.45 As seen in Fig. 5[1(a–c)], PBAT with a size of approximately 10 μm shows almost no wetting with the PLA phase indicating very low compatibility. For the neat PLA/PBAT blend, there are smoothly debonded surfaces, indicating complete phase separation, hence, brittle fracture. The PBAT phase size of the blends by reactive blending was much less than that by physical blending. The intermolecular reactions between PLA and PBAT resulted in forming a microstructure of PLA-crosslink-PBAT copolymers, which improved their compatibility, and thus decreasing the size of PBAT phase. The phase separation in the blends is further corroborated by DMA results. The curves of tan
1, complex structures, such as platelet, ribbon- or sheet-like, stratified and co-continuous structures, are formed.45 As seen in Fig. 5[1(a–c)], PBAT with a size of approximately 10 μm shows almost no wetting with the PLA phase indicating very low compatibility. For the neat PLA/PBAT blend, there are smoothly debonded surfaces, indicating complete phase separation, hence, brittle fracture. The PBAT phase size of the blends by reactive blending was much less than that by physical blending. The intermolecular reactions between PLA and PBAT resulted in forming a microstructure of PLA-crosslink-PBAT copolymers, which improved their compatibility, and thus decreasing the size of PBAT phase. The phase separation in the blends is further corroborated by DMA results. The curves of tan![[thin space (1/6-em)]](https://www.rsc.org/images/entities/char_2009.gif) δ plot show that neat PLA is featured by a single peak at 63.7 °C related to the glass transition, where as that of neat PBAT shows to a broad peak, at −25 °C, corresponding to the glass transitions in the aliphatic-rich amorphous phase in Fig. 6(a). The presence of these two peaks confirms the phase separation in the blends. However, after adding MDI, the PLA/PBAT-MDI blends show different behaviors and the different deformation stages during stretching are presented in Fig. 5[1(b)–5(b)]. The interfacial of co-polymer formed during the reactive compatibilization with the MDI contributed to the change in the shape of the dispersed phase from smooth spheres to a more fibrillar morphology. Dynamic mechanical analysis measurements also indicate enhancement of compatibility of the PLA/PBAT-MDI blends. Tan
δ plot show that neat PLA is featured by a single peak at 63.7 °C related to the glass transition, where as that of neat PBAT shows to a broad peak, at −25 °C, corresponding to the glass transitions in the aliphatic-rich amorphous phase in Fig. 6(a). The presence of these two peaks confirms the phase separation in the blends. However, after adding MDI, the PLA/PBAT-MDI blends show different behaviors and the different deformation stages during stretching are presented in Fig. 5[1(b)–5(b)]. The interfacial of co-polymer formed during the reactive compatibilization with the MDI contributed to the change in the shape of the dispersed phase from smooth spheres to a more fibrillar morphology. Dynamic mechanical analysis measurements also indicate enhancement of compatibility of the PLA/PBAT-MDI blends. Tan![[thin space (1/6-em)]](https://www.rsc.org/images/entities/char_2009.gif) δ peak increases from about −25 °C for pure PBAT to above −21.3 °C, while the Tg of PLA was decreased from 64.3 °C to 63.0 °C after adding MDI. There might be two reasons for the elevation of the Tg value. One is that a number of hydroxyl and carboxyl end groups of the PLA that participate in the chain elongation reaction at the start of reaction, chain extension by adding MDI increased the molecular weight and reduced the number of end groups. In addition, the introduction of a rigid aromatic structure into the polymer chain hinders the chain movement. As discussed previously in Scheme 1, chain extension reactions led to the formation of PLA-MDI-PBAT polymers. The varied morphology, coupled with chemical interaction between the functional groups of the two polyesters, may affect mobility of the phases, and result in a shift of glass transition temperature with respect to the expected values.46
δ peak increases from about −25 °C for pure PBAT to above −21.3 °C, while the Tg of PLA was decreased from 64.3 °C to 63.0 °C after adding MDI. There might be two reasons for the elevation of the Tg value. One is that a number of hydroxyl and carboxyl end groups of the PLA that participate in the chain elongation reaction at the start of reaction, chain extension by adding MDI increased the molecular weight and reduced the number of end groups. In addition, the introduction of a rigid aromatic structure into the polymer chain hinders the chain movement. As discussed previously in Scheme 1, chain extension reactions led to the formation of PLA-MDI-PBAT polymers. The varied morphology, coupled with chemical interaction between the functional groups of the two polyesters, may affect mobility of the phases, and result in a shift of glass transition temperature with respect to the expected values.46
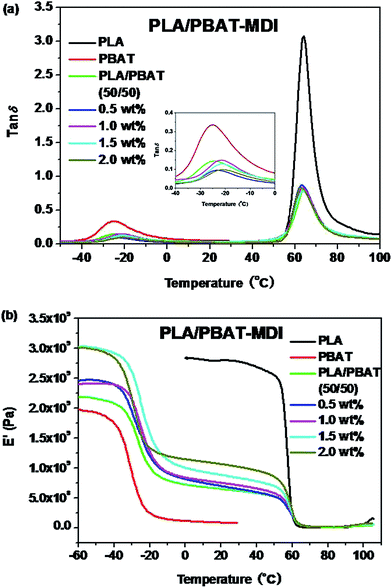 | ||
Fig. 6 DMA traces of the neat polymers and the polymer blends: (a) temperature dependence of tan![[thin space (1/6-em)]](https://www.rsc.org/images/entities/char_2009.gif) δ; (b) temperature dependence of the storage modulus (E′). δ; (b) temperature dependence of the storage modulus (E′). | ||
A concomitant drop in storage modules (E′) curves occurs at similar temperatures in Fig. 6(b). The E′ shows two apparent peaks for the blends, indicating the presence of two different continuous phases in the blends at a microscopic level. Evidently, this peak is an indicative of the glass transition temperature, containing both PLA and PBAT in proportions that critically depend on overall blend compositions and the conditions during the preparation of the blends. The pure PLA displays a high E′ at about 3.0 GPa, which remains in the same order up to 60 °C, while neat PBAT shows a smoother drop in E′ at about −30 °C. For the PLA/PBAT-MDI blends, E′ drops at about −20 to 60 °C, when the fraction of MDI becomes higher, a higher drop appears at temperatures that is due to form a microstructure of PLA-crosslink-PBAT copolymers.
3.5 Thermal analysis
The DSC thermograms of the blends are presented in Fig. 7, and values of the cold-crystallization temperature (Tcc), melting temperature (Tm), melting enthalpy (ΔHf), cold crystallization enthalpy (ΔHcc), glass transition temperature (Tg) and the degree of crystallinity (Xc) of the unoriented and oriented blends related to the first heating run are summarized in Tables 1 and 2.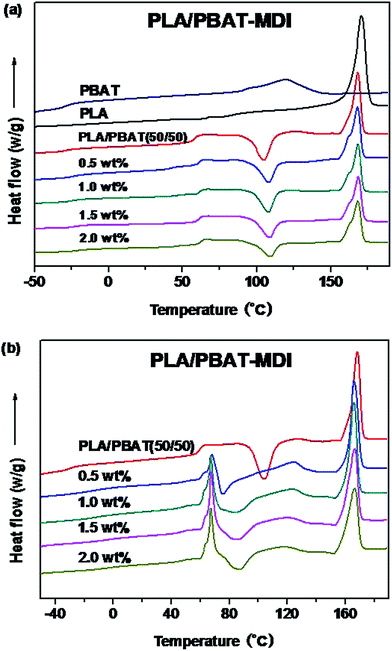 | ||
| Fig. 7 DSC thermograms of unoriented (a) and oriented (b) PLA/PBAT-MDI blends in the first heating run. | ||
| Samples | DMA | DSC | |||||||
|---|---|---|---|---|---|---|---|---|---|
| TgPBAT (°C) | TgPLA (°C) | TmPLA (°C) | ΔHf (J g−1) | Xc (%) | TmPBAT (°C) | TgPLA (°C) | TgPBAT (°C) | Tcc (°C) | |
| Unoriented | |||||||||
| PLA | — | 63.7 | 170.9 | 37.6 | 40.4 | — | — | — | — |
| PBAT | −25.0 | — | — | 11.5 | 10.1 | 124.5 | — | −31.0 | — |
| PLA/PBAT (50/50) | −24.5 | 64.3 | 168.3 | 22.3 | 47.9 | — | 58.2 | −28.8 | 104.6 |
| 0.5 wt% | −23.5 | 63.6 | 168.6 | 20.0 | 43.0 | — | 62.3 | −27.0 | 108.0 |
| 1.0 wt% | −21.6 | 63.6 | 168.5 | 19.9 | 42.8 | — | 62.5 | −26.5 | 108.4 |
| 1.5 wt% | −21.1 | 63.6 | 168.2 | 19.1 | 41.0 | — | 62.4 | −25.0 | 108.7 |
| 2.0 wt% | −20.5 | 63.6 | 167.8 | 17.5 | 37.6 | — | 62.2 | −24.1 | 108.8 |
| Sample | DSC | ||||||||
|---|---|---|---|---|---|---|---|---|---|
| TmPLA (°C) | TgPLA (°C) | Tcc (°C) | ΔHf,PLA (J g−1) | Xc,PLA (%) | TmPBAT (°C) | TgPBAT (°C) | ΔHf, PBAT (J g−1) | Xc,PBAT (%) | |
| Oriented | |||||||||
| PLA/PBAT (50/50) | 168.4 | 59.3 | 104.6 | 21.8 | 46.8 | 126.4 | −29.4 | 7.9 | 13.8 |
| 0.5 wt% | 166.2 | 68.0 | 74.8 | 21.8 | 46.8 | 124.7 | −15.7 | 6.2 | 10.8 |
| 1.0 wt% | 166.1 | 67.2 | 84.1 | 22.7 | 48.8 | 123.4 | −10.2 | 5.0 | 8.7 |
| 1.5 wt% | 166.6 | 67.2 | 86.0 | 21.8 | 46.8 | 120.8 | −3.5 | 4.7 | 8.2 |
| 2.0 wt% | 166.7 | 67.2 | 87.2 | 20.1 | 43.2 | 117.5 | −3.0 | 3.9 | 6.8 |
On the one hand, pure PLA shows a Tg of 63.7 °C and a strong endothermic peak at 170.9 °C. On the other hand, pure PBAT is a soft elastomeric material with a Tg of only −31.0 °C and followed by a small single endothermic peak of 124.5 °C. Compatibility in polymer blends can be judged by observing the shift in the Tg of the phases in comparison to their original values.35 Since the PLA/PBAT is an immiscible system, each component should present its own bulk behaviors in the blend, including thermal properties.47 As the Fig. 7(a) shown, for the PLA/PBAT (50/50) blend, Tg of PLA at 58.2 °C had a slight reduction due to incorporate the PBAT, as reported in the literature previously.48 For the PLA/PBAT-MDI (2.0%) blend, the Tg values of PBAT are significantly higher than that of the pure PBAT, which can be increased about 6.0 °C. The value of Tg between those of PLA and PBAT and increased with the increase of MDI. The results indicated that the PLA were well compatible with PBAT segments in the amorphous phase and compatibility improved in the formed blends. This result is accordant with DMA analysis. It can be seen from Fig. 7(a) that the PLA/PBAT-MDI blends show a small platform on the melting peak. This had been widely investigated and believed to be attributed to the melting and recrystallization mechanism.43,49,50 As the chain extension interfered in the crystallization process, many imperfect crystallites could be formed, and a large number of terminal groups and branched points generated imperfect crystallization.51 In comparison with those of the neat PLA, the melting peak shape and amount of the blends exhibit almost no change. In Fig. 7(a), for the PLA/PBAT-MDI blends, there is an overlap between the PBAT melting region and the PLA cold crystallization region in the first heating run. The Tcc moved to a higher temperature than that of the PLA/PBAT blend, it increased from 105.4 °C to 108.0 °C in the PLA/PBAT-MDI blend, demonstrating that chain extension reduced the crystallization of PLA.
Fig. 7(b) shows the thermal parameters of oriented blends in the first heating run, it can be seen that a sharp endotherm of blends is present for the oriented PLA/PBAT-MDI blends. It is worth noticing that this endotherm turns out to be as much important as the melting endotherm at strains. The peak of endotherm is occurred, the main reason is that a hint of cold crystallization promoted by the strain-induced orientation of the amorphous chains of PLA.52 Fig. 7(b) also shows that cold crystallization of PLA and melting peak of PBAT are observed concurrently for oriented polymers, the values are different from the unoriented polymers. The cold crystallization exotherm appears in the range 70–90 °C, the evolution of the crystallization enthalpy listed in Table 2. Oriented PLA/PBAT-MDI blend component exhibits a melting temperature of PBAT decreased from 124.7 to 117.5 °C. The melting peak of PLA in PLA/PBAT-MDI (166.7 °C) is also observed much smaller than that of PLA/PBAT blend (168.4 °C), and the crystallinity of the PLA decreases to 43.2% in Table 1. The decrease in melting temperature indicates that the lamellar crystallization structure is destroyed gradually during deformation.
3.6 In situ WAXD/SAXS measurements
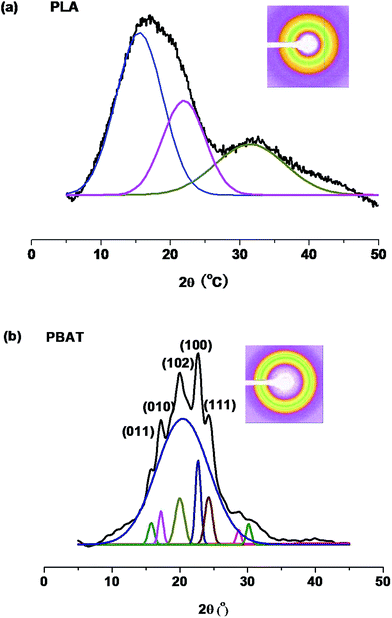
The difference in deformational response is accompanied by a difference in the development of crystalline structure. Since the properties of semicrystalline polymers such as PLA and PBAT depend on their crystalline structure, in this study, the effect of stretching on orientation of the crystallites was investigated using wide-angle X-ray diffraction (WAXD).It is well known that the mechanical properties and phase behavior of crystalline biodegradable polymers depend on their crystalline structure, thus the characterization of their solid-state morphology is very important.53,54 As the Fig. 8 shown, PLA exhibits an amorphous (Fig. 8(a)) and PBAT exhibits a small crystalline (Fig. 8(b)), whereas no diffraction peak of PLA is observed diffraction for all PLA/PBAT-MDI blends compositions. Hence just the PBAT fraction is considered as being the crystalline phase of the blends. The X-ray diffraction study revealed that PBAT is a crystalline material yielding the same diffraction maxima as PBT.55 Similar diffraction patterns suggested that the unit cell dimensions of PBAT should be similar to that of PBT. Thus it is plausible to speculate that the crystal structure of PBAT was formed by BT unit.56
For acquiring the crystallinity and orientation of deformed blends, the one-dimensional diffraction intensity along 2θ has been obtained by integration over the azimuthal range (0–360°) from the two-dimensional diffraction, as shown in Fig. 9. The variation of ratio PLA/PBAT-MDI in this experiment is shown in Fig. 9(a). For the sample with 50 wt% of PBAT, the reflections of PBAT crystals at 2θ = 16.2, 17.3, 20.4, 23.2 and 24.8° are still observed, indicating that the PBAT crystalline phase should be well separated in the blend. It is obvious that the crystallite dimensions of the samples become smaller with increasing MDI content. The calculated values of ACS are listed in Table 3. The smaller crystallite size seems to suggest that fewer nuclei are present in the blends during crystallization. This indicated that the presence of MDI had strong influence on the crystallization of blends. From the Fig. 9(b), the stretched blends in uniaxially exhibits a very high orientation in crystalline domains. The diffraction peaks of 010 (17.3) and 110 (20.4) were shifted to a higher 2θ values (17.8° and 21.2°) after oriented. One sharp diffraction peaks at around 23.8, which are characteristic of the defective α-form crystal in PLA. The peak at 2θ = 29.9° corresponds to β-forms crystals of PBAT. Song et al. also reported that PBAT crystallized in two crystalline modifications, α and β forms.57 These changes in the diffraction pattern explain that the crystalline transform from the α form to the β form after stretching. Subsequently, with stretching, the β form crystals that have small sizes may arise through the extended-chain crystallization and/or the α, β form crystal transition of the imperfect an ordering.
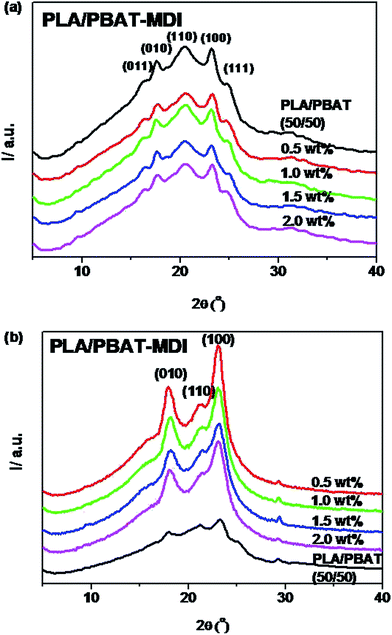 | ||
| Fig. 9 The wide-angle X-ray diffraction pattern of PLA/PBAT-MDI blends: (a) unoriented, (b) oriented. | ||
| Sample | ACS (Å) | ||||
|---|---|---|---|---|---|
| (011) | (010) | (110) | (100) | (111) | |
| (a) Unoriented | |||||
| PLA/PBAT (50/50) | 91.4 | 88.5 | 57.6 | 98.7 | 48.2 |
| 0.5 wt% | 89.0 | 85.5 | 47.1 | 88.3 | 59.6 |
| 1.0 wt% | 87.3 | 83.8 | 44.3 | 75.2 | 64.7 |
| 1.5 wt% | 87.1 | 83.2 | 37.9 | 66.7 | 66.5 |
| 2.0 wt% | 74.7 | 66.5 | 36.0 | 55.5 | 68.8 |
| (b) Oriented | |||||
| PLA/PBAT (50/50) | 65.6 | 51.3 | 59.0 | 66.4 | 73.0 |
| 0.5 wt% | 75.5 | 47.9 | 66.2 | ||
| 1.0 wt% | 68.4 | 52.6 | 57.4 | ||
| 1.5 wt% | 66.4 | 53.5 | 54.9 | ||
| 2.0 wt% | 65.7 | 55.1 | 52.8 | ||
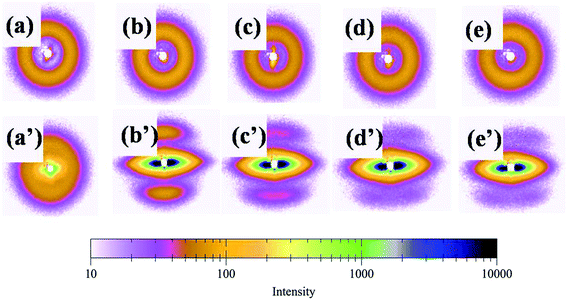
Fig. 10 shows the diffraction pattern scanned along the equator of each profiles in Fig. 9. The initial pattern of the unoriented sample in Fig. 10[(a)–(e)] shows a diffuse isotropic halo. It can be seen that the diffuse halo of the WAXD pattern is isotropic, indicating that the undrawn PLA/PBAT-MDI blend is nearly semicrystalline and there is no oriented structure in it. As drawing proceeds there is a gradual intensification of the halo on the equator leading to diffuse equatorial spots in Fig. 10[(a′)–(e′)], characteristic of a highly oriented crystalline structure. Note that the diffraction halo of the amorphous phase gradually developed into a pair of broad diffraction arcs on the meridional position at a MDI of around 0.5 wt%. In general, uniaxial PLA/PBAT-MDI blends revealed distinct crystalline arcs in WAXS flat blends photographs. The equatorial diffraction profiles were obtained by scanning respective patterns along the equatorial direction, perpendicular to the drawing direction. When the MDI was up to 2.0 wt%, the diffraction of the spots was more intense and a pair of short and narrow arcs appeared outside the spots, indicating that the degree of crystallinity increased. As the MDI content increased, the β peaks arose on the meridian, developing anisotropy. Thus, in order to understand the deformation behavior of this or other crystalline polymer systems, which have more than one crystalline phase, it is important to know the stress–strain relationship in the region of crystalline transition.
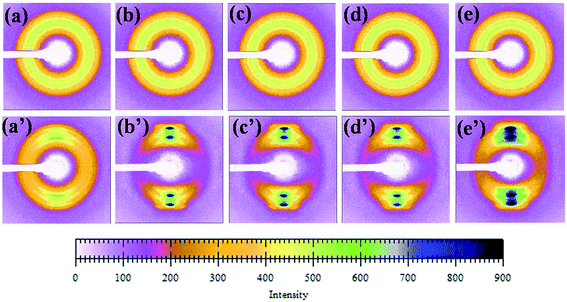 | ||
| Fig. 10 A series of WAXD diffraction patterns were taken sequentially according to the scheme of Fig. 8 (unoriented PLA/PBAT-MDI samples: (a) PLA/PBAT (50/50), (b) 0.5 wt%, (c) 1.0 wt%, (d) 1.5 wt% and (e) 2.0 wt% MDI; oriented PLA/PBAT-MDI samples: (a′) PLA/PBAT (50/50) (b′) 0.5 wt%, (c′) 1.0 wt%, (d′) 1.5 wt% and (e′) 2.0 wt% MDI). | ||
In order to interpret the effect of crystallization on the toughness of the blend, small-angle X-ray scattering (SAXS) was used to investigate the lamellar structures. Because of survival of these crystalline lamellae after deformation, the scattering intensity distribution of the PLA/PBAT-MDI blend obtained by equatorial scan along the scattering streak was decomposed into two contributions based on Lorentzian functions, as given in Fig. 11. In an effort to elucidate the evolution of the lamellar after deformation, scattering patterns of PLA/PBAT-MDI blends measured before and after stretching direction are plotted in Fig. 12. The obtained qmax, long period (dac), lamellar thickness (dc) and amorphous thickness (da) values are summarized in Table 4. The qmax represents the position of the intensity maximum in a SAXS pattern, Xc,2 represents the crystallinity of the PBAT samples, which was derived from DSC measurement.
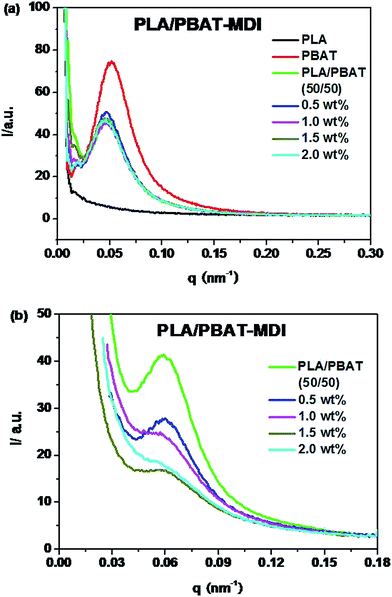 | ||
| Fig. 11 One-dimensional scattering intensity distribution of PLA/PBAT-MDI blends: (a) unoriented (b) oriented. | ||
| Sample | qmax (nm−1) | Xc (%) | dac (nm) | dc (nm) | da (nm) |
|---|---|---|---|---|---|
| PLA/PBAT (50/50) | 0.060 | 13.8 | 104.6 | 14.4 | 100.2 |
| 0.5 wt% | 0.059 | 10.8 | 106.4 | 11.5 | 94.9 |
| 1.0 wt% | 0.057 | 8.7 | 110.1 | 9.6 | 100.5 |
| 1.5 wt% | 0.057 | 8.2 | 110.1 | 9.0 | 101.1 |
| 2.0 wt% | 0.055 | 6.8 | 114.2 | 7.7 | 106.5 |
Because of the electron density difference between crystalline and amorphous phase, the SAXS intensity of PLA is very weak. As the Fig. 11(a) shown, the intensity at Imax and qmax decreases with the various MDI present in unstretched PLA/PBAT-MDI blends samples compared with pure PBAT. The decrease in SAXS intensity indicates that the original lamellar structure is destroyed gradually during deformation. Compared to the foregoing discussion one might also consider the possibility of kinking deformation of lamellae as proposed by Bartczak and Lezak.58 Fig. 11(b) shows oriented samples scattering character. It is obvious that all of the values of dac and da increase and the dc values decrease with increasing MDI. However, the increase in da is large. For example, the increase in da is around 6.0 nm after blending 2 wt% MDI as compared to that of neat PBAT. The data indicate that the increase of long spacing is mostly due to the increase of amorphous layer thickness. Such significant increase in da suggested that chain extension may destroy the crystalline of blends and reside in the interlamellar region of PLA.
In semi-crystalline polymers, a two-phase morphology consisting of lamella shaped crystals is widely researched and quantitative details of such morphology can be estimated by SAXS, with often remarkable accuracy.59–61 The SAXS patterns of unoriented and oriented PLA/PBAT-MDI blends exhibit faint polar scattering intensifying and the original isotropic scattering distributed to highly anisotropic streak-like scattering patterns can be observed in Fig. 12. Initially, the original scattering intensity in the meridian direction becomes weaker, which is caused by a destruction of crystalline lamellae with the drawing direction.
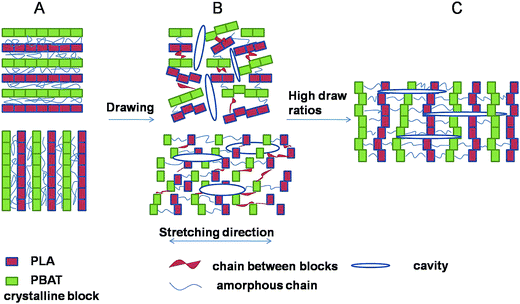
Cavitation behavior in blends upon stretching below glass transition temperature was investigated by SAXS technique. The crystallinity lamellae decreased with the increase of amorphous phase, resulting in high stretching stress at the same strain (Fig. 2) and consequently producing more voids and cavities in the amorphous phase between the crystals during stretching. Strong stress-whitening was observed indicating an extensive occurrence of cavitation in the material during tensile deformation below Tg. A schematic representation of the evolution of cavitation in PLA/PBAT-MDI blends during uniaxial deformation is shown in Fig. 13. The lamellar thickness is small, inter-lamellar slips take place resulting in an increase in orientational order parameter at the early stage of deformation. The block boundaries within crystalline lamellae with perpendicular to the tensile direction opened in width and formed the plate-like cavities passing through amorphous phase connecting several lamellae. After yield point, the plate-like cavities perpendicular to the tensile direction became bigger. Here the polymer chains were perpendicular to the stretching direction. During strain-hardening stage, the part of the polymer chains oriented to the stretching direction resulting in a reorientation of the cavities with their normal perpendicular to the stretching direction.62
Information about changes in the lamellar structure during tensile deformation can be extracted directly from the in WAXD patterns. The crystalline dimension become smaller if the crystallization is reduced or noncrystalline parts are increased due to chain extension.63 With the addition of MDI, the SAXS patterns transformed from a scattering diagram, parallel to the flow direction at small deformations, and eventually to a highly anisotropic scattering intensity distribution with scattering peaks aligned in the strength direction.64 The smaller crystallites of blends are likely to be formed during the course of chain extension after crystallization, which can be verified by the fact that the size differences of blends from the Table 4.65
4. Conclusions
In this work, the impact strength of biodegradable PLA and PBAT blends was significantly enhanced successfully by using MDI as chain extender through reactive melt processing. The effect of mechanical properties and crystallization on the microstructure of a toughened PLA/PBAT blends was studied. The effect of chain extension on the toughness of the blend was associated with the mechanical properties, morphology, thermal and crystal behavior which mainly affected the ability of the matrix to deform. Upon increasing the content of the MDI, the blends showed increased yield tensile strength, modulus, and elongation at break. The improvement in resistance to impact was attributed to yielding deformation between PLA and PBAT phases. The miscibility of PLA/PBAT blends was studied by DMA, the results showed a partial miscibility between PLA and PBAT phase. DSC analysis suggested that PLA and PBAT segments were well compatible in amorphous phase, and the amorphous phase was predominantly caused by chain extension of MDI, which was also confirmed by WAXD and SAXS study. The effect of chain extension on the toughness of the blend was associated with the degree of crystallinity, morphology, and lamellar thickness. It is evident that the lamellar crystallization structure to fibrillar transition of oriented samples just is strongly dependent on the content of MDI, due to an enhanced mobility of the amorphous phase, therefore, a reduced crystallite dimension of the entangled amorphous network. Consequently, the toughened PLA/PBAT-MDI blend can be useful for the choice of appropriate materials for specific applications.Conflicts of interest
There are no conflicts to declare.Acknowledgements
This work was supported by the fund of Science & Technology Bureau of Jilin Province of China (No. 20160307001GX), and National Key Research and Development Program of China (No. 2016YFC0501402-5), Science & Technology Bureau of Changchun City of China (No. 16SS03), Chinese Science Academy (Changchun Branch) (No. 2017SYHZ0016), and Chinese Science Academy (Changchun Branch) (No. 2017SYHZ0018).References
- M. Gao, Z. J. Ren, S. K. Yan, J. R. Sun and X. S. Chen, J. Phys. Chem. B, 2012, 116, 9832–9837 CrossRef CAS PubMed.
- X. F. Ma, J. G. Yu and N. Wang, J. Polym. Sci., Part B: Polym. Phys., 2006, 44, 94–101 CrossRef CAS.
- L. D. Feng, X. C. Bian, G. Li, Z. M. Chen and X. S. Chen, Polym. Degrad. Stab., 2016, 125, 148–155 CrossRef CAS.
- G. Flodberg, I. Helland, L. Thomsson and S. Bodil Fredriksen, Eur. Polym. J., 2015, 63, 217–226 CrossRef CAS.
- Q. R. Sun, T. Mekonnen, M. Misra and A. K. Mohanty, J. Polym. Environ., 2015, 24, 23–36 CrossRef.
- L. Y. Zhou, G. Y. Zhao and W. Jiang, Ind. Eng. Chem. Res., 2016, 55, 5565–5573 CrossRef CAS.
- M. Kumar, S. Mohanty, S. K. Nayak and M. R. Parvaiz, Bioresour. Technol., 2010, 101, 8406–8415 CrossRef CAS PubMed.
- W. Phetwarotai, V. Tanrattanakul and N. Phusunti, Plast., Rubber Compos., 2016, 45, 333–345 CrossRef CAS.
- S. Ravati, C. Beaulieu, A. M. Zolali and B. D. Favis, AIChE J., 2014, 60, 3005–3012 CrossRef CAS.
- N. Shi and Q. Dou, J. Therm. Anal. Calorim., 2014, 119, 635–642 CrossRef.
- D. D. Ju, L. J. Han, F. Li, S. Chen and L. S. Dong, Polym. Compos., 2013, 34, 1745–1752 CrossRef CAS.
- C. Zhang, T. Zhai, L. S. Turng and Y. Dan, Ind. Eng. Chem. Res., 2015, 54, 9505–9511 CrossRef CAS.
- F. Walha, K. Lamnawar, A. Maazouz and M. Jaziri, Polymers, 2016, 8 DOI:10.3390/polym8030061.
- S. Lee and J. W. Lee, Korea Aust. Rheol. J., 2005, 17, 71–77 Search PubMed.
- G. X. Chen, H. S. Kim, E. S. Kim and J. S. Yoon, Polymer, 2005, 46, 11829–11836 CrossRef CAS.
- A. Bhatia, R. K. Gupta, S. N. Bhattacharya and H. J. Choi, Korea Aust. Rheol. J., 2007, 19, 125–131 Search PubMed.
- L. J. Han, C. Y. Han and L. S. Dong, Polym. Compos., 2013, 34, 122–130 CrossRef CAS.
- L. J. Han, C. Y. Han and L. S. Dong, Polym. Int., 2013, 62, 295–303 CrossRef CAS.
- Y. J. Chen, L. J. Han and Z. L. Li, RSC Adv., 2017, 7, 712–719 RSC.
- Z. Y. Jiang, Y. T. Wang, L. L. Fu, B. Whiteside, J. Wyborn, K. Norris, Z. H. Wu, P. Coates and Y. F. Men, Macromolecules, 2013, 46, 6981–6990 CrossRef CAS.
- M. Psarskia, M. Pracellab and A. Galeski, Polymer, 2000, 41, 4923–4932 CrossRef.
- U. Witt, R. J. Muller and W. D. Deckwer, Macromol. Chem. Phys., 1996, 197, 1525–1535 CrossRef CAS.
- S. Girdthep, N. Komrapit, R. Molloy, S. Lumyong, W. Punyodom and P. Worajittiphon, Compos. Sci. Technol., 2015, 119, 115–123 CrossRef CAS.
- G. Schmack, D. Jehnichen, R. Vogel, B. Tandler, R. Beyreuther, S. Jacobsen and H. G. Fritz, J. Biotechnol., 2001, 86, 151–160 CrossRef CAS PubMed.
- M. A. Huneault and H. Li, Polymer, 2007, 48, 270–280 CrossRef CAS.
- H. Y. Zhou, H. D. Huang and X. Ji, ACS Appl. Mater. Interfaces, 2016, 8, 8096–8109 Search PubMed.
- E. J. Dil, P. J. Carreau and B. D. Favis, Polymer, 2015, 68, 202–212 CrossRef CAS.
- L. C. Arruda, M. Magaton, R. E. S. Bretas and M. M. Ueki, Polym. Test., 2015, 43, 27–37 CrossRef CAS.
- R. Al-Itry, K. Lamnawar and A. Maazouz, Polym. Degrad. Stab., 2012, 97, 1898–1914 CrossRef CAS.
- R. Al-Itry, K. Lamnawar and A. Maazouz, Eur. Polym. J., 2014, 58, 90–102 CrossRef CAS.
- R. Al-Itry, K. Lamnawara and A. Maazouz, Eur. Polym. J., 2015, 68, 288–301 CrossRef CAS.
- R. Al-Itry, K. Lamnawar and A. Maazouz, Rheol. Acta, 2014, 53, 501–517 CrossRef CAS.
- K. B. H. Badri, W. C. Sien, M. S. B. R. Shahrom, L. C. Hao, N. Y. Baderuliksan and N. R. A. Norzali, Solid State Sci. Technol., 2010, 18, 1–8 CAS.
- B. H. Li and M. C. Yang, Polym. Adv. Technol., 2006, 17, 439–443 CrossRef CAS.
- F. Zhao, H. X. Huang and S. D. Zhang, J. Appl. Polym. Sci., 2015, 132, 42511 Search PubMed.
- H. Wang, X. Sun and P. J. Seib, J. Appl. Polym. Sci., 2002, 84, 1257–1262 CrossRef CAS.
- W. Zhong, J. J. Ge, Z. Y. Gu, W. J. Li, Z. Y. Gu, W. J. Li, X. Chen, Y. Zang and Y. L. Yang, J. Appl. Polym. Sci., 1999, 74, 2546–2551 CrossRef CAS.
- Z. Z. Su, Q. Y. Li, Y. J. Liu, G. H. Hu and C. F. Wu, Eur. Polym. J., 2009, 45, 2428–2433 CrossRef CAS.
- M. Kakudo and N. Kasai, X-Ray Diffraction by Polymer, Kodansha Press, Tokyo, 1972 Search PubMed.
- H. Tsuji, K. Ikarashi and N. Fukuda, Polym. Degrad. Stab., 2004, 84, 515–523 CrossRef CAS.
- V. Ojijo and S. S. Ray, Polymer, 2015, 80, 1–17 CrossRef CAS.
- V. Ojijo, S. S. Ray and R. Sadiku, ACS Appl. Mater. Interfaces, 2012, 4, 6690–6701 CAS.
- V. Ojijo, S. S. Ray and R. Sadiku, ACS Appl. Mater. Interfaces, 2013, 5, 4266–4276 CAS.
- X. M. Wang, Y. G. Zhuang and L. S. Dong, J. Appl. Polym. Sci., 2013, 127, 471–477 CrossRef CAS.
- A. K. Kalkar, H. W. Siesler, F. Pfeifer and S. A. Wadekar, Polymer, 2003, 44, 7251–7264 CrossRef CAS.
- V. Thirtha, R. Lehman and T. Nosker, Polymer, 2006, 47, 5392–5401 CrossRef CAS.
- D. F. Wu, L. J. Yuan, E. Laredo, M. Zhang and W. D. Zhou, Ind. Eng. Chem. Res., 2012, 51, 2290–2298 CrossRef CAS.
- L. Jiang, M. P. Wolcott and J. W. Zhang, Biomacromolecules, 2006, 7, 199–207 CrossRef CAS PubMed.
- M. Akrami, I. Ghasemi, H. Azizi, M. Karrabi and M. Seyedabadi, Carbohydr. Polym., 2016, 144, 254–262 CrossRef CAS PubMed.
- M. Evstatiev, S. Simeonova, K. Friedrich, X. Q. Pei and P. Formanek, J. Mater. Sci., 2013, 48, 6312–6330 CrossRef CAS.
- K. I. Ku Marsilla and C. J. R. Verbeek, Eur. Polym. J., 2015, 67, 213–223 CrossRef CAS.
- G. Stoclet, R. Seguela, J. M. Lefebvre and C. Rochas, Macromolecules, 2010, 43, 7228–7237 CrossRef CAS.
- M. D. Failla and L. Mandelkern, Macromolecules, 1993, 26, 7167–7175 CrossRef CAS.
- M. A. Kennedy, A. J. Peacock and L. Mandelkern, Macromolecules, 1994, 27, 5297–5310 CrossRef CAS.
- E. Cranston, J. Kawada, S. Raymond, F. G. Morin and R. H. Marchessault, Biomacromolecules, 2003, 4, 995–999 CrossRef CAS PubMed.
- X. Q. Shi, H. Ito and T. Kikutani, Polymer, 2005, 46, 11442–11450 CrossRef CAS.
- K. J. Song, J. Appl. Polym. Sci., 2000, 78, 412–423 CrossRef CAS.
- Z. Bartczak and E. Lezak, Polymer, 2005, 46, 6050–6063 CrossRef CAS.
- A. D. Jenkins, F. J. Baltá-Calleja and C. G. Vonk, X-ray scattering of synthetic polymers, Elsevier, Amsterdem, 1989 Search PubMed.
- O. Glatter and O. Kratky, Small angle X-ray scattering, Academic press, New York, 1982 Search PubMed.
- J. V. Dawkins, Developments in polymer characterization-1, Applied Science, London, 1978 Search PubMed.
- Y. T. Wang, Z. Y. Jiang, L. L. Fu, Y. Lu and Y. F. Men, PLoS One, 2014, 9, e97234 Search PubMed.
- A. Mahendrasingama, D. J. Blundella, M. Partona, A. K. Wright, J. Rasburn, T. Narayanan and W. Fuller, Polymer, 2005, 46, 6009–6015 CrossRef.
- Z. Y. Jiang, L. L. Fu, Y. Y. Sun, X. H. Li and Y. F. Men, Macromolecules, 2011, 44, 7062–7065 CrossRef CAS.
- H. M. Yan, J. R. Xu, K. C. Mai and H. M. Zeng, Polymer, 1999, 40, 4865–4875 CrossRef CAS.
| This journal is © The Royal Society of Chemistry 2018 |

