 Open Access Article
Creative Commons Attribution 3.0 Unported Licence
OH− absorption and holographic storage properties of Sc(0, 1, 2, 3):Ru:Fe:LiNbO3 crystals
Li Dai *a,
Luping Wangb,
Chunrui Liua,
Xianbo Hana,
Zhehua Yana and
Yuheng Xubc
aCollege of Science, Harbin University of Science and Technology, Harbin 150080, China. E-mail: daili198108@126.com; Tel: +86 451 86390731
bSchool of Materials Science and Engineering, Harbin University of Science and Technology, Harbin 150040, China
cDepartment of the Applied Chemistry, Harbin Institute of Technology, Harbin 150001, China
First published on 30th January 2018
Abstract
A series of Sc:Ru:Fe:LiNbO3 crystals with various levels of Sc2O3(0, 1, 2, and 3 mol%) doping were grown from congruent melts in air by using the Czochralski technique. The defect structures and photorefractive properties of the Sc:Ru:Fe:LiNbO3 crystals were investigated by acquiring infrared spectra of the crystals and performing two-wavelength nonvolatile experiments, respectively. Our results showed the holographic storage properties of Ru:Fe:LiNbO3 crystals to be enhanced by doping them with a high concentration of Sc2O3, and indicated Sc:Ru:Fe:LiNbO3 crystals to constitute a promising medium for holographic storage.
1. Introduction
With excellent nonlinear optical, electro-optical, acoustic-optical, ferroelectric and photorefractive properties, LiNbO3(LN) crystals have become very promising materials.1,2 In the past few decades, due to its high storage capacity, fast parallel processing and content addressability, the LiNbO3 crystal has garnered great interest,3 and has been successfully applied in integrated electro-optical devices and holographic memory devices.4 However, the volatility of stored information is a major obstacle in the practical application of LiNbO3 crystals. In order to solve this problem, photorefractive ions such as those of Fe,5 Ce,6 Cu,7 Ru,8 Mn, Ti,9 Er10–14 are introduced into the crystal to enhance the photorefractive effect, and it was found that a nonvolatile readout can be realized in some doubly doped LiNbO3.15,16Based on this development, a two-centered recording model was proposed in the doubly doped Fe:Mn:LiNbO3 crystal by Buse et al. in 1998,17 and holographic recording and nondestructive readout were implemented in Fe:Mn:LiNbO3. The key point of the technique is that the doped ions can provide both relatively shallow and deep centers in the crystals. Many new doubly doped crystals, such as Cu:Ce:LiNbO3, Mn:Ce:LiNbO3 and Fe:Cu:LiNbO3 crystals, have since been reported to have such properties.18,19 The Ru:Fe:LiNbO3 crystal was recently found to be another excellent medium for holographic storage. Fe and Ru are both transition mental ions and are located at similar positions of the periodic table; and in the Ru:Fe:LiNbO3 crystal, Ru is used as a deep center and Fe as a shallow center.20 Generally speaking, the higher the concentration of the doping ion, the stronger the photorefractive effect; therefore, a lower response time, higher sensitivity, higher diffraction efficiency and other excellent parameters can be achieved by using a higher doping concentration. But it is not easy to grow large and high-quality Ru:Fe:LiNbO3 crystals, because of the low solubility of Fe and Ru in the LiNbO3 crystal. Comparatively speaking, doping ions resistant to optical damage is a more feasible method: it not only can eliminate the intrinsic defects caused by the Li composition deficiency but also can improve optical resistance ability of the crystal.
The choice of doping ions is critical for the characteristics and applications of LN crystals. In this work, the Sc3+ (ref. 21–24) ion was chosen as the doping ion. The ionic radius of Sc3+ is similar to that of Li+ but larger than that of Nb5+, and the Sc3+-doped LN has been used in integrated optics such as titanium-diffused optical LN waveguides doped with Sc3+. The LN crystal is susceptible to photorefractive damage under laser irradiation. To suppress photorefractive damage, the LN crystal must be doped with more than 4.6 mol% Mg,25 more than 6.2 mol% Zn,26 more than 3 mol% In,27 or more than 2 mol% Sc.28 We chose Sc3+ ion as the doping ion since it was effective at a concentration lower than were any of the other ions.
Based on the above considerations, a series of Sc:Ru:Fe:LiNbO3 crystals with various concentrations of Sc2O3 were grown by using the Czochralski method. The defect structures of Sc:Ru:Fe:LiNbO3 crystals were investigated by acquiring their infrared spectra, and the holographic storage properties of Sc:Ru:Fe:LiNbO3 were investigated by taking two-wavelength nonvolatile measurements.
2. Crystal growth
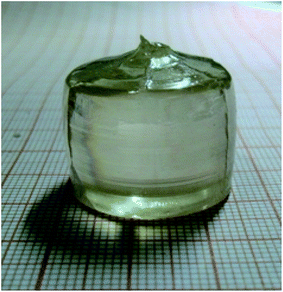
In our experiment, the Sc(0, 1, 2, and 3 mol%):Ru:Fe:LiNbO3 crystals with 0.3 mol% Fe2O3 and 0.2 mol% RuO2 were grown from congruent melts in air by using the Czochralski technique. The raw materials used in crystal growth were Nb2O5, LiCO3, Sc2O3, RuO2 and Fe2O3. The purity of raw material is critical for optical quality, so the purity levels of all raw materials were at least 99.99%. All raw materials including Nb2O5, LiCO3, Sc2O3, RuO2 and Fe2O3 were mixed for 24 hours in order to obtain uniform materials. Then the materials were placed into a platinum crucible heated up to 750 °C for 2 hours to remove CO2 and then heated up further to 1150 °C for 2 hours to form a polycrystalline material as a result of a solid-state reaction. The growth condition was selected as follows: the temperature gradient was 2.5 °C mm−1, the polling rate and rotation rate were controlled to be in the range 0.8 to 1.5 mm h−1 and 17–26 rpm, respectively. After growth, the crystals were cooled to room temperature at a rate of 65 °C h−1. In order to prevent spontaneous polarization of the crystals, all of the crystals needed to be polarized artificially in a medium frequency furnace for 8 h, in which the temperature was 1100 °C, the temperature gradient was almost equal to zero, and the current density was 5 mA cm−2. Several 8 mm × 10 mm × 2 mm (x × y × z) wafers were obtained by cutting from the middle of the Sc:Ru:Fe:LiNbO3 crystals along the y-axis. The samples with different Sc3+ ion concentrations were labeled as ScRuFe-0, 1, 2 and 3. A photograph of one of the ScRuFe-3 crystals is shown in Fig. 1.3. Measurements
3.1 Infrared absorption spectra of Sc:Ru:Fe:LiNbO3 crystals
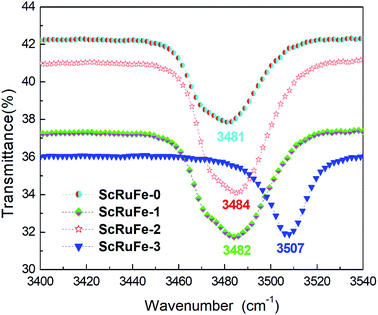
The water in the raw materials and growth atmosphere were expected to cause H+ ions to enter the crystal lattice and form O–H–O during the crystal growth. The frequency and energy of infrared light can only make molecules vibrate and their rotation levels change. Since the vibration of O–H is very sensitive to its environment, including surrounding ions, we expected the defects and structure of our crystals to be amenable to analysis using infrared spectroscopy.29The infrared absorption spectra of the crystals were each acquired in the wavenumber range 3400 cm−1 to 3540 cm−1 at room temperature. As shown in Fig. 2, the OH− absorption bands of samples ScRuFe-0, 1 and 2 were all located at about 3482 cm−1, while the OH− band of sample ScRuFe-3 was located at 3507 cm−1. The shape of an OH− absorption band is related to the crystal composition and ions surrounding the OH−. The OH− absorption band of LiNbO3 is also located at 3482 cm−1.30
The mechanism underlying the shift of the absorption peak can be described as follows. The [Li]/[Nb] ratio in congruent LiNbO3 crystals has been previously indicated to be about 0.946, and to have caused the generation of intrinsic defects. During the growth of such crystals, a lattice position missing the Li+ ion would form a Li vacancy VLi−, which would be filled by a Nb3− ion to form an anti site Nb NbLi4+. The concentration threshold of anti-photorefraction can be defined as that when the doped ions enter the normal Nb position. In our experiment, the concentrations of Fe3+ and Ru4+ ions were fixed, so we just took the Sc3+ ion into account; as indicated above, the concentration threshold of Sc3+ ions has been reported to be 2 mol%. The concentrations of Sc2O3 added into the growth melts of samples ScRuFe-0, 1, 2 and 3 were measured using ICP-AES spectrometry to be 0 mol%, 0.78 mol%, 1.44 mol% and 2.07 mol% respectively. For the Sc:Ru:Fe:LiNbO3 crystals with a dopant concentration below its threshold value, the doping Sc, Ru and Fe ions, according to the proposed mechanism, replaced NbLi4+ and VLi− to form the defects ScLi2+, RuLi3+ and FeLi2+, respectively. Due to the repulsion between these ions and H+, the H+ ions were still attracted by VLi−, which caused the OH− absorption bands of samples ScRuFe-0, 1, 2 to be quite similar. According to the proposed mechanism, for the concentration of Sc3+ ions exceeding the threshold, Sc3+ occupied Nb sites and formed the defect ScNb2−. ScNb2− attracts H+ ions more strongly than does VLi−, so the H+ ions gathered near ScNb2− according to our proposal. The shift of the absorption band of sample ScRuFe-3 to 3507 cm−1 was attributed to the above mechanism. Note also that the OH− absorption band of sample ScRuFe-3 was sharper than those of the others, and this observation was attributed to the formation of more ScNb2− defects resulting from the higher concentration of Sc3+ in this sample.
3.2 Two-wavelength nonvolatile measurements
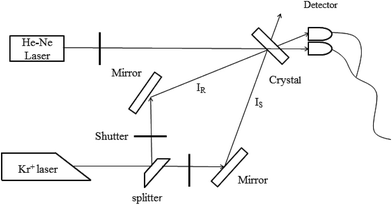
Two-wavelength nonvolatile measurements were taken to study the holographic storage properties of the Sc:Ru:Fe:LiNbO3 crystals. The experimental setup is shown in Fig. 3. A Kr+ laser with λ = 476 nm and an He–Ne laser with λ = 633 nm were used as the recording and readout beams, respectively. By using a continuously adjustable beam splitter, the recording beam was split into two beams, IS and IR, of equal 120 mW cm−2 intensity. The two beams were then polarized in the incidence plane, and then directed to the crystal at the corresponding Bragg angle of 16°. The two beams intersected symmetrically inside the crystal and made the grating vector along the c-axis. During the recording process, the two beams were first directed onto the crystal at the same time, and then the beam IS was blocked from time to time by a shutter, and the diffraction efficiency of another beam IR was detected for a short duration of 10 s in order to eliminate the impact of erasure. After the grating store was saturated, IS and IR were both blocked only by the He–Ne beam directed onto the sample, and the intensities of transmitted It and diffracted Id were determined. This process was the nonvolatile readout. By carrying out these experiments, the holographic storage properties of the samples were determined.Next we discuss the holographic storage properties of the Sc:Ru:Fe:LiNbO3 crystals.
The diffraction efficiency η was defined as, the diffraction efficiency η was defined as
| η = Id/It × 100% | (1) |
 | (2) |
The recording and erasure time constants were described by using eqn (2) and (3).
 | (3) |
In these equations, τw and τe are the recording and erasure time constants respectively. Also, ηsat is the saturation diffraction efficiency during recording, and it was fixed by the function
 | (4) |
Sensitivity (S) and its dynamic range (M/#) were calculated using eqn (5) and (6).31,32
 | (5) |
 | (6) |
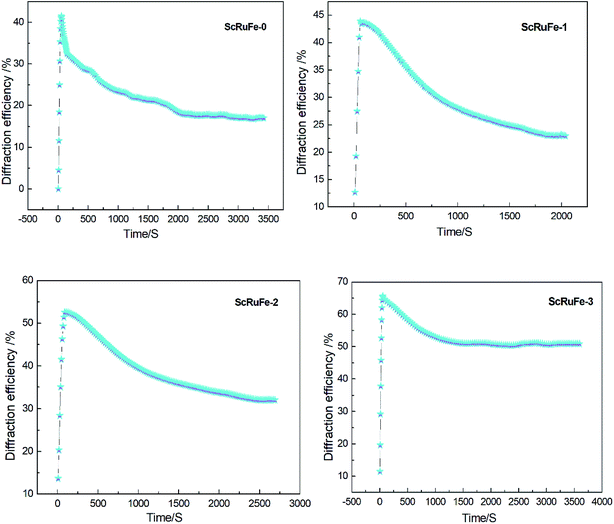
The dual-wavelength nonvolatile holographic recording-readout curves are shown in Fig. 4.
 | ||
| Fig. 4 Time dependence of diffraction efficiency during dual-wavelength nonvolatile holographic recording of the samples. | ||
The holographic storage parameters of the Sc:Ru:Fe:LiNbO3 crystals measured by performing the dual-wavelength experiment are listed in Table 1. The results showed that the holographic storage parameters improved as the Sc2O3 doping concentration was increased. Compared to the values of ScRuFe-0, τw of ScRuFe-3 decreased by a factor of 3.0, ηs increased by a factor of 1.6, S increased by a factor of 4, and M/# increased by a factor of 7.9. The ηs, S, and M/# values of sample ScRuFe-3 were in fact higher than the corresponding values of the other tested samples.
| Sample | τw (s) | τe (s) | ηs (%) | S (cm J−1) | M/# | Δns (× 10−5) | σph (× 10−12 cm Ω−1 W−1) |
|---|---|---|---|---|---|---|---|
| ScRuFe-0 | 389.2 | 937.2 | 41.2 | 0.04 | 1.55 | 4.17 | 0.64 |
| ScRuFe-1 | 275.1 | 1105.7 | 44.5 | 0.06 | 2.68 | 4.33 | 0.90 |
| ScRuFe-2 | 210.5 | 1461.5 | 53.4 | 0.09 | 5.07 | 4.75 | 1.18 |
| ScRuFe-3 | 128.9 | 1937.8 | 65.6 | 0.16 | 12.18 | 5.26 | 1.92 |
The holographic storage properties of the Sc:Ru:Fe:LiNbO3 crystal are known to depend on the photorefractive sensitive center. In this crystal, there are two photorefractive ions, Ru4+ and Fe3+, which can form deep and shallow trap centers, respectively. The Sc3+ ion has a stable single valence state, so it cannot form a photorefractive center. First we discuss the carrier transport model in Sc:Ru:Fe:LiNbO3 crystals. Here, Ru and Fe both have two different valences, which can form a donor level and acceptor level. Ru3+ and Fe2+ ions can bind many donor level electrons, while Ru4+ and Fe3+ can bind almost no accepter level electrons. When the incidence light was directed onto the crystal, the electrons in the donor level (Ru3+ and Fe2+) were excited to the conduction band, and after drift and diffusion, they were absorbed by accepter levels (Ru4+ and Fe3+). The process can be described as follows:33
The Sc3+ ion enter into the lattice of Ru:Fe:LiNbO3 crystal has no direct influence on the formation of the grating. The photorefractive ions Fe2+/Fe3+ and Ru3+/Ru4+ play a dominate role in photo-excited carrier transport processes. Doped Sc3+ ions influenced the ion arrangement and defects in the Sc:Ru:Fe:LiNbO3 crystals, and a detailed mechanism for this influence was derived. According to this proposed mechanism, Sc3+ ions at doping concentrations below its threshold concentration replaced the NbLi4+ defects, while Sc3+ ions at concentrations exceeding its threshold concentration replaced the normal Li position. Due to the polarization ability of the Sc3+ ion being stronger than that of the Li+ ion, the ability of Sc3+ ions to capture electrons was also better than that for Li+ ions. In the process, the trap density of the electron acceptor increased and the saturation diffraction efficiency ηsat was also improved. The equation mentioned above indicated the dynamic range M/# to be approximately proportional to the saturation diffraction efficiency ηsat, so the dynamic range M/# increased with increasing concentration of the doped Sc3+ ions. For the LiNbO3 crystal, the photoconductivity σph has been shown to be related to the electron traps and to be inversely proportional to the NbLi4+ concentration. Increasing the concentration of the doped Sc3+ ions led to a decrease in the concentration of NbLi4+, which in turn led to the increase in the photoconductivity σph and decrease in the response time. Sensitivity S is the comprehensive measure of saturation diffraction efficiency ηsat and photoconductivity σph. As the results showed, increasing the concentration of Sc3+ doped into the Ru:Fe:LiNbO3 crystals coincided with a decrease in writing time τw and increases in the dynamic range M/#, saturation diffraction efficiency ηsat, photoconductivity σph and sensitivity S.
4. Conclusions
Sc:Ru:Fe:LiNbO3 crystals with various concentrations of Sc3+ were grown by using the Czochralski method. The OH− absorption experiment results showed the absorption bands of samples ScRuFe-0, 1, 2 to all be located at a similar wavenumber, of about 3484 cm−1, when the doping Sc3+ ion concentration was below its threshold concentration. Once the Sc3+ concentration exceeded its threshold value, i.e., for ScRuFe-3, the absorption band shifted significantly, to 3507 cm−1. The two-wavelength nonvolatile experiment results demonstrated that the holographic storage properties improved with increasing Sc3+ concentration. Compared to the other samples, ScRuFe-3, i.e., that with the highest Sc3+ doping concentration, showed the shortest response time, and the highest dynamic range M/#, saturation diffraction efficiency ηsat, and sensitivity levels, which are key parameters of volume holographic date storage. These results indicated the Sc:Ru:Fe:LiNbO3 crystals to be promising materials for nonvolatile holographic storage.Conflicts of interest
There are no conflicts to declare.Acknowledgements
This work is supported by the Youth Science Fund of Heilongjiang Province of China (No. QC2015061).References
- C. Xu, C. L. Zhang and L. Dai, et al., OH− absorption and nonvolatile holographic storage properties in Mg:Ru:Fe:LiNbO3 crystal as a function of Mg concentration, Chin. Phys. B, 2013, 22(5), 306–309 Search PubMed.
- C. Xu, X. Leng and Y. Mo, et al., Investigations on growth and two-wavelength holographic storage properties varied with RuO2, codoping in Fe: LiNbO3, crystals, J. Cryst. Growth, 2011, 318(1), 665–668 CrossRef CAS.
- L. Dhar, K. Curtis and T. Fäcke, Holographic data storage: coming of age, Nat. Photonics, 2008, 2, 9–11 CrossRef.
- D. Huang, J. Wang and J. Sun, et al., Optical phase erasure and its application to format conversion through cascaded second-order processes in periodically poled lithium niobate, Opt. Lett., 2008, 33(16), 1804–1806 CrossRef.
- S. Kar, S. Verma and K. S. Bartwal, Growth Optimization and Optical Characteristics of Fe Doped LiNbO3 Crystals, Cryst. Growth Des., 2008, 8(12), 4424–4427 CAS.
- X. G. Xu, G. B. Xu and D. W. Hu, et al., Photorefractive Holographic Storage Properties in Ce:Fe-Doped LiNbO3 Crystals, Acta Opt. Sin., 2004, 24(7), 947–952 CAS.
- I. Pracka, A. L. Bajor and S. M. Kaczmarek, et al., Growth and Characterization of LiNbO3 Single Crystals Doped with Cu and Fe Ions, Cryst. Res. Technol., 2010, 34(5–6), 627–634 Search PubMed.
- C. H. Chiang and J. C. Chen, Growth and properties of Ru-doped lithium niobate crystal, J. Cryst. Growth, 2006, 294(2), 323–329 CrossRef CAS.
- L. Hesselink, S. S. Orlov, A. Liu, A. Akella, D. Lande and R. R. Neurgaonkar, Photorefractive materials for nonvolatile volume holographic data storage, Science, 1998, 282(5391), 1089 CrossRef CAS PubMed.
- Y. Tomita, M. Hoshi and S. Sunarno, Nonvolatile Two-Color Holographic Recording in Er-Doped LiNbO3, Jpn. J. Appl. Phys., 2014, 40(10), L1035–L1037 Search PubMed.
- D. L. Zhang, J. Zhang, Z. K. Wu and E. Y. B. Pun, Light-induced absorption in reduced congruent and near-stoichiometric Er:LiNbO3, crystals, Appl. Phys. A, 2006, 83(3), 397–409 CrossRef CAS.
- C. H. Huang and L. McCaughan, 980-nm-pumped Er-doped LiNbO3, waveguide amplifiers: a comparison with 1484-nm pumping, IEEE J. Sel. Top. Quantum Electron., 1996, 2(2), 367–372 CrossRef CAS.
- D. L. Zhang, J. Zhang, Y. F. Wang, D. S. Zhu, Z. K. Wu and E. Y. B. Pun, Light-induced absorption instability in weakly reduced congruent Er:LiNbO3 crystal, Appl. Phys. A, 2005, 80(8), 1819–1828 CrossRef CAS.
- D. L. Zhang, Y. R. Zhuang, J. Zhang, Z. K. Wu and E. Y. B. Pun, Light-induced diffraction in thermally reduced congruent and near-stoichiometric Er:LiNbO3 crystals, J. Mod. Opt., 2005, 52(15), 2105–2126 CrossRef CAS.
- Q. Dong, L. Liu and D. Liu, et al., Effect of dopant composition ratio on nonvolatile holographic recording in LiNbO3:Cu:Ce crystals, Appl. Opt., 2004, 43(26), 5016 CrossRef CAS PubMed.
- C. Zhou, D. Liu and G. Li, et al., Nonvolatile holograms in LiNbO3:Fe:Cu by use of the bleaching effect, Appl. Opt., 2002, 41(32), 6809 CrossRef.
- K. Buse, A. Adibi and D. Psaltis, Non-volatile holographic storage in doubly doped lithium niobate crystals, Nature, 1998, 393(6686), 665–668 CrossRef CAS.
- Y. Liu, L. Liu and D. Liu, et al., Intensity dependence of two-center nonvolatile holographic recording in LiNbO3:Cu:Ce crystals, Opt. Commun., 2001, 190(1–6), 339–343 CrossRef CAS.
- Y. Tomita, S. Sunarno and G. Zhang, Ultraviolet-light-gating two-color photorefractive effect in Mg-doped nearstoichiometric LiNbO3, J. Opt. Soc. Am. A, 2004, 21, 753–760 CrossRef CAS.
- C. Xu, C. Yang and C. Zhu, et al., Improved nonvolatile holographic storage properties in Zr: Ru:Fe:LiNbO3 crystal by blue light recording, Mater. Lett., 2012, 67(1), 320–322 CrossRef CAS.
- D. L. Zhang, C. X. Qiu and W. H. Wong, et al., Optical-Damage-Resistant Ti-Diffused LiNbO3, Strip Waveguide Doped with Scandium, IEEE Photonics Technol. Lett., 2014, 26(17), 1770–1773 CrossRef.
- D. L. Zhang, C. X. Qiu and W. H. Wong, et al., Relation of Refractive Index Change to Ti-Concentration in Ti-Diffused LiNbO3, Waveguide Doped with Sc3+, J. Lightwave Technol, 2014, 32(15), 2666–2670 CrossRef CAS.
- X. F. Yang, Z. B. Zhang and W. Y. Du, et al., Near-stoichiometric Ti:Sc:LiNbO3 strip waveguide for integrated optics, Opt. Mater. Express, 2016, 6(8), 2637 CrossRef.
- D. L. Zhang, Q. Zhang and C. X. Qiu, et al., Control of scandium diffusion in LiNbO3, single crystal by co-diffusion of titanium, J. Mater. Sci., 2015, 50(12), 4149–4159 CrossRef CAS.
- D. A. Bryan, R. Gerson and H. E. Tomaschke, Increased optical damage resistance in lithium niobate, Appl. Phys. Lett., 1984, 44(9), 847–849 CAS.
- Y. Zhang, Y. H. Xu and M. H. Li, et al., Growth and properties of Zn doped lithium niobate crystal, J. Cryst. Growth, 2001, 233(3), 537–540 CrossRef CAS.
- F. Chen, Y. Tan and A. Ródenas, Ion implanted optical channel waveguides in Er3+/MgO co-doped near stoichiometric LiNbO3: a new candidate for active integrated photonic devices operating at 1.5 μm, Opt. Express, 2008, 16(20), 16209–16214 CrossRef CAS PubMed.
- J. K. Yamamoto, Growth and characterization of Sc2O3-doped LiNbO3, J. Cryst. Growth, 1993, 128(s 1–4), 920–923 CrossRef CAS.
- H. J. Chen, L. H. Shi and W. B. Yan, et al., OH− absorption bands of LiNbO3 with varying composition, Chin. Phys. B, 2009, 18(6), 2372–2376 CrossRef CAS.
- Z. Zhou, B. Lin and S. Lin, et al., Defect structure and nonvolatile hologram storage properties in Hf:Fe:Mn:LiNbO3, crystals, Optik, 2011, 122(13), 1179–1182 CrossRef CAS.
- P. Hou, Y. Zhi and J. Sun, Theoretical studies on dynamics of fixed holograms with high diffraction efficiency in Fe:LiNbO3 crystals, SPIE-Int. Soc. Opt. Eng., 2012, 8497(12), 1109–1124 Search PubMed.
- L. Dai, Z. Yan and S. Jiao, et al., OH− absorption and one-color holographic recording in Ru:Fe:LiNbO3 crystals varied co-doped with HfO2, Opt. Mater., 2014, 38, 252–255 CrossRef CAS.
- Q. X. Xi, D. A. Liu and Y. N. Zheng, et al., Electrochromic effect in domain-inversion process in LiNbO3: Ru: Fe crystals, Chin. Sci. Bull., 2005, 50(24), 2799–2803 CAS.
| This journal is © The Royal Society of Chemistry 2018 |


