 Open Access Article
Spin-dependent and spin-independent channels of electrical transport in perovskite manganites
J. J. Qiana,
W. H. Qia,
Z. Z. Lia,
L. Maa,
G. D. Tang *ab,
Y. N. Dua,
M. Y. Chena,
G. H. Wub and
F. X. Hu
 b
b
aHebei Advanced Thin Film Laboratory, Department of Physics, Hebei Normal University, Shijiazhuang City 050024, People's Republic of China. E-mail: tanggd@hebtu.edu.cn; Tel: +86 311 80787330
bState Key Laboratory of Magnetism, Institute of Physics, Chinese Academy of Sciences, Beijing 100190, People's Republic of China
First published on 24th January 2018
Abstract
A model with two channels of electrical transport (TCET) for perovskite manganites is proposed, and it is described by an equivalent device with two current-carrier channels. In one channel, there is a spin-independent resistor (R3) with an equivalent resistivity of ρ3. In the other channel, there are two spin-dependent resistors in series (R1 and R2) with an equivalent resistivity of ρ1 + ρ2. The component ρ1 includes residual resistivity and the resistivity contributed by crystal-lattice scattering. The other component of the equivalent resistivity, ρ2, originates from the spin orientations of the itinerant electrons and the local electrons of the outer O 2p and Mn 3d orbits that deviate from the orientation of their ground states when the test temperature is close to the Curie temperature. Using this model, we fitted the experimental curves of the resistivity versus test temperature for single-crystalline La1−xSrxMnO3 (0.00 ≤ x ≤ 0.40) and polycrystalline La0.6Sr0.4Mn1−xFexO3 (0.00 ≤ x ≤ 0.30). In addition, we investigated the effects of the fraction of the antiferromagnetic phase, scattering at the crystallite interfaces, and the crystal-cell constants on the samples' resistivity. The physical mechanism of the TCET model was explained using an O 2p itinerant-electron model, which has been used in other studies to explain the magnetic ordering of several series of spinel ferrites and perovskite manganites.
1. Introduction
There have been many investigations on the electronic transport and magnetic properties of perovskite oxides1–12 because of their potential application in both electronic and magnetic information-storage devices. There are several models for the electronic-transport properties of these materials, and spin-dependent transport has been taken into account by most researchers. One of the popular views is that there is polaron hopping below the Curie temperature (TC) on the basis of the double-exchange interaction.2,3,13 In this view, the current carriers of perovskite manganites originate from the d electrons of manganese cations. Another view was proposed by Alexandrov et al.,13,14 who argued that the current carriers of perovskite manganites originate from the p holes of oxygen anions rather than the d electrons of manganese cations, based on the experimental results of electron-energy-loss spectroscopy15,16 and X-ray absorption spectroscopy.17 Alexandrov et al.13,14 therefore established a current-carrier-density collapse (CCDC) model for the electrical-transport mechanism, and many researchers followed with investigations on this CCDC model.18–21The presence of p holes of oxygen anions in an oxide can be easily understood as there are O1− anions in addition to O2− anions. When compared with an O2− anion (2s22p6) with a closed outer electron shell, it is clear that a p hole exists in the outer orbit of an O1− anion (2s22p5). This fact was further confirmed by theoretical calculations22,23 and experiments.24–26
Taking into account that there are both O1− and O2− anions in oxides,22–27 our group has proposed an O 2p itinerant-electron model for magnetic oxides (IEO model),28,29 which is similar to the O 2p hole model proposed by Alexandrov et al.13,14 Using the IEO model, our group studied the relationship between the magnetic moment and cation distribution of several series of Cr (Ti, Mn)-doped spinel ferrites.28–36 We also studied the magnetic ordering in perovskite manganites.37–40
In this study, we used a model of two channels of electrical transport (TCET), which was derived from the IEO model, to fit the temperature dependence of the resistivity for two series of perovskite manganites: single crystallines La1−xSrxMnO3 (0.00 ≤ x ≤ 0.40) reported by Urushibara et al.41 and polycrystallines La0.6Sr0.4Mn1−xFexO3 (0.00 ≤ x ≤ 0.30) prepared in this work. In addition, we will discuss the effects of the proportion of the antiferromagnetic phase, scattering at crystallite interfaces, and crystal-cell constants on the samples' resistivity.
2. Experiment and results
The polycrystalline perovskites examined in this study, La0.60Sr0.40FexMn1−xO3 (0 ≤ x ≤ 0.3), were prepared using the sol–gel method:42,43 (i) stoichiometric amounts of La2O3 (purity: 99.99%, fired in air at 1073 K for 3 h before it was used), Sr(NO3)2 (purity: 99.5%) powder, and a Mn(NO3)2 solution (purity: 50%) were dissolved in a dilute HNO3 solution at 343 K. Citric acid and ethylene glycol were added to the mixed solution as complexing agents until a completely homogeneous transparent solution was obtained. The molar ratio of citric acid (or ethylene glycol) to the perovskite molecule was 6![[thin space (1/6-em)]](https://www.rsc.org/images/entities/char_2009.gif) :
:![[thin space (1/6-em)]](https://www.rsc.org/images/entities/char_2009.gif) 1. (ii) The mixture was then evaporated at 363 K for 24 h in a water bath until a highly viscous residue was formed. Upon further heating at 373 K for 12 h and then at 473 K for 24 h, a gel developed. The gel was ground. (iii) All ground gel samples of different compositions were further heat treated. The temperature was increased from 473 to 573 K, in increments of 25 K, with 45 min spent at each step. Next, the temperature was increased from 573 to 673 K in increments of 20 K, with 50 min spent at each step. Finally, the temperature was increased from 673 to 773 K in increments of 10 K, with 1 h spent at each step. The samples were finely ground for 30 min to obtain a homogeneous mixture. After that, the samples were calcined at 873 K for 5 h to eliminate the organic material, ground, and calcined again at 1073 K for 10 h to eliminate any residual organic material. Each sample was then divided into two parts to measure their magnetic and electrical properties, and they were subjected to further heat treatment using slightly different methods.
1. (ii) The mixture was then evaporated at 363 K for 24 h in a water bath until a highly viscous residue was formed. Upon further heating at 373 K for 12 h and then at 473 K for 24 h, a gel developed. The gel was ground. (iii) All ground gel samples of different compositions were further heat treated. The temperature was increased from 473 to 573 K, in increments of 25 K, with 45 min spent at each step. Next, the temperature was increased from 573 to 673 K in increments of 20 K, with 50 min spent at each step. Finally, the temperature was increased from 673 to 773 K in increments of 10 K, with 1 h spent at each step. The samples were finely ground for 30 min to obtain a homogeneous mixture. After that, the samples were calcined at 873 K for 5 h to eliminate the organic material, ground, and calcined again at 1073 K for 10 h to eliminate any residual organic material. Each sample was then divided into two parts to measure their magnetic and electrical properties, and they were subjected to further heat treatment using slightly different methods.
To prepare the samples used to measure the magnetic properties, the powder obtained after grinding was pressed into pellets with a diameter of 13 mm and thickness of about 2 mm under a pressure of 11 ton per cm2. The pellets were calcined at 1273 K for 10 h, after which powder samples were obtained by grinding.
To prepare the samples used to measure the electrical-transport properties, the powder obtained after grinding was pressed into pellets under a pressure of 10 ton per cm2. The pellet samples were then sintered at 1573 K for 24 h.
Structural characterization was carried out by analyzing X-ray diffraction (XRD) patterns, which were measured using an X-ray diffractometer (X'Pert Pro, PANalytical, The Netherlands) with Cu Kα radiation (λ = 1.5406 Å). The data were collected in the 2θ range of 15° to 120° in increments of 0.0167°. The field and temperature dependence of the specific magnetization, σ(H) and σ(T), were measured using a physical-property measurement system (PPMS, Quantum Design, Inc., USA). Using electrical-transport characterization equipment (Versa Lab, Quantum Design, Inc., USA), the temperature dependence of the electrical resistivity ρ(T) was measured by the conventional four-point probe technique at 50 K.
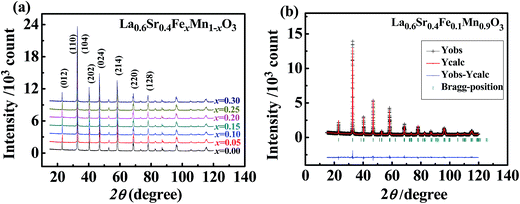
Fig. 1(a) shows the XRD patterns, which indicate that all the samples had only a single ABO3 perovskite phase with the space group R![[3 with combining macron]](https://www.rsc.org/images/entities/char_0033_0304.gif) c. The XRD patterns were fitted using the Fullprof software (Institut Laue-Langevin, France). The goodness-of-fit factor (s ≤ 1.37) is listed for all samples in Table 1. As an example, the fitted result for the La0.60Sr0.40Fe0.1Mn0.9O3 sample is shown in Fig. 1(b). The fitted result; the dependence on the Fe-doping level, x; the lattice parameters, a and c; the crystal-cell volume, v; the Mn–O bond length, dB–O; and the Mn–O–Mn bond angle, Θ, are listed in Table 1. It can be seen that the values of these parameters slightly varied: the values of a, c, v, and dB–O increased with increasing x; and the value of Θ decreased with increasing x. The equivalent cubic cell constants (ae) per formula, calculated using the crystal-cell volume, v, will be used to discuss the samples' resistivity in Section 4.4.
c. The XRD patterns were fitted using the Fullprof software (Institut Laue-Langevin, France). The goodness-of-fit factor (s ≤ 1.37) is listed for all samples in Table 1. As an example, the fitted result for the La0.60Sr0.40Fe0.1Mn0.9O3 sample is shown in Fig. 1(b). The fitted result; the dependence on the Fe-doping level, x; the lattice parameters, a and c; the crystal-cell volume, v; the Mn–O bond length, dB–O; and the Mn–O–Mn bond angle, Θ, are listed in Table 1. It can be seen that the values of these parameters slightly varied: the values of a, c, v, and dB–O increased with increasing x; and the value of Θ decreased with increasing x. The equivalent cubic cell constants (ae) per formula, calculated using the crystal-cell volume, v, will be used to discuss the samples' resistivity in Section 4.4.
| x | s | a (Å) | c (Å) | v (Å3) | dB–O (Å) | Θ (°) | σS (A m2 kg−1) | μobs (μB) | TC (K) | TN (K) | TMI (K) |
|---|---|---|---|---|---|---|---|---|---|---|---|
| 0 | 1.34 | 5.4861 | 13.356 | 348.14 | 1.9357 | 172.05 | 80.55 | 3.194 | 364.5 | — | 292 |
| 0.05 | 1.32 | 5.4898 | 13.359 | 348.69 | 1.9367 | 171.66 | 78.53 | 3.114 | 321.8 | — | 231 |
| 0.1 | 1.30 | 5.4920 | 13.362 | 349.04 | 1.9374 | 171.22 | 78.46 | 3.112 | 267.9 | — | 192 |
| 0.15 | 1.30 | 5.4936 | 13.365 | 349.30 | 1.9379 | 170.86 | 72.77 | 2.887 | 187.3 | — | 133 |
| 0.2 | 1.37 | 5.4945 | 13.366 | 349.44 | 1.9381 | 170.67 | 1.72 | 0.068 | 68.9 | 40.5 | — |
| 0.25 | 1.27 | 5.4961 | 13.368 | 349.69 | 1.9386 | 170.35 | 1.64 | 0.065 | 51.3 | 37.6 | — |
| 0.3 | 1.26 | 5.4971 | 13.370 | 349.88 | 1.9390 | 170.16 | 0.91 | 0.036 | 45.5 | 32.9 | — |
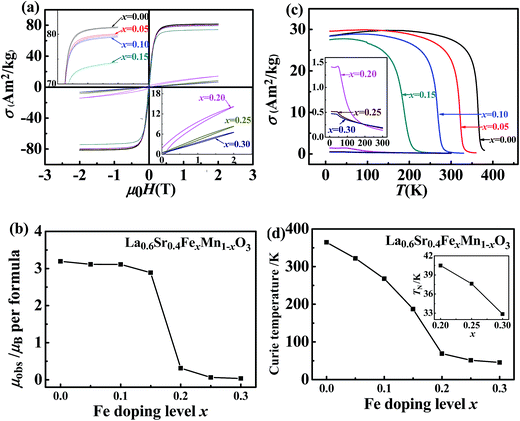
Fig. 2(a) shows the magnetic hysteresis loops of the samples measured at 10 K. Using the specific saturation magnetization, σS, at 10 K, the average values of the molecular magnetic moment, μobs, were obtained. Fig. 2(b) shows the curve of μobs versus x. Fig. 2(c) shows the curves of σ versus T under an applied magnetic field of 0.05 T. The values of the Curie temperature, TC, defined as the temperature at which dσ/dT reaches its minimum value, are shown in Fig. 2(d). In addition, the inset in Fig. 2(c) shows that there was a different Néel temperature, TN, for each sample with x ≥ 0.20. Below TN, the value of σ exhibited no significant change; above TN, the value of σ decreased distinctly. The variation of TN with x is shown in the inset in Fig. 2(d). The values of μobs, TC, and TN are listed in Table 1.
The data points in Fig. 3 show the temperature dependence of the electrical resistivity, ρ, of the samples, and it can be seen that ρ increased with increasing x. In addition, there was a resistivity peak at a characteristic temperature, TMI, for each sample when x ≤ 0.15, and these characteristic temperatures are listed in Table 1. The curves in Fig. 3 also show the fitted results, which will be discussed in the following sections.
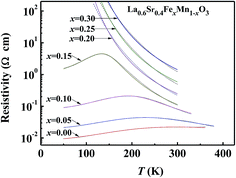 | ||
| Fig. 3 Temperature dependence of electrical resistivity of the La0.6Sr0.4FexMn1−xO3 samples. The data points represent the observed values, and the curves represent the fitted results. | ||
The following trends can be observed in Fig. 2 and 3: (i) when x ≤ 0.15, the samples were ferromagnetic conductors. The value of μobs decreased slowly from 3.194 μB (x = 0.00) to 2.887 μB (x = 0.15); the value of TC decreased rapidly from 364.5 K (x = 0.00) to 187.3 K (x = 0.15); the maximum resistivity increased from 0.0222 Ω cm (x = 0.00) to 4.47 Ω cm (x = 0.15). (ii) When x ≥ 0.20, the samples were semiconductors with both an antiferromagnetic phase and a ferromagnetic phase. The resistivity increased rapidly with decreasing temperature, exceeding 100 Ω cm when the test temperature was below 123.6, 140.2, and 159.3 K, when x = 0.20, 0.25, and 0.30, respectively. In addition, when x = 0.20, 0.25, and 0.30, respectively, the values of TN of the antiferromagnetic phase were 40.5, 37.6, and 32.9 K; the Curie temperatures of the ferromagnetic phase were 68.9, 51.3, and 45.5 K; and the μobs values were 0.068, 0.065, and 0.036 μB.
3. Model with two channels of electrical-transport (TCET) for perovskite manganites
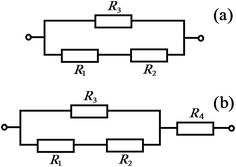
In order to explain the electrical-transport properties of perovskite manganites, we propose a model with two channels of electrical transport (TCET), which was derived from the IEO model.29,37 The IEO model is based on the following three postulates: (i) in a given sublattice, an O 2p electron with a constant spin direction can hop from an O2− anion to an O 2p hole belonging to an adjacent O1− anion, with the metal cation acting as the intermediary. (ii) The two O 2p electrons in the outer orbit of an O2− anion, which have opposite spin directions, become itinerant electrons of two different sublattices (such as the (A) and [B] sublattices of (A)[B]2O4 spinel ferrites, or the A and B sublattices of ABO3 manganites). (iii) Since an itinerant electron has a constant spin direction in a given sublattice and owing to Hund's rules,44 the directions of the magnetic moments of cations with nd ≤ 4 (where nd is the number of 3d electrons in 3d transition metal cations), such as Mn3+ or divalent and trivalent Cr cations, will couple antiferromagnetically with those of magnetic moments of cations with nd ≥ 5, such as Mn2+ or divalent and trivalent Fe, Co, and Ni cations. This occurs because in the 3d orbits of transition elements, a maximum of five electrons can have their spins aligned in the same direction.It is well known that there are two sublattices in ABO3 perovskite manganites: the A–O sublattice and the B–O sublattice. According to the above IEO model, there are O–A–O–A–O and O–B–O–B–O ionic chains, which can be regarded as two current-carrier channels. In La1−xSrxMnO3, the movement of O 2p electrons along the first channel, i.e., the O–A–O–A–O (where La and Sr occupy the A sites) ionic chain, is a spin-independent process because there is no magnetic ordering. The resistance of the first channel is labeled R3 (with an equivalent resistivity of ρ3). The movement of O 2p itinerant electrons along the second channel, i.e., the O–Mn–O–Mn–O (where Mn occupies the B site in O–B–O–B–O) ionic chain, is a spin-dependent process below the Curie temperature because there is magnetic ordering. The resistance of the second channel is represented by two resistors in series, R1 and R2 (with an equivalent resistivity of ρ1 + ρ2), where ρ1 includes the residual resistivity and the resistivity resulting from scattering by the crystal lattice, and ρ2 originates from the spin orientations of the itinerant electrons and local electrons of the outer O 2p and Mn 3d orbits that deviate from the orientation of their ground states because of thermal fluctuation. Therefore, the TCET model for a perovskite manganite sample can be represented by the equivalent circuit shown in Fig. 4(a), with the resistance, R, and resistivity, ρ, defined as follows:
 | (1) |
A series of curves of ρ versus test temperature, T, for single-crystalline La1−xSrxMnO3 (0.00 ≤ x ≤ 0.40) were reported by Urushibara et al.,41 and they were fitted using the TCET model. As shown in Fig. 5, the fitted curves are very close to the observed results (data points).
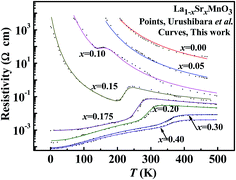 | ||
| Fig. 5 Temperature dependence of electrical resistivity of the single-crystalline La1−xSrxMnO3 samples. The data points represent values observed by Urushibara et al.,41 and the curves represent the fitted values obtained in this work. | ||
When 0.175 ≤ x ≤ 0.40, we found that the resistivities in eqn (1) can be expressed as follows:
 | (2) |
![[thin space (1/6-em)]](https://www.rsc.org/images/entities/char_2009.gif) ρ versus 1/kBT can be seen at higher temperatures, as shown in Fig. 6(b). We obtained the approximate values of ln
ρ versus 1/kBT can be seen at higher temperatures, as shown in Fig. 6(b). We obtained the approximate values of ln![[thin space (1/6-em)]](https://www.rsc.org/images/entities/char_2009.gif) a3 and E3 from the intercept and slope, respectively, of the straight line in Fig. 6(b). Third, we determined the parameters a2 and E2 by fitting the curves of ρ versus T. In this fitting process, the parameters ρ0, a1, and T1 remained constant, but a3 and E3 required slight adjustments. The curves of observed ρ, and fitted ρ1, ρ2 and ρ3 versus T are shown in Fig. 6(c). Finally, the dependence of the observed (data points) and fitted (curve) ρ of La0.8Sr0.2MnO3 on the test temperature, T, is shown in Fig. 6(d). It can be seen that the fitted curve is very close to the observed results.
a3 and E3 from the intercept and slope, respectively, of the straight line in Fig. 6(b). Third, we determined the parameters a2 and E2 by fitting the curves of ρ versus T. In this fitting process, the parameters ρ0, a1, and T1 remained constant, but a3 and E3 required slight adjustments. The curves of observed ρ, and fitted ρ1, ρ2 and ρ3 versus T are shown in Fig. 6(c). Finally, the dependence of the observed (data points) and fitted (curve) ρ of La0.8Sr0.2MnO3 on the test temperature, T, is shown in Fig. 6(d). It can be seen that the fitted curve is very close to the observed results.
| Sr content x | ρ0 (Ω cm) | a1 (Ω cm K−3) | T1 (K) | a11 (Ω cm) | E1 (eV) | a2 (Ω cm) | E2 (eV) | a3 (Ω cm) | E3 (eV) |
|---|---|---|---|---|---|---|---|---|---|
| 0.00 | — | — | — | — | — | — | — | 0.2440 | 0.175 |
| 0.05 | — | — | — | — | — | — | — | 0.0220 | 0.170 |
| 0.10 | — | — | — | 0.009 | 0.15 | 4 × 10⁵ | 0.115 | 0.0050 | 0.150 |
| 0.15 | — | — | — | 0.0014 | 0.08 | 1 × 10¹¹ | 0.515 | 0.0115 | 0.075 |
| 0.175 | 9.5 × 10⁻⁴ | 2.4 × 10¹⁰ | 10 | — | — | 8 × 10¹⁰ | 0.650 | 0.0112 | 0.0515 |
| 0.20 | 2.3 × 10⁻⁴ | 1.5 × 10¹⁰ | 20 | — | — | 4.5 × 10¹⁰ | 0.730 | 0.0095 | 0.0354 |
| 0.30 | 8.5 × 10⁻⁵ | 5.5 × 10⁻¹¹ | 30 | — | — | 9 × 10⁹ | 0.860 | 0.0084 | 1 × 10⁻⁴ |
| 0.40 | 7.5 × 10⁻⁵ | 4.2 × 10⁻¹¹ | 35 | — | — | 7 × 10⁹ | 0.880 | 0.0041 | 5 × 10⁻⁵ |
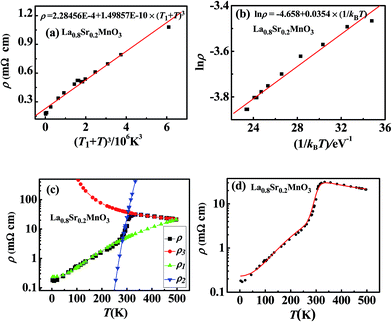 | ||
Fig. 6 Fitting process of the temperature (T) dependence of the resistivity (ρ) for single-crystalline La0.8Sr0.2MnO3. The data points in (a, b and d) represent values observed by Urushibara et al.41 (a) Fitting results of the curve of ρ versus (T1 + T)3 at lower temperatures. (b) Fitting results of the curve of ln![[thin space (1/6-em)]](https://www.rsc.org/images/entities/char_2009.gif) ρ versus 1/kBT at higher temperatures. (c) Curves of observed ρ (squares),41 fitted ρ1 (triangles), fitted ρ2 (inverted triangles), and fitted ρ3 (circles) versus T. (d) Dependence of observed (data points41) and fitted (curve) ρ on T. ρ versus 1/kBT at higher temperatures. (c) Curves of observed ρ (squares),41 fitted ρ1 (triangles), fitted ρ2 (inverted triangles), and fitted ρ3 (circles) versus T. (d) Dependence of observed (data points41) and fitted (curve) ρ on T. | ||
For the antiferromagnetic semiconductor samples with x = 0.00 and 0.05, the curves of ρ versus T can only be fitted by the equation  The values of the fitted parameters a3 and E3 are listed in Table 2.
For the samples with x = 0.10 and 0.15, the curves of ρ versus T can be fitted using eqn (1) and (2), but the expression  must substitute for ρ1 in eqn (2). The values of the fitted parameters a11, E1, a2, E2, a3, and E3 are listed in Table 2.
For the polycrystalline samples of La0.6Sr0.4FexMn1−xO3 (0.00 ≤ x ≤ 0.30) prepared in this work, scattering by the crystallite interfaces affected the sample resistivity, ρ, and the equivalent circuit is shown in Fig. 4(b). We first fitted the observed curves of ρ versus T using eqn (1) and (2), and the effect of scattering at the crystallite interfaces was then analyzed, as discussed in following Section 4.3. The fitted curves of ρ versus T for La0.6Sr0.4FexMn1−xO3 (0.00 ≤ x ≤ 0.30) are shown in Fig. 3. It can be seen that the fitted curves are very close to the observed results. The values of the fitted parameters are listed in Table 3.
| Fe content x | ρ0 (Ω cm) | a1 (Ω cm K−3) | T1 (K) | a2 (Ω cm) | E2 (eV) | a3 (Ω cm) | E3 (eV) |
|---|---|---|---|---|---|---|---|
| 0 | 0.0072 | 2.794 × 10⁻¹⁰ | 150 | 0.05 | 0.060 | 0.0044 | 0.0650 |
| 0.05 | 0.0172 | 1.050 × 10⁻⁹ | 107 | 0.40 | 0.090 | 0.0020 | 0.0865 |
| 0.1 | 0.0737 | 1.116 × 10⁻⁸ | 63 | 25 | 0.110 | 0.0019 | 0.0995 |
| 0.15 | 1.1000 | 1.159 × 10⁻⁶ | 20 | 20![[thin space (1/6-em)]](https://www.rsc.org/images/entities/char_2009.gif) 000 000 |
0.120 | 0.0018 | 0.1070 |
| 0.2 | — | — | — | — | — | 0.0030 | 0.1140 |
| 0.25 | — | — | — | — | — | 0.0056 | 0.1200 |
| 0.3 | — | — | — | — | — | 0.0114 | 0.1245 |
4. Discussion
4.1 Spin-dependent and spin-independent electrical transport in perovskite manganites, and their difference from free electron transport in magnetic metals
Fig. 6(c) shows that at lower temperatures, the spin-independent resistivity, ρ3, of La0.8Sr0.2MnO3 prepared by Urushibara et al. was so high that the electrical transport occurred along the spin-dependent channel, and the value of ρ was close to ρ1, which increased with increases in the test temperature T owing to the thermal vibration of ions. When T was close to TC, the transition probability of the itinerant electrons decreased rapidly and ρ2 increased rapidly because the spin orientations of the itinerant electrons and the electrons in the outer O 2p and Mn 3d orbits deviated from the direction of their ground states. When T was higher than TC, the spin orientations of the itinerant electrons changed into disorder, and the electrical transport became spin-independent along both O–A–O–A–O and O–B–O–B–O ionic chains.It should be noted that the resistivity of La0.6Sr0.4MnO3, also prepared by Urushibara et al., was 84 μΩ cm at 2 K,41 which is far higher than the resistivities of the magnetic metals Fe (8.6 μΩ cm), Ni (6.14 μΩ cm), and Co (5.57 μΩ cm). Therefore, it can be concluded that the spin-dependent transport of itinerant electrons in perovskite manganites below TC is distinctly different from the spin-independent transport of free electrons in magnetic metals.
4.2 Effect of proportion of the antiferromagnetic phase on the resistivity of La0.6Sr0.4FexMn1−xO3 (0.00 ≤ x ≤ 0.30)
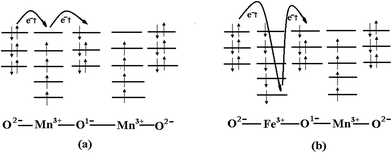
Our previous investigation37–39 showed that all Mn and Fe ions are trivalent in La0.6Sr0.4FexMn1−xO3. According to the IEO model, an itinerant electron with up-spin in a sample with no Fe doping moves along the O2−–Mn3+–O1−–Mn3+–O2− ion chain, which always occupies the highest energy level whenever it reaches a Mn3+ or O2− ion, as shown in Fig. 7(a). In this transition process, the itinerant electron consumes a small fraction of the energy of the system. When an itinerant electron with up-spin moves along the O2−–Fe3+–O1−–Mn3+–O2− ion chain, it always occupies the highest energy whenever it reaches a Mn3+ or O1− ion, but the lowest energy level of an Fe3+ ion, as shown in Fig. 7(b), because the Fe3+(3d5) cation couples antiferromagnetically with the Mn3+(3d4) cation (see the IEO model). In this transition process, the itinerant electron must consume more energy of the system, resulting in lower transition probabilities for the itinerant electrons and increased resistivity. Therefore, the resistivity increases with increasing proportion of the antiferromagnetic phase. As shown in Fig. 7(a and b), the spin orientation of the majority of 3d electrons in Mn3+ cations is up; the spin orientation of the majority of local 3d electrons in Fe3+ cations and local O 2p electrons in O1− anions is down.The difference between the energy consumed by the itinerant electrons in polycrystalline La0.6Sr0.4MnO3 and La0.6Sr0.4Fe0.1Mn0.9O3 was estimated from their Curie temperatures (364.5 and 267.9 K, respectively; see Table 1) to be 8.3 meV.
4.3 Resistivity (ρ4) originating from scattering at the crystallite interfaces of polycrystalline samples
It is interesting to compare the resistivity of the polycrystalline La0.6Sr0.4MnO3 sample (ρP) prepared in this work to that of the single-crystalline La0.6Sr0.4MnO3 sample (ρS) reported by Urushibara et al.,41 as shown in Fig. 8(a). We found that ρP is 97 times (at 50 K) and 9 times (at 360 K) the value of ρS, which suggests that the resistivity (ρ4) originating from scattering at the crystallite interfaces of the polycrystalline sample was far higher those originating from lattice thermal vibrating (ρ1) and spin-dependent scattering (ρ2). Therefore, for the polycrystalline manganites, the TCET model can be represented by the equivalent circuit shown in Fig. 4(b). Fig. 8(b) shows a comparison of ρ4 with ρP, where ρ4 was estimated using ρ4 = ρP − ρS.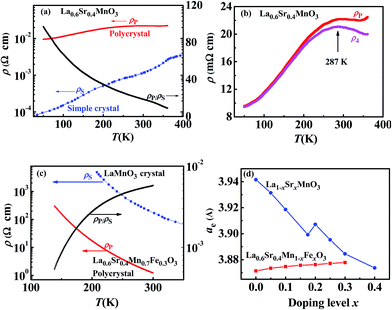 | ||
| Fig. 8 (a) Temperature dependence of the resistivities, ρP and ρS,41 of polycrystalline and single-crystalline La0.6Sr0.4MnO3, and their ratio, ρP/ρS. (b) Temperature dependence of the observed resistivity, ρP, and the estimated resistivity resulting from crystallite interface scattering, ρ4, of polycrystalline La0.6Sr0.4MnO3, (c) Temperature dependence of ρP of La0.6Sr0.4Fe0.3Mn0.7O3 and ρS of LaMnO3, and their ratio, ρP/ρS. (d) Dependence of the equivalent cubic cell constant, ae, of the single-crystalline La1−xSrxMnO3 samples41 and the polycrystalline La0.6Sr0.4FexMn1−xO3 samples on the doping level, x. | ||
According to the report by Urushibara et al.,41 the temperature TMI for maximum resistivity is very close to the value of TC for single-crystalline La1−xSrxMnO3 (0.175 ≤ x ≤ 0.40). However, as shown in Table 2, the values of TMI were distinctly lower than TC for the polycrystalline La0.6Sr0.4FexMn1−xO3 (0.00 ≤ x ≤ 0.15) samples. This was simply due to ρ4 of the polycrystalline samples. For the La0.6Sr0.4MnO3 sample, the temperature at which ρ4 reached a maximum was 287 K (see Fig. 8(b)), which is distinctly lower than its TC (364.5 K).
4.4 Effect of crystal-cell constants on the samples' resistivity
For the antiferromagnetic semiconductor, polycrystalline La0.6Sr0.4Fe0.3Mn0.7O3, its resistivity was far lower than that of single-crystalline LaMnO3, with a ρP/ρS ratio of 0.51% at 270 K and 0.58% at 300 K, as shown in Fig. 8(c). A comparison of Fig. 8(a) and (c) shows an interesting phenomenon: the change in amplitude of the resistivity from that of the polycrystalline ferromagnetic conductor, La0.6Sr0.4MnO3, to that of the antiferromagnetic semiconductor, La0.6Sr0.4Fe0.3Mn0.7O3, is far lower than the change in amplitude of the resistivity from that of the single-crystalline ferromagnetic conductor, La0.6Sr0.4MnO3, to that of the antiferromagnetic semiconductor, LaMnO3. The primary causes of this phenomenon may be the distinct difference in the crystal-cell constants of the two systems, and the proportion of the antiferromagnetic phase. The equivalent cubic cell constants (ae) of single-crystalline La1−xSrxMnO3 (ref. 41) and polycrystalline La0.6Sr0.4FexMn1−xO3 are shown in Fig. 8(d), which were calculated using the average volume per formula of each sample. The samples of La0.6Sr0.4FexMn1−xO3 (0.0 ≤ x ≤ 0.3) and La1−xSrxMnO3 (0.175 ≤ x ≤ 0.40) exhibited rhombohedral structures, while La1−xSrxMnO3 (0.00 ≤ x ≤ 0.15) was reported to have an orthorhombic structure.41 The value of ae of the polycrystalline La0.6Sr0.4MnO3 is very close to that of the single-crystalline La0.6Sr0.4MnO3. However, the value of ae of polycrystalline La0.6Sr0.4FexMn1−xO3 prepared in our study increased from 3.872 Å (x = 0.00) to 3.878 Å (x = 0.30), while the value of ae of single-crystalline La1−xSrxMnO3 was reported to increase from 3.874 Å (x = 0.40) to 3.942 Å (x = 0.00). According to previous investigations,37,38 there are only Mn3+ cations in La1−xSrxMnO3 (0.15 ≤ x ≤ 0.40). Therefore, the increase in resistivity from x = 0.40 to x = 0.15 occurred because of the increase in the crystal-cell constant, while the increase in resistivity from x = 0.15 to x = 0.00 occurred because of increases in both the crystal-cell constant and the proportion of the antiferromagnetic phase.Obviously, an increase (in increments of 0.01 Å, for example) in ae may rapidly reduce the transition probability of the itinerant electrons whenever spin-dependent or spin-independent transitions take place, resulting in an increase in the resistivity. This may be the reason the samples of La0.9Sr0.1MnO3 and La0.85Sr0.15MnO3 exhibited high resistivity at low temperatures, as shown in Fig. 5. For the sample of La0.85Sr0.15MnO3, ρ > 500 Ω cm when T < 10 K because of the large crystal lattice constant, ae, which resulted in a lower spin-dependent transition probability of the itinerant electrons. The value of ρ decreased with increasing T below 202 K because of the thermal energy of the itinerant electrons, which resulted in an increase in their spin-dependent transition probability. In the temperature range of 202–234 K, ρ increased with increasing T because the spin orientation of the itinerant electrons and local electrons of the outer O 2p and Mn 3d orbits deviated from their ground state direction, resulting in a decrease in their spin-dependent transition probability.
4.5 Activation energy (E3) of spin-independent electron transition
The values of the activation energy, E3, of the spin-independent electron transition in the polycrystalline La0.6Sr0.4FexMn1−xO3 (0.00 ≤ x ≤ 0.30) samples ranged from 65.0 to 124.5 meV (see Table 3), which are similar to the values (90.5 to 148.3 meV) of the polaron activation energy, Ep, obtained by Liu et al. with the CCDC model for La0.7Ca0.3TixMn1−xO3 (0.00 ≤ x ≤ 0.07).18 The comparable results indicate that the TCET model in this work is similar to the CCDC model.13,14,18–20 However, the physical mechanism of the TCEP model, which includes spin-dependent and spin-independent electron transitions, is easier to be understood than that of the CCDC model, which assumes that the current-carrier density changes sharply at the magnetic-transition temperature.Tables 2 and 3 show that among the ferromagnetic samples, E3 of polycrystalline La0.6Sr0.4MnO3 (65.0 meV) is far higher than that of single-crystalline La0.6Sr0.4MnO3 (0.05 meV) owing to scattering at the crystallite interfaces in the polycrystalline sample. However, among the antiferromagnetic samples, E3 of polycrystalline La0.6Sr0.4Fe0.3Mn0.7O3 (124.5 meV) is distinctly lower than that of antiferromagnetic LaMnO3 (175 meV), which may have been caused by the different crystal-cell constants, as discussed in the previous section.
The value of the parameter a3 (0.0044 Ω cm, see Table 3) of the polycrystalline conductor, La0.6Sr0.4MnO3, is very close to that of the single-crystalline conductor, La0.6Sr0.4MnO3 (0.0041 Ω cm, see Table 2). However, the value of a3 (0.0114 Ω cm) of the polycrystalline semiconductor, La0.6Sr0.4Fe0.3Mn0.7O3, is far lower than that of the single-crystalline semiconductor, LaMnO3 (0.2440 Ω cm). This may be attributed to the effect of the crystal-cell constant, as discussed in Section 4.4.
4.6 Regression coefficients of ρ1 and ρ2
As shown in eqn (2) and Tables 2 and 3, the spin-dependent resistivities, ρ1 and ρ2, are represented by parameters (or regression coefficients) that play interesting roles:(i) The resistivity ρ1 in eqn (2) is determined by three parameters: the residual resistivity, ρ0; the parameters a1 and T1 resulting from scattering by the crystal lattice. All three parameters of the polycrystalline La0.6Sr0.4FexMn1−xO3 samples—ρ0 = 0.0072 to 1.100 Ω cm, a1 = 2.794 × 10⁻¹⁰ to 1.159 × 10⁻⁶ (Ω cm) K−3, T1 = 150 to 20 K—are higher than those of the single-crystalline La1−xSrxMnO3 samples—ρ0 = 0.075 to 0.95 mΩ cm, a1 = 4.2 × 10⁻¹¹ to 2.4 × 10⁻¹⁰ (Ω cm) K−3, and T1 = 35 to 10 K—because of the effect of crystallite interfaces in the polycrystalline samples.
(ii) The resistivity ρ2 in eqn (2) is determined by two parameters: the amplitude a2; the activation energy E2, which originated from spin-dependent scattering. The value of E2 of the single-crystalline La1−xSrxMnO3 samples increased from 0.515 eV (x = 0.15) to 0.88 eV (x = 0.40), which was the result of competition between two factors. One factor was the increase in the cant angle between magnetic moments of Mn3+ cations from 0 (x = 0.15) to 34.9° (x = 0.40).37 Another factor was the decrease in crystal cell volume with increasing x. The value of E2 of the polycrystalline La0.6Sr0.4FexMn1−xO3 samples increased from 0.06 eV (x = 0.00) to 0.12 eV (x = 0.15), which can be attributed to the increase in Fe-doping level because the magnetic moments of Fe3+ cations couple antiferromagnetically with those of Mn3+ cations.39 The a2 values of the polycrystalline La0.6Sr0.4FexMn1−xO3 samples are far lower than those of the single-crystalline La1−xSrxMnO3 samples, possibly because of the intense scattering at the crystallite interfaces to reduce the effect of spin-dependent scattering.
5. Conclusion
In order to explain the dependence of the resistivity (ρ) of perovskite manganites on the test temperature (T), we propose a model with two channels of electrical transport (TCET): a spin-independent channel (with resistivity ρ3) and a spin-dependent channel (with resistivity ρ1 + ρ2). At low temperature, ρ3 is very high, and the electrical transport occurs along the spin-dependent channel. When T is far lower than the Curie temperature (TC), ρ is very close to ρ1, which increases with increasing T owing to the thermal vibration of the crystal lattice. When T is close to TC, ρ2 increases rapidly owing to the spin orientations of the itinerant electrons, and the local electrons of the outer O 2p and Mn 3d orbits deviating from the orientation of their ground states. Therefore, the spin-dependent electrical transport in perovskite manganites at temperatures below TC is distinctly different from the spin-independent electrical transport in metals. When T is higher than TC, the spin orientations of the itinerant electrons change into disorder, and electrical transport occurs along both channels, with the spin-independent transition, ρ, being close to ρ3.Several determining factors of the resistivity have been discussed: (i) the increase in the proportion of the antiferromagnetic phase may result in an increase in ρ. (ii) The resistivity ρ4 originating from crystallite-interface scattering in the polycrystalline samples is far higher than ρ1 and ρ2 at temperatures below TC. (iii) Increases in the crystal-cell constant, in increments as small as 0.01 Å, may result in rapid increases in ρ, which may be the reason of the high resistivity of La0.9Sr0.1MnO3 and La0.85Sr0.15MnO3 at low temperatures.
Conflicts of interest
There are no conflicts to declare.Acknowledgements
This work is supported by the National Natural Science Foundation of China (NSF-11174069), the Natural Science Foundation of Hebei Province (A2015205111), the Key item Science Foundation of Hebei Province (Grant No. 16961106D), and the Young scholar Science Foundation of the Education Department of Hebei Province (QN2016015).References
- Y. Izuchi, M. Akaki, D. Akahoshi and H. Kuwahara, APL Mater., 2014, 2, 022106 CrossRef.
- K. Horiba, M. Kitamura, K. Yoshimatsu, M. Minohara, E. Sakai, M. Kobayashi, A. Fujimori and H. Kumigashira, Phys. Rev. Lett., 2016, 116, 076401 CrossRef PubMed.
- A. Belkahla, K. Cherif, J. Dhahri, K. Taibi and E. K. Hlil, RSC Adv., 2017, 7, 30707 RSC.
- A. O. Turky, M. M. Rashad, A. M. Hassan, E. M. Elnaggar and M. Bechelany, RSC Adv., 2016, 6, 17980 RSC.
- J. Lu, Y. H. Zhang, Z. Lu, X. Q. Huang, Z. H. Wang, X. B. Zhu and B. Wei, RSC Adv., 2015, 5, 5858 RSC.
- R. Nath and A. K. Raychaudhuri, RSC Adv., 2015, 5, 57875 RSC.
- A. Demont and S. Abanades, RSC Adv., 2014, 4, 54885 RSC.
- A. Herpers, K. J. O'Shea, D. A. MacLaren, M. Noyong, B. Rösgen, U. Simon and R. Dittmann, APL Mater., 2014, 2, 106106 CrossRef.
- C. Adamo, L. Méchin, T. Heeg, M. Katz, S. Mercone, B. Guillet, S. Wu, J.-M. Routoure, J. Schubert, W. Zander, R. Misra, P. Schiffer, X. Q. Pan and D. G. Schlom, APL Mater., 2015, 3, 062504 CrossRef.
- D. J. Singh and W. E. Pickett, Phys. Rev. B: Condens. Matter Mater. Phys., 1998, 57, 88–91 CrossRef CAS.
- J. D. Lee and B. I. Min, Phys. Rev. B: Condens. Matter Mater. Phys., 1997, 55, 12454–12459 CrossRef CAS.
- H. Y. Hwang, S.-W. Cheong, N. P. Ong and B. Batlogg, Phys. Rev. Lett., 1996, 77, 2041–2044 CrossRef CAS PubMed.
- A. S. Alexandrov and A. M. Bratkovsky, Phys. Rev. Lett., 1999, 82, 141–144 CrossRef CAS.
- A. S. Alexandrov, A. M. Bratkovsky and V. V. Kabanov, Phys. Rev. Lett., 2006, 96, 117003 CrossRef CAS PubMed.
- N. Nücker, J. Fink, J. C. Fuggle, P. J. Durham and W. M. Temmerman, Phys. Rev. B: Condens. Matter Mater. Phys., 1988, 37, 5158–5163 CrossRef.
- H. L. Ju, H.-C. Sohn and K. M. Krishnan, Phys. Rev. Lett., 1997, 79, 3230–3233 CrossRef CAS.
- K. Ibrahim, H. J. Qian, X. Wu, M. I. Abbas, J. O. Wang, C. H. Hong, R. Su, J. Zhong, Y. H. Dong, Z. Y. Wu, L. Wei, D. C. Xian, Y. X. Li, G. J. Lapeyre, N. Mannella, C. S. Fadley and Y. Baba, Phys. Rev. B: Condens. Matter Mater. Phys., 2004, 70, 224433 CrossRef.
- X. M. Liu, H. Zhu and Y. H. Zhang, Phys. Rev. B: Condens. Matter Mater. Phys., 2001, 65, 024412 CrossRef.
- L. M. Wang, C. Y. Wang and C. C. Tseng, Appl. Phys. Lett., 2012, 100, 232403 CrossRef.
- M. A. B. Narreto, H. S. Alagoz, J. Jeon, K. H. Chow and J. Jung, J. Appl. Phys., 2014, 115, 223905 CrossRef.
- L. S. Xu, J. Y. Fan, Y. Zhu, Y. G. Shi, L. Zhang, L. Pi, Y. H. Zhang and D. N. Shi, Chem. Phys. Lett., 2015, 634, 174–178 CrossRef CAS.
- R. E. Cohen, Nature, 1992, 358, 136 CrossRef CAS.
- R. E. Cohen and H. Krakauer, Phys. Rev. B: Condens. Matter Mater. Phys., 1990, 42, 6416 CrossRef CAS.
- J.-C. Dupin, D. Gonbeau, P. Vinatier and A. Levasseur, Phys. Chem. Chem. Phys., 2000, 2, 1319 RSC.
- L. Q. Wu, Y. C. Li, S. Q. Li, Z. Z. Li, G. D. Tang, W. H. Qi, L. C. Xue, X. S. Ge and L. L. Ding, AIP Adv., 2015, 5, 097210 CrossRef.
- L. Q. Wu, S. Q. Li, Y. C. Li, Z. Z. Li, G. D. Tang, W. H. Qi, L. C. Xue, L. L. Ding and X. S. Ge, Appl. Phys. Lett., 2016, 108, 021905 CrossRef.
- D. H. Ji, G. D. Tang, Z. Z. Li, X. Hou, Q. J. Han, W. H. Qi, R. R. Bian and S. R. Liu, J. Magn. Magn. Mater., 2013, 326, 197–200 CrossRef CAS.
- G. D. Tang, Q. J. Han, J. Xu, D. H. Ji, W. H. Qi, Z. Z. Li, Z. F. Shang and X. Y. Zhang, Phys. B, 2014, 438, 91–96 CrossRef CAS.
- J. Xu, L. Ma, Z. Z. Li, L. L. Lang, W. H. Qi, G. D. Tang, L. Q. Wu, L. C. Xue and G. H. Wu, Phys. Status Solidi B, 2015, 252, 2820–2829 CrossRef CAS.
- Z. F. Shang, W. H. Qi, D. H. Ji, J. Xu, G. D. Tang, X. Y. Zhang, Z. Z. Li and L. L. Lang, Chin. Phys. B, 2014, 23, 107503 CrossRef.
- L. L. Lang, J. Xu, W. H. Qi, Z. Z. Li, G. D. Tang, Z. F. Shang, X. Y. Zhang, L. Q. Wu and L. C. Xue, J. Appl. Phys., 2014, 116, 123901 CrossRef.
- X. Y. Zhang, J. Xu, Z. Z. Li, W. H. Qi, G. D. Tang, Z. F. Shang, D. H. Ji and L. L. Lang, Phys. B, 2014, 446, 92–99 CrossRef CAS.
- L. C. Xue, L. L. Lang, J. Xu, Z. Z. Li, W. H. Qi, G. D. Tang and L. Q. Wu, AIP Adv., 2015, 5, 097167 CrossRef.
- L. L. Lang, J. Xu, Z. Z. Li, W. H. Qi, G. D. Tang, Z. F. Shang, X. Y. Zhang, L. Q. Wu and L. C. Xue, Phys. B, 2015, 462, 47–53 CrossRef CAS.
- J. Xu, D. H. Ji, Z. Z. Li, W. H. Qi, G. D. Tang, X. Y. Zhang, Z. F. Shang and L. L. Lang, Phys. Status Solidi B, 2015, 252, 411–420 CrossRef CAS.
- J. Xu, W. H. Qi, D. H. Ji, Z. Z. Li, G. D. Tang, X. Y. Zhang, Z. F. Shang and L. L. Lang, Acta Phys. Sin., 2015, 64, 017501 Search PubMed.
- L. Q. Wu, W. H. Qi, X. S. Ge, D. H. Ji, Z. Z. Li, G. D. Tang and W. Zhong, Europhys. Lett., 2017, 120, 27001 CrossRef.
- X. S. Ge, L. Q. Wu, S. Q. Li, Z. Z. Li, G. D. Tang, W. H. Qi, H. J. Zhou, L. C. Xue and L. L. Ding, AIP Adv., 2017, 7, 045302 CrossRef.
- X. S. Ge, Z. Z. Li, W. H. Qi, D. H. Ji, G. D. Tang, L. L. Ding, J. J. Qian and Y. N. Du, AIP Adv., 2017, 7, 125002 CrossRef.
- L. Q. Wu, W. H. Qi, Y. C. Li, S. Q. Li, Z. Z. Li, G. D. Tang, L. C. Xue, X. S. Ge and L. L. Ding, Acta Phys. Sin., 2016, 65, 027501 Search PubMed.
- A. Urushibara, Y. Moritomo, T. Arima, A. Asamitsu, G. Kido and Y. Tokura, Phys. Rev. B: Condens. Matter Mater. Phys., 1995, 51, 14103 CrossRef CAS.
- D. H. Ji, G. D. Tang, Z. Z. Li, Q. J. Han, X. Hou, R. R. Bian and S. R. Liu, J. Appl. Phys., 2012, 111, 113902 CrossRef.
- X. Hou, D. H. Ji, W. H. Qi, G. D. Tang and Z. Z. Li, Chin. Phys. B, 2015, 24, 057501 CrossRef.
- C. W. Chen, Magnetism and Metallurgy of Soft Magnetic Materials, North-Holland Publishing Company, 1977 Search PubMed.
| This journal is © The Royal Society of Chemistry 2018 |

