 Open Access Article
Creative Commons Attribution 3.0 Unported Licence
Mechanisms of partial hydrogen sorption reversibility in a 3NaBH4/ScF3 composite
Ning Zhaoa,
Jianxin Zou *ab,
Xiaoqin Zengab and
Wenjiang Dingab
aNational Engineering Research Center of Light Alloy Net Forming, State Key Laboratory of Metal Matrix Composites, Shanghai Jiao Tong University, Shanghai, 200240, P. R. China. E-mail: zoujx@sjtu.edu.cn; Fax: +86-21-34203730; Tel: +86-21-54742381
bShanghai Engineering Research Center of Mg Materials and Applications, School of Materials Science and Engineering, Shanghai Jiao Tong University, Shanghai, 200240, P. R. China
First published on 1st March 2018
Abstract
A new hydrogen storage composite containing NaBH4 and a 3d transition metal fluoride, 3NaBH4/ScF3, was synthesized via ball milling. The composite shows no reaction during milling and its dehydriding process can be divided into three steps upon heating: (i) partial substitution of H− by F− in NaBH4 to form NaBHxF4−x at the early stage, releasing about 0.19 wt% of hydrogen; (ii) formations of Na3ScF6, NaBF4 and ScB2 through the reaction between NaBH4 and ScF3, with 2.52 wt% of hydrogen release and a dehydriding activation energy of 162.67 kJ mol−1 H2; (iii) further reaction of residual NaBH4 and Na3ScF6 to form NaF, B and ScB2, with a dehydriding activation energy of 169.37 kJ mol−1 H2. The total hydrogen release of the composite reaches 5.54 wt% at 530 °C. The complete dehydrided composite cannot be rehydrogenated while the products after the second dehydriding step can be hydrogenated with an absorption activation energy of 44.58 kJ mol−1 H2. These results demonstrate that by adding 3d transition metal fluorides into NaBH4, a partial reversibility in NaBH4 can be achieved.
1 Introduction
Hydrogen is one of the most promising alternative and attractive clean energy sources that can substitute fossil fuels, with sufficient energy density and environment-friendliness.1,2 Nevertheless, almost a century since the concept of “hydrogen economy” was introduced by Jules Velne,3,4 it is still challenging to find reliable, flexible and cost-efficient hydrogen media for on-board, stationary and portable applications.5,6 In the past few decades, great attention has been paid to both hydrogen production technologies and a variety of hydrogen storage methods,7–10 including the use of different compounds,11,12 especially complex hydrides, of which borohydrides are typical representative.13–15 These solid-state hydrogen storage materials offer some advantages over high pressure gaseous storage and low temperature liquid storage, such as high capacity, high safety, and low cost. In particular, alkali metal borohydrides are regarded as possible hydrogen carries, ascribed to their contribute to their high gravimetric and volumetric hydrogen density, together with good stability.16 However, current research results showed that few technologies regarding the use of metal borohydrides as hydrogen storage carriers are able to fulfill the requirements established by the US Department of Energy.17Early investigations into borohydrides have shown that, compared to other borohydrides such as LiBH4 and KBH4, NaBH4 is stable under alkaline conditions, and undergoes hydrolysis through the following reaction:18
| NaBH4 + 4H2O → NaBO2·2H2O + 4H2 | (1) |
However, the use of NaBH4 as a hydrogen generator through hydrolysis faces several issues related to the catalyst durability, and/or poisoning, as well as storage vessels.19–21 In contrast, thermal decomposition of NaBH4 has emerged as potential alternative method for hydrogen storage. J. Urgnani et al. investigated the thermal decomposition behaviors of NaBH4, and proposed that NaBH4 would decompose in two steps according to the following reactions:22
 | (2) |
| NaBH4 → Na + B + 2H2 | (3) |
For the sake of improving the thermodynamic and kinetic properties of the thermal decomposition of NaBH4, many strategies have been taken, such as adding catalyst, building thermodynamic destabilization system, nano-engineering and chemical modifications.13,23–25 For instance, NaBH4/MgH2 system could fulfil its decomposition before melting due to the formation of MgB2 in the system.26 Czujiko et al. suggested that pure Mg could lower down the desorption temperature of NaBH4 through catalytic effect.27 In addition, the decomposition of NaBH4 may occur at lower temperatures with some reversibility through the addition of Ni-based catalysts,28 which facilitates hydrogen release and improves the reversibility to some extent.29 Moreover, the chemical reaction that regenerates borohydrides from metal–borides occurs much easier over the regeneration from boron since less energy is required for breaking the chemical bond between B–M (M means metal) relative to the B–B's.30
In previous works, many research works regarding hydrogen storage composite systems have been carried out, and some of them have explored how rare earth element (RE) addition can effect the thermodynamics and kinetics properties of metal borohydrides based systems, i.e., NaBH4–YF3,31 NaBH4–ScCl3,32 LiBH4–YCl3,33 etc. In particular, hydrogen sorption reversibility was achieved in 3NaBH4/LnF3 systems with good thermodynamic and kinetic properties.34
Considering that scandium lies in the III B column of the periodic table as the lanthanide elements, we attempt to prepare a new hydrogen storage system, 3NaBH4/ScF3, through ball milling method. Our previous investigations on NaBH4–MF3 (M = metal) systems proved that the molar ratio of 3![[thin space (1/6-em)]](https://www.rsc.org/images/entities/char_2009.gif) :
:![[thin space (1/6-em)]](https://www.rsc.org/images/entities/char_2009.gif) 1 was the best one, i.e. 3NaBH4/LnF3 (Ln = La, Ce, Nd, Gd, Yb),34 3NaBH4/YF3,31 3NaBH4/PrF3 and 3NaBH4/HoF3.35,36 If the molar ratio of NaBH4 to MF3 is higher than 3
1 was the best one, i.e. 3NaBH4/LnF3 (Ln = La, Ce, Nd, Gd, Yb),34 3NaBH4/YF3,31 3NaBH4/PrF3 and 3NaBH4/HoF3.35,36 If the molar ratio of NaBH4 to MF3 is higher than 3![[thin space (1/6-em)]](https://www.rsc.org/images/entities/char_2009.gif) :
:![[thin space (1/6-em)]](https://www.rsc.org/images/entities/char_2009.gif) 1, some NaBH4 will be left after the desorption due to the incomplete reaction. While if the ratio is less than 3
1, some NaBH4 will be left after the desorption due to the incomplete reaction. While if the ratio is less than 3![[thin space (1/6-em)]](https://www.rsc.org/images/entities/char_2009.gif) :
:![[thin space (1/6-em)]](https://www.rsc.org/images/entities/char_2009.gif) 1, MF3 is excessive, and the overall hydrogen sorption capacity is reduced since MF3 can neither release nor absorb hydrogen. Consequently, the ratio of NaBH4 to ScF3 is set as 3
1, MF3 is excessive, and the overall hydrogen sorption capacity is reduced since MF3 can neither release nor absorb hydrogen. Consequently, the ratio of NaBH4 to ScF3 is set as 3![[thin space (1/6-em)]](https://www.rsc.org/images/entities/char_2009.gif) :
:![[thin space (1/6-em)]](https://www.rsc.org/images/entities/char_2009.gif) 1 in the present work. We conducted a detailed study of hydrogen sorption behaviors of the 3NaBH4/ScF3 system, and proposed mechanisms of hydrogen sorption in this composite, depending on experimental analyses.
1 in the present work. We conducted a detailed study of hydrogen sorption behaviors of the 3NaBH4/ScF3 system, and proposed mechanisms of hydrogen sorption in this composite, depending on experimental analyses.
2 Experimental
2.1 Sample preparation
NaBH4 (Aladdin Reagent Database Inc., 96%) and ScF3 (Aladdin Reagent Database Inc., 98%) were used as starting materials without further purification and mixed in the molar ratio of 3![[thin space (1/6-em)]](https://www.rsc.org/images/entities/char_2009.gif) :
:![[thin space (1/6-em)]](https://www.rsc.org/images/entities/char_2009.gif) 1 in a planetary ball miller whose type is QM-1SP2. The stainless steel vessel with 100 ml volume was used to load 0.3928 g of NaBH4 and 0.3530 g of ScF3 powders together with 25 stainless steel balls (diameter of 5 mm, average weight of 0.8950 g each). The ball to powder weight ratio is approximately 30
1 in a planetary ball miller whose type is QM-1SP2. The stainless steel vessel with 100 ml volume was used to load 0.3928 g of NaBH4 and 0.3530 g of ScF3 powders together with 25 stainless steel balls (diameter of 5 mm, average weight of 0.8950 g each). The ball to powder weight ratio is approximately 30![[thin space (1/6-em)]](https://www.rsc.org/images/entities/char_2009.gif) :
:![[thin space (1/6-em)]](https://www.rsc.org/images/entities/char_2009.gif) 1. Ball milling is conducted at a rotation speed of 400 rpm for 180 min. The prearrangement, manipulation and storage of specimen were carried out in an Ar-filled Lab 2000 glove box (Etelux inert gas system Co., Ltd.) in which neither moisture nor oxygen concentration beyonds 10 ppm.
1. Ball milling is conducted at a rotation speed of 400 rpm for 180 min. The prearrangement, manipulation and storage of specimen were carried out in an Ar-filled Lab 2000 glove box (Etelux inert gas system Co., Ltd.) in which neither moisture nor oxygen concentration beyonds 10 ppm.
2.2 Characterization
The analyses of phase composition for the ball milled, dehydrogenated and rehydrogenated samples were accomplished using an X-ray diffraction apparatus (D/max 2550VL/PC), equipped with a Cu-Kα radiation source. For XRD tests, composite powder at different states were kept into specific sample holders with arched glass on both sides and airtight PVC tape on the top, to isolate them from air. Meanwhile, the broad peak at around 2θ = 15° in the patterns is caused by the tape. Using a Spectrum Nicolet iS5 produced by Thermo Fisher Scientific Inc., Fourier transform infrared spectroscopy (FTIR) tests were performed on samples with different states in an Ar filled glove box. In principle of volumetric methods, we carried out temperature-programmed-desorption (TPD) measurements on 0.2 g of the 3NaBH4/ScF3 composite sample from room temperature to about 530 °C under an initial vacuum condition, with a heating rate RH of 3 °C min−1. Evaluations of hydrogen absorption performance were implemented for 10 h at various temperatures under around 3.2 MPa H2 pressure.Dehydrogenation behaviors of composites were determined by synchronous thermal analyzer (Differential Scanning Calorimetry/Thermal Gravimetry, DSC/TG), in a Netzsch, STA 449 F3 Jupiter equipment, in which RH = 3 °C min−1, 5 °C min−1, 7 °C min−1 and 10 °C min−1, respectively, starting from room temperature to about 500 °C, under the protection of 0.1 MPa Ar flow. To compare the properties of hydrogen storage performances of different composites, data of weight percent considering hydrogen release and uptake during the tests was assessed based on the samples' initial weight value.
3 Results and discussions
3.1 Dehydrogenation of the 3NaBH4/ScF3 composite
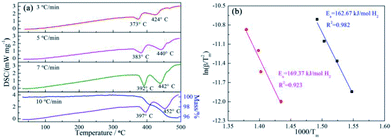
The effect of the ScF3 addition on the hydrogen desorption behaviors of NaBH4 was examined by DSC measurements at different RH, namely 3 °C min−1, 5 °C min−1, 7 °C min−1 and 10 °C min−1, as well as TG measurement at the RH of 10 °C min−1, as Fig. 1 showed.Two major endothermic peaks upon heating appeared on the DSC curves, indicating that two main desorption steps took place during dehydrogenation. According to the starting point of dehydriding in DSC profiles, the first major dehydrogenation begins at 356 °C with RH = 3 °C min−1 heating rate condition. In contrast, pure NaBH4 shows a dehydrogenation temperature of 517 °C under the same condition.31 In addition, a subsequent broad endothermic peak was also recorded. TG curve obtained at the heating rate of 10 °C min−1 shows that the total mass loss reaches 4.10 wt% at 500 °C. According to the DSC/TG profiles, the dehydrogenation enthalpies of the first and second major desorption reactions are determined to be 27.43 ± 5 kJ mol−1 H2 and 29.54 ± 2 kJ mol−1 H2, respectively.
The apparent dehydrogenation activation energy (Ea) of the 3NaBH4/ScF3 sample could be determined using the Kissinger method,37 as described below:
 | (4) |
| Sample | Heating rate/°C min−1 | Temperature of peaks/°C | |
|---|---|---|---|
| 3NaBH4/ScF3 | 3 | 373 | 424 |
| 5 | 383 | 440 | |
| 7 | 392 | 442 | |
| 10 | 397 | 452 | |
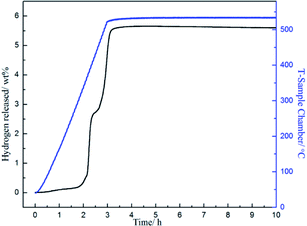
To obtain further information of dehydrogenation process of the target system, TPD measurement was performed on the ball-milled composite with a constant RH of 3 °C min−1 from ambient temperature to 530 °C and the results are shown in Fig. 2. The results exhibit that 3NaBH4/ScF3 composite has an appropriate onset dehydrogenation temperature, which is actually lower than 200 °C in vacuum. Meanwhile, the figure shows that the desorption behavior may be subdivided into three consecutive processes, with a small amount of hydrogen (∼0.19 wt%) released at temperature lower than 310 °C in the initial process, and the latter two steps range from 310 °C to 420 °C, and above 420 °C, releasing about 2.52 wt% and 2.83 wt% of hydrogen, respectively. In comparison to the DSC measurements, the second and third desorption steps shown in TPD profile should correspond to the two major endothermic peaks on DSC curves.
The entire hydrogen release obtained from the experimental process up to 530 °C is 5.54 wt%, which is over 95% of the theoretical hydrogen content. Previous study shows that during dehydrogenation process of pure NaBH4 under the same condition, only 0.68 wt% weight loss is observed when heated up to 482 °C.19 Thus, the hydrogen desorption properties of NaBH4 were significantly promoted by the addition of ScF3. However, from Fig. 1, there is no endothermic peak present from ambient to 300 °C in DSC curves. C. Bonatto Minella reported a related phenomenon and the difference between DSC analyses and volumetric measurements was ascribed to dissimilar experimental conditions.38
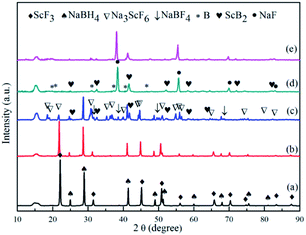
XRD analyses were performed on samples treated under a series of controlled conditions in order to have a better understanding of mechanisms of de/rehydrogenation in the 3NaBH4/ScF3 composite, as shown in Fig. 3. The results show that no new product can be found in the sample after ball milling, except NaBH4 (JCPDS no. 09-0386) and ScF3 (JCPDS no. 46-1243), which means that only physical mixing takes place during milling process. Before dehydrogenation at various temperatures of 300 °C, 420 °C and 530 °C, the loaded sample container was first placed under a 4.5 MPa H2 pressure, then followed by a quick temperature rising and heat preservation. At last, the sample chamber was evacuated and powders were treated at the expected temperature for 3 h. After dehydrogenation at 300 °C under vacuum, it can be clearly seen in Fig. 4 that diffraction peaks from NaBH4 in the 3NaBH4/ScF3 composite shifted slightly from high angle side to lower angle side, demonstrating a lattice expansion of NaBH4 after the first dehydrogenation.
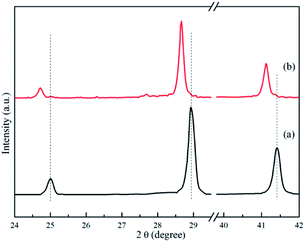 | ||
| Fig. 4 XRD patterns of 3NaBH4/ScF3 composite after ball milling (a) and after dehydrogenation at 300 °C (b) in the range of low diffraction angle. | ||
On the basis of the XRD patterns and using the RIR analysis, the lattice parameters of NaBH4 in ball milled sample is calculated to be: a = 0.6165 nm, b = 0.6184 nm, c = 0.6153 nm and α = β = γ = 90°. After the first step dehydrogenation at 300 °C, the lattice constants of NaBH4 changed into a = 0.6185 nm, b = 0.6225 nm, c = 0.6166 nm and α = β = γ = 90°. Such a lattice expansion of NaBH4 might be attributed to the fact that H− was partially substituted by F− in the unit cell. Similar phenomenon was also observed in some previous works,29,39–43 for which the lattice expansion was attributed to the formation of an intermediate compound NaBHxF4−x. In the present work, the formation of NaBHxF4−x occurred at the first desorption step between NaBH4 and ScF3, together with releasing small amount of hydrogen, as also seen in the 3NaBH4/NdF3, 3NaBH4/PrF3, 3NaBH4/HoF3 systems,19,35,36 and was regarded as an energy favorable process in theory.44 Upon heating at temperatures higher than 310 °C, along with the reduction of NaBH4 and disappearance of ScF3 (Fig. 3c), Na3ScF6 appeared in the system, indicating that a major reaction between NaBH4 and ScF3 occurred. It has been also indicated by Radovan Cerny et al. that in the case of NaBH4/ScCl3 system, Na3ScCl6 and NaSc(BH4)4 formed as a result of the reaction between NaBH4 and ScCl3.32 Chong et al. reported that the reaction occurred at 250 °C between NaBH4 and HoF3 could produce NaHo(BH4)4 and NaHo2F7 phases.36 In the 3NaBH4/ScF3 composite, NaSc(BH4)4 might form upon heating and then decomposed to ScB2 and H2. Based on the XRD analysis, the second dehydrogenation step before 420 °C can be described as:
| 27NaBH4 + 20ScF3 = 8Na3ScF6 + 12ScB2 + 54H2 + 3NaBF4 | (5) |
Such a reaction has a theoretical hydrogen release of 2.53 wt%, close to the value measured from TPD for the second step dehydrogenation. At around 500 °C, the remaining NaBH4 reacts with Na3ScF6 and NaBF4 to produce NaF, ScB2 and B, as shown in the indexed XRD pattern of Fig. 3d. Thus, the third dehydrogenation step can be described as follows:
| 33NaBH4 + 8Na3ScF6 + 3NaBF4 = 60NaF + 8ScB2 + 66H2 + 20B | (6) |
3.2 Rehydrogenation in the 3NaBH4/ScF3 composite
Fig. 3e shows the XRD pattern of the complete dehydrogenated 3NaBH4/ScF3 composite (530 °C for 3 h) that is maintained under a pressure of 3.2 MPa H2 at 420 °C for 10 h. The pattern shows no change compared to that of the complete dehydrogenated composite, which means that the latter one has no hydrogen absorption ability.As the complete dehydrogenated 3NaBH4/ScF3 composite shows no reversibility, the hydrogen absorption after the second dehydrogenation step was attempted to study the possible reversibility. The profiles of hydrogen absorption are given in Fig. 5a, which are obtained under the condition of 380 °C, 400 °C and 420 °C at 3.2 MPa H2 pressure for the sample that has gone through dehydrogenation at 420 °C for 3 h. These curves clearly show the reversible hydrogen absorption of the partial dehydrogenated 3NaBH4/ScF3 composite: under the pressure of 3.2 MPa H2, a hydrogenation capacity of 1.59 wt% can be achieved at 420 °C for 8 h, while it can absorb 1.28 wt% at 400 °C and 1.19 wt% at 380 °C, respectively. By contrast, under 3.5 MPa hydrogen pressure, pure NaBH4 shows no hydrogen absorption at 400 °C.36
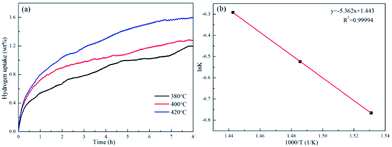 | ||
Fig. 5 Isothermal hydrogen absorption curves for the partially dehydrogenated 3NaBH4/ScF3 composite sample at temperatures of 380 °C, 400 °C and 420 °C (a) and the ln![[thin space (1/6-em)]](https://www.rsc.org/images/entities/char_2009.gif) k-1000/T fitting plot (b). k-1000/T fitting plot (b). | ||
The hydrogenation activation energy (Eab) is generally utilized to discriminate kinetics of absorption, by analyzing the entire energy barriers of hydrogen absorption process. Based on the Johanson–Mehl–Avrami (JMA) model, the following equation can be used to evaluate absorption kinetics:48
ln[−ln(1 − αA)] = η![[thin space (1/6-em)]](https://www.rsc.org/images/entities/char_2009.gif) ln ln![[thin space (1/6-em)]](https://www.rsc.org/images/entities/char_2009.gif) k + η k + η![[thin space (1/6-em)]](https://www.rsc.org/images/entities/char_2009.gif) ln ln![[thin space (1/6-em)]](https://www.rsc.org/images/entities/char_2009.gif) t t
| (7) |
 | (8) |
![[thin space (1/6-em)]](https://www.rsc.org/images/entities/char_2009.gif) k versus 1000/T, which is shown in Fig. 5, displays a good linear relationship. Therefore, the Eab value obtained from the slope is therefore estimated to be 44.58 kJ mol−1 H2 for the partially dehydrogenated 3NaBH4/ScF3 composite.
k versus 1000/T, which is shown in Fig. 5, displays a good linear relationship. Therefore, the Eab value obtained from the slope is therefore estimated to be 44.58 kJ mol−1 H2 for the partially dehydrogenated 3NaBH4/ScF3 composite.
To elucidate the mechanism of hydrogen absorption in the partially dehydrogenated 3NaBH4/ScF3 composite, XRD analysis is carried out on the rehydrogenated sample and the result is shown in Fig. 6. The 3NaBH4/ScF3 sample was dehydrided at 420 °C for 3 h in vacuum and then rehydrogenated at 420 °C for 10 h under the pressure of 3.2 MPa H2. In Fig. 6, the diffraction peaks from NaBF4 and ScB2 phases became weaker and even disappeared along with the increment in peak intensities of NaBH4 and ScF3 as compared to those in Fig. 3c. Therefore, the hydrogen absorption in the partial dehydrogenated 3NaBH4/ScF3 composite follows exactly the reverse reaction path of the second step dehydrogenation. That is, the rehydrogenation consumes Na3ScF6, NaBF4 and ScB2, accompanied with the regeneration of NaBH4 and ScF3. Compared to the completely dehydrogenated 3NaBH4/ScF3 composite, the partially dehydrogenated composite contains Na3ScF6 and NaBF4 phases, indicating that these two phases play the key role for the rehydrogenation.
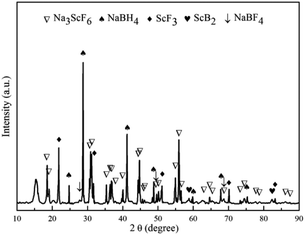 | ||
| Fig. 6 XRD pattern of the partially dehydrogenated 3NaBH4/ScF3 composite sample after rehydrogenation. | ||
The results of FTIR analyses for the ball-milled 3NaBH4/ScF3 sample, sample dehydrogenated at 420 °C for 3 h and corresponding products rehydrogenated at 400 °C for 3 h can be found in Fig. 7. In Fig. 7a, the FTIR spectrum of sample after ball milling has the signatures of B–H stretching band in the position of 2226 cm−1, 2306 cm−1 and 2366 cm−1, and B–Hbending band peak at 1119 cm−1, all of which are supposed to be originated from borohydride. These peaks are considered to be from NaBH4.19 However, it should be noted that, the height of those peaks, which represent the intensity of B–H bonds vibration from the [BH4]− group, gradually become weaker as dehydrogenation reaction proceeds, indicating the decomposition of NaBH4, as seen at 1121 cm−1, 2221 cm−1, 2338 cm−1 and 2369 cm−1 in Fig. 7b. According to the work of D. Syamala,44 peak located at 1065 cm−1 can be marked as [BF4]−asymmetric stretching, indicating the formation of NaBF4 after the second step dehydrogenation, which is in good agreement with the XRD results (Fig. 3c). In Fig. 7c, the signatures of [BH4]− bending at 1120 cm−1 and [BH4]− stretching at 2223 cm−1, 2304 cm−1 and 2359 cm−1 were clearly revealed for the rehydrogenated sample and the intensity of these peaks increased, indicating the regeneration of NaBH4.49 Meantime, the peak from [BF4]− asymmetric stretching disappeared after rehydrogenation, showing the consumption of NaBF4 along with rehydrogenation. Peaks at wave numbers between 1330 cm−1 and 1800 cm−1 (Fig. 7a) were subtracted from the unavoidable moisture absorption and atmospheric humidity absorbed by the sample during measurement, while peak located at around 3745 cm−1 was identified as stretching band vibration of O–H.50
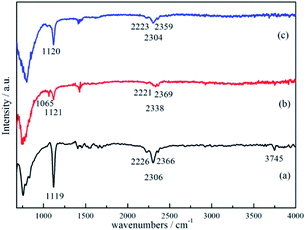 | ||
| Fig. 7 FTIR spectra of the 3NaBH4/ScF3 composite after ball-milling (a), half dehydrogenated 3NaBH4/ScF3 sample (b), rehydrogenation of partially dehydrogenated 3NaBH4/ScF3 sample (c). | ||
3.3 Mechanisms of hydrogenation in 3NaBH4/ScF3 composite
It is shown in the present work that the hydrogen storage performance of NaBH4 can be effectively improved by introducing ScF3 as a reagent. In particular, rehydrogenation can be achieved in the partially dehydrogenated 3NaBH4/ScF3 composite. Analyses revealed that both Sc3+ cation and F− anion show irreplaceable importance during the re/dehydrogenation processes of the composite. Firstly, F anion can replace H anion in the initial process of dehydrogenation, from NaBH4 to form NaBHxF4−x. Then, Sc cation loses electron to form ScB2, in which Sc cation has the calculated valence of +4.08,51 rather than served as a three-valent cation. This is accompanied with the formation of hydrogen gas. Meanwhile, during the second dehydrogenation step, a portion of F anions from ScF3 incorporate into Na3ScF6 crystallites, which might serve as the nucleation center for the growth of other products.It has been established that the regeneration of NaBH4 in the NaBH4–MFx systems is associated with electronegativity (χp) of the metal cations.52 Previous works have shown that after adding transition metal fluorides into NaBH4 based composites, when the Pauling's electronegativity of the transition metal lies in around between 1.23–1.54, hydrogen sorption reversibility has larger thermodynamic tendency to occur.52 The χp value of Sc3+ is 1.415, which lies in such specific range, thus the regeneration of NaBH4 in the dehydrided 3NaBH4/ScF3 system is favorable.53
Using a database of density functional theory,54–56 the enthalpies of desorption reactions are calculated to be 41.01 kJ mol−1 H2 for the second dehydriding step, and 43.31 kJ mol−1 H2 for the final step. These values are comparably higher than the values obtained from DSC/TG analyses, but significant lower than that of pristine NaBH4 (108 ± 3 kJ mol−1 of H2).57 The differences between the calculated and measured enthalpies can be explained by fact that H− was partially substituted by F− in NaBH4, which is also observed in other NaBH4 based systems containing fluorides.58 However, the enthalpy for complete dehydrogenation is still fairly high, about 56.97 kJ mol−1 H2 calculated from DSC analyses. Consequently, the rehydrogenation of the complete dehydrided 3NaBH4/ScF3 composite is difficult from the thermodynamic point of view.52
During the rehydrogenation process, the experimental results show that only partial dehydrogenated products (NaBF4 + ScB2 + Na3ScF6) have reversibility, while the final dehydriding products (NaF + ScB2 + B) cannot be rehydrogenated. Apart from the thermodynamic factors, this might also be understood from structural similarity between [BF4]− in NaBF4 and [BH4]− in NaBH4, which may facilitate the regeneration of NaBH4 through the exchange between H− and F−. The structural similarity was also observed between dehydrogenated and rehydrogenated products in the 3NaBH4/LnF3 systems, which led to the improved rehydrogenation kinetics in these systems.25 Researchers have also found that substitution reaction could be well understood from the hydride–fluoride isostructure, which has been proposed and confirmed in various hydrides–fluorides compounds having different stoichiometries.59–61
4 Conclusions
In this study, the 3NaBH4/ScF3 composite was prepared through mechanical milling. The behaviors and mechanisms of hydrogen de/absorption of the composite were explained by using TPD, DSC/TG, XRD and FTIR techniques. Following are the summarized results:(1) TPD and DSC analyses confirmed that NaBHxF4−x compound formed at the early dehydriding stage due to the partial substitution of H− anion by F− anion in NaBH4, releasing about 0.19 wt% of hydrogen. When temperature further increases, Na3ScF6, NaBF4 and ScB2 formed through the reaction between NaBH4 and ScF3 with 2.52 wt% of hydrogen released. Finally, the reaction of residual NaBH4 with Na3ScF6 produces NaF, B and ScB2, releasing about 2.83 wt% of hydrogen.
(2) The partially dehydrogenated products, Na3ScF6, ScB2 and NaBF4, can be rehydrogenated to generate NaBH4 with an activation energy of 44.58 kJ mol−1 H2. In contrast, the fully dehydrogenated products, NaF + ScB2 + B, cannot be hydrogenated. The hydrogen sorption reversibility of the partially dehydrogenated composite can be understood through thermodynamic point of view and the structural similarity between [BF4]− in NaBF4 and [BH4]− in NaBH4.
Conflicts of interest
There are no conflicts to declare.Acknowledgements
This work was supported by National Nature Science Foundation (No. 51771112), the Shanghai Science and Technology Commission under No. 14JC1491600 and Shanghai Education Commission “Shuguang” scholar project (16SG08).Notes and references
- W. Li, X. F. Gao, X. G. Wang, D. H. Xiong, P. P. Huang, W. G. Song, X. Q. Bao and L. F. Liu, J. Power Sources, 2016, 330, 156 CrossRef CAS.
- T. da Silva Veras, T. S. Mozer and A. da Silva César, Int. J. Hydrogen Energy, 2017, 42, 2018 CrossRef CAS.
- Q. W. Lai, M. Paskevicius, D. A. Sheppard, C. E. Buckley, A. W. Thornton, M. R. Hill, Q. F. Gu, J. F. Mao, Z. G. Huang, H. K. Liu, Z. P. Guo, A. Banerjee, S. Chakraborty, R. Ahuja and K.-F. Aguey-Zinsou, ChemSusChem, 2015, 8, 2789 CrossRef CAS PubMed.
- L. Schlapbach and A. Züttel, Nature, 2001, 414, 353 CrossRef CAS PubMed.
- J. F. Mao and D. H. Gregory, Energies, 2015, 8, 430 CrossRef CAS.
- W. Li, X. F. Gao, D. H. Xiong, F. Xia, J. Liu, W. G. Song, J. Y. Xu, S. M. Thalluri, M. F. Cerqueira, X. L. Fu and L. F. Liu, Chem. Sci., 2017, 8, 2952 RSC.
- F. Z. Song, W. Li, G. Q. Han and Y. J. Sun, ACS Appl. Energy Mater., 2018, 1, 3 CrossRef CAS.
- W. Li, D. H. Xiong, X. F. Gao, W. G. Song, F. Xia and L. F. Liu, Catal. Today, 2017, 287, 122 CrossRef CAS.
- W. Li, X. G. Wang, D. H. Xiong and L. F. Liu, Int. J. Hydrogen Energy, 2016, 41, 9344 CrossRef CAS.
- P. P. Silva, R. A. Ferreira, F. B. Noronha and C. E. Hori, Catal. Today, 2017, 289, 211 CrossRef CAS.
- W. Li, X. Gao, D. Xiong, F. Wei, W. G. Song, J. Xu and L. Liu, Adv. Energy Mater., 2017, 7, 1602579 CrossRef.
- C. Y. Cao, C. Q. Chen, W. Li, W. G. Song and W. Cai, ChemSusChem, 2010, 3, 1241 CrossRef CAS PubMed.
- J. F. Mao, Q. F. Gu, Z. P. Guo and H. K. Liu, J. Mater. Chem. A, 2015, 3, 11269 CAS.
- S. Orimo, Y. Nakamori, J. R. Eliseo, A. Züttel and C. M. Jensen, Chem. Rev., 2007, 107, 4111 CrossRef CAS PubMed.
- P. Chen and M. Zhu, Mater. Today, 2008, 11, 36 CrossRef CAS.
- D. M. F. Santos and C. A. C. Sequeira, Renewable Sustainable Energy Rev., 2011, 15, 3980 CrossRef CAS.
- Y. F. Liu, Y. X. Yang, M. X. Gao and H. G. Pan, Chem. Rec., 2016, 16, 189 CrossRef CAS PubMed.
- U. B. Demirci, O. Akdim, J. Andrieux, J. Hannauer, R. Chamoun and P. Miele, Fuel Cells, 2010, 10, 335 CrossRef CAS.
- L. N. Chong, J. X. Zou, X. Q. Zeng and W. J. Ding, J. Mater. Chem. A, 2013, 1, 3983 CAS.
- M. Yadav and Q. Xu, Energy Environ. Sci., 2012, 5, 9698 CAS.
- G. Moussa, R. Moury, U. B. Demirci, T. Sener and P. Miele, Int. J. Energy Res., 2013, 37, 825 CrossRef CAS.
- J. Urgnani, F. J. Torres, M. Palumbo and M. Baricco, Int. J. Hydrogen Energy, 2008, 33, 3111 CrossRef CAS.
- T. J. Frankcombe, Chem. Rev., 2011, 112, 2164 CrossRef PubMed.
- P. E. de Jongh and P. Adelhelm, ChemSusChem, 2010, 3, 1332 CrossRef CAS PubMed.
- J. J. Vajo, T. T. Salguero, A. F. Gross, S. L. Skeith and G. L. Olson, J. Alloys Compd., 2007, 446, 409 CrossRef.
- A. T. Dinsdale, Calphad, 1991, 15, 317 CrossRef CAS.
- T. Czujiko, R. A. Varin, Z. Zaranski and Z. S. Wronski, Arch. Metall. Mater., 2010, 55, 539 Search PubMed.
- T. D. Humphries, G. N. Kalantzopoulos, I. Llamas-Jansa, J. E. Olsen and B. C. Hauback, J. Phys. Chem. C, 2013, 117, 6060 CAS.
- J. F. Mao, Z. P. Guo, I. P. Nevirkovets, H. K. Liu and S. X. Dou, J. Phys. Chem. C, 2012, 116, 1596 CAS.
- S. A. Jin, J. H. Shim, Y. W. Cho, K. W. Yi, O. Zabara and M. Fichtner, Scr. Mater., 2008, 58, 963 CrossRef CAS.
- J. X. Zou, L. J. Li and X. Q. Zeng, Int. J. Hydrogen Energy, 2012, 37, 17118 CrossRef CAS.
- R. Cerny, G. Severa, D. B. Ravnsbæk, Y. Filinchuk, V. D'Anna, H. Hagemann, D. Haase, C. M. Jensen and T. R. Jensen, J. Phys. Chem. C, 2010, 114, 1357 CAS.
- D. B. Ravnsbæk, Y. Filinchuk, R. Cerny, M. B. Ley, D. Haase, H. J. Jakobsen, J. Skibsted and T. R. Jensen, Inorg. Chem., 2010, 49, 3801 CrossRef PubMed.
- L. N. Chong, J. X. Zou, X. Q. Zeng and W. J. Ding, J. Mater. Chem. A, 2015, 3, 4493 CAS.
- L. N. Chong, J. X. Zou, X. Q. Zeng and W. J. Ding, J. Mater. Chem. A, 2013, 1, 13510 CAS.
- L. N. Chong, J. X. Zou, X. Q. Zeng and W. J. Ding, Int. J. Hydrogen Energy, 2014, 39, 14275 CrossRef CAS.
- H. E. Kissinger, Anal. Chem., 1957, 29, 1702 CrossRef CAS.
- C. Bonatto Minella, S. Garroni, C. Pistidda, R. Gosalawit-Utke, G. Barkhordarian, C. Rongeat, I. Lindemann, O. Gutfleisch, T. R. Jensen, Y. Cerenius, J. Christensen, M. D. Baró, R. Bormann, T. Klassen and M. Dornheim, J. Phys. Chem. C, 2011, 115, 2497 Search PubMed.
- L. C. Yin, P. Wang, X. D. Kang, C. H. Sun and H. M. Cheng, Phys. Chem. Chem. Phys., 2007, 9, 1499 RSC.
- R. Gosalawit-Utke, J. M. Bellosta von Colbe, M. Dornheim, T. R. Jensen, Y. Cerenius, C. Bonatto Minella, M. Peschke and R. Bormann, J. Phys. Chem. C, 2010, 114, 10291 CAS.
- H. W. Brinks, A. Fossdal and B. C. Hauback, J. Phys. Chem. C, 2008, 112, 5658 CAS.
- Y. F. Liu, F. H. Wang, Y. H. Cao, M. X. Gao, H. G. Pan and Q. D. Wang, Energy Environ. Sci., 2010, 3, 645 CAS.
- Z. Z. Fang, X. D. Kang, Z. X. Yang, G. S. Walker and P. Wang, J. Phys. Chem. C, 2011, 115, 11839 CAS.
- D. Syamala, V. Rajendran, R. K. Natarajan and S. Moorthy Badu, Cryst. Growth Des, 2007, 7, 1695 CAS.
- S. Garroni, C. Milanese, D. Pottmaier, G. Mulas, P. Nolis, A. Girella, R. Caputo, D. Olid, F. Teixdor, M. Baricco, A. Marini, S. Suriñach and M. D. Baró, J. Phys. Chem. C, 2011, 115, 16664 CAS.
- J. H. Her, W. Zhou, V. Stavila, C. M. Brown and T. J. Udovic, J. Phys. Chem. C, 2009, 113, 11187 CAS.
- R. Caputo, S. Garroni, D. Olid, F. Teixidor, S. Surinach and M. D. Baro, Phys. Chem. Chem. Phys., 2010, 12, 15093 RSC.
- P. S. Rudman, J. Less-Common Met., 1983, 89, 93 CrossRef CAS.
- T. Sato, K. Miwa, Y. Nakamori, K. Ohoyama, H. W. Li, T. Noritake, M. Aoki, S. I. Towata and S. I. Orimo, Phys. Rev. B, 2008, 77, 104114 CrossRef.
- A. M. Olsson and L. Salmén, Carbohydr. Res., 2004, 339, 813 CrossRef CAS PubMed.
- R. S. Roth and S. Schneider, National Bureau of Standards, 1972, p. 364.
- Y. Nakamori, K. Miwa, A. Ninomiya, H. W. Li, N. Ohba, S. I. Towata, A. Züttel and S. I. Orimo, Phys. Rev. B, 2006, 74, 045126 CrossRef.
- K. Y. Li and D. F. Xue, J. Phys. Chem. A, 2006, 110, 11332 CrossRef CAS PubMed.
- A. Jain, G. Hautier, S. P. Ong, C. J. Moore, C. C. Fischer, K. A. Persson and G. Ceder, Phys. Rev. B: Condens. Matter Mater. Phys., 2011, 84, 045115 CrossRef.
- A. Jain, S. P. Ong, G. Hautier, W. Chen, W. D. Richards, S. Dacek, S. Cholia, D. Gunter, D. Skinner, G. Ceder and K. A. Persson, APL Mater., 2013, 1, 011002 CrossRef.
- L. C. Yin, P. Wang, Z. Z. Fang and H. M. Cheng, Chem. Phys. Lett., 2008, 450, 318 CrossRef CAS.
- P. Martelli, R. Caputo, A. Remhof, P. Mauron, A. Borgschulte and A. Züttel, J. Phys. Chem. C, 2010, 114, 7173 CAS.
- L. N. Chong, J. X. Zou, X. Q. Zeng and W. J. Ding, J. Mater. Chem. A, 2014, 2, 8557 CAS.
- A. Bouamrane, J. P. Laval, J.-P. Soulie and J. P. Bastide, Mater. Res. Bull., 2000, 35, 545 CrossRef CAS.
- J. P. Soulié, J. P. Laval and A. Bouamrane, Solid State Sci., 2003, 5, 273 CrossRef.
- Q. Zhou and B. J. Kennedy, J. Solid State Chem., 2004, 177, 654 CrossRef CAS.
| This journal is © The Royal Society of Chemistry 2018 |

