 Open Access Article
Superlattice-like structure and enhanced ferroelectric properties of intergrowth Aurivillius oxides
He Yanga,
Zezhi Chena,
Ranran Peng *ab,
Haoliang Huang
 ab,
Zhengping Fu
 ab,
Xiaofang Zhaibc and
Yalin Lu*abc
aCAS Key Laboratory of Materials for Energy Conversion, Department of Materials Science and Engineering, University of Science and Technology of China, Hefei 230026, P. R. China. E-mail: yllu@ustc.edu.cn; pengrr@ustc.edu.cn
bSynergetic Innovation Center of Quantum Information & Quantum Physics, Hefei National Laboratory for Physical Sciences at Microscale, University of Science and Technology of China, Hefei 230026, P. R. China
cNational Synchrotron Radiation Laboratory, University of Science and Technology of China, Hefei 230026, P. R. China
First published on 8th May 2018
Abstract
Aurivillius oxides with an intergrowth structures have been receiving increasing interest because of their special structures and potential outstanding ferroelectric properties. In this work, Bi3LaTiNbFeO12–Bi5Ti3FeO15 and Bi3TiNbO9–Bi3LaTiNbFeO12 compounds were successfully synthetised using a simple solid-state reaction method. X-Ray diffraction patterns and scanning transmission electron microscopy high angle annular dark field (STEM-HAADF) images confirm the 2–3 and the 3–4 intergrowth structures in Bi3TiNbO9–Bi3LaTiNbFeO12 and Bi3LaTiNbFeO12–Bi5Ti3FeO15 compounds, respectively. A superlattice-like distortion in these oxides was proposed resulting from the combination of sub-lattices with different a and b parameters, which was validated by XRD refinements and Raman spectra. Polarization-electric field tests and pulsed polarization positive-up negative-down measurements demonstrate that such superlattice-like structures can effectively enhance the intrinsic ferroelectric polarization and coercive field of these oxides, especially when compared with their component oxides Bi3TiNbO9, Bi3LaTiNbFeO12 and Bi5Ti3FeO15. Simultaneously, ferroelectric Curie temperatures of Bi3TiNbO9–Bi3LaTiNbFeO12 and Bi3LaTiNbFeO12–Bi5Ti3FeO15 oxides are lowered because of the internal stress in the superlattice-like structure. Nevertheless, the paramagnetism of the samples is hardly influenced by their structure, while mainly related to their iron content, in which iron has a similar effective magnetic moment around 3.4–3.9.
Introduction
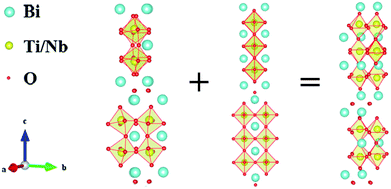
Multiferroic materials exhibiting ferroelectric (FE) and ferromagnetic (FM) properties simultaneously have drawn numerous attentions as a new type of very promising materials which could be widely applied as quantum sensors and storage mediums.1–7 Among them, Bi-containing Aurivillius compounds with the general formula of (Bi2O2)2+ (An−1BnO3n+1)2− are one of the most important branches.8–12 In these Aurivillius compounds, perovskite-like layers (An−1BnO3n+1)2− are sandwiched by fluorite-like layers (Bi2O2)2+, and it's found that the layer number, n, has a great impact on their ferroelectric (FE) and ferromagnetic (FM) properties.13,14 For example, Bi7Fe3Ti3O21 (n = 6) is paramagnetic while Bi8Fe4Ti3O24 (n = 7) is more antimagnetic. The remanent polarization (2Pr) and coercive field (2Ec) of Bi4SrTi4O15 (n = 4) are 15 μC cm−2 and 160 kV cm−1 while for Bi4Sr2Ti5O18 (n = 5), they are 22 μC cm−2 and 90 kV cm−1 at room temperature.15,16 In general, n takes an integer in these single-phase Aurivillius compounds, and very recently, an n/n + 1 intergrowth structure was observed, which made the average value of n a fraction, such as typical Bi3TiNbO9–Bi4Ti3O12 with an average n value of 2.5.17,18 Such intergrowth structures may be a new regulation approach to intensively modulate both FE and FM properties of these Aurivillius oxides.In intergrowth Aurivillius oxides, two constituent structures (generally n and n + 1) arrange alternately along the common c-axis. As shown in Fig. 1, the intergrowth structure of typical Bi3TiNbO9–Bi4Ti3O12 oxide consists of the alternating 2-layer Bi3TiNbO9 and 3-layer Bi4Ti3O12, making the average value of layer number n 2.5.17 Similar intergrowth structures have been observed in Bi2WO6–Bi3TiNbO9 (1.5 layers) and Bi4Ti3O12–Bi5Ti3FeO15 (3.5 layers) oxides, and were suggested to have positive effects on their ferroelectric properties.19–21 Nevertheless, most recent research studies on these intergrowth oxides are focused on doping various elements to intensively modify their FE/FM properties.22–26 Meanwhile the reason why the intergrowth structure can cause such attractive properties and the relationship between the intergrowth structure and their constituent homologous structures have been rarely studied.
In this work, new compounds Bi3TiNbO9–Bi3LaTiNbFeO12 and Bi3LaTiNbFeO12–Bi5Ti3FeO15 with 2.5 and 3.5 layer intergrowth structures were successfully synthesized by the solid-state reaction method. Room temperature X-ray diffraction, STEM-HAADF and Raman spectroscopy were applied to investigate their detailed lattice structure. For comparison, lattice structures of Bi3TiNbO9, Bi3LaTiNbFeO12 and Bi5Ti3FeO15 were also studied. Polarization-electric field tests and pulsed polarization positive-up negative-down measurements were used to characterize the ferroelectric and magnetic properties of the samples. Dielectric properties of the samples were measured at various frequencies and temperatures to determine their Curie temperatures. Magnetic hysteresis loops and the temperature dependence of magnetization for the samples in zero field cooling (ZFC) and field cooling (FC) modes under a magnetic field of 500 Oe were also investigated.
Experimental section
Powders of Bi3LaTiNbFeO12–Bi5Ti3FeO15 (BLTNF-3.5) with intergrowth structure were prepared by a conventional solid-state reaction. Appropriate amounts of Bi2O3 (99.99%), TiO2 (99.98%), Nb2O5 (99.5%), Fe2O3 (99.9%) and La2O3 (99.98%) were ball-mixed in agate jars for 24 hours in ethanol. Here 5% of Bi2O3 excess was adapted to compensate for the volatilization of bismuth oxide during preparation process. After drying for 24 hours, the milled powders were calcined at 950 °C for 5 h to get well crystalline. To get ceramic pellets, BLTNF-3.5 powders were cold-pressed into disks with 12 mm in diameter and 0.9 mm in thickness at a pressure of 100 MPa, and then sintered at 1150 °C for 5 h in air to get dense. Powders and ceramics of Bi3TiNbO9 (BTN-2), Bi3TiNbO9–Bi3LaleTiNbFeO12 (BLTNF-2.5), Bi3LaTiNbFeO12 (BLTNF-3) and Bi5Ti3FeO15 (BTF-4) were also prepared with similar process.X-Ray Diffraction (XRD) patterns of the synthesized powders were recorded using powder X-ray diffraction (XRD) with Cu-Kα radiation (TTR-111, Tokyo, Japan). Rietveld refinements of the XRD patterns were performed with Material Studio 6.0 program. Atomic structures were visualized by aberration corrected scanning transmission electron microscopy equipped with high angle annular dark field (STEM-HAADF, JEM-ARM200F, JEOL, Japan). Scanning electron microscopy (SEM, JSM-6400; JEOL) was applied to investigate microstructures of the fractured ceramic pellets. Transmission Electron Microscopy (TEM, JEM-2100F) and Energy Dispersive Spectroscopy (EDS) were used to determine morphology and elemental composition of BLTNF-3.5 powders. Raman spectra were characterized using a Laser Raman spectrometer with 514.5 nm line of Ar+ laser as excitation source (LabRamHr, JobinYvon, France). Magnetic properties of the samples were measured using vibrating sample magnetometer option of Quantum Design Physical Property Measurement System (PPMS-VSM, Quantum Design, San Diego, CA). For ferroelectric and dielectric measurements, ceramics were polished to pellets with 0.2 mm and 0.5 mm in thickness, respectively, and then silver was evaporated on both surfaces as electrodes. Ferroelectric measurements were made using a Precision LC ferroelectric analyser at an applied frequency of 50 Hz (Radiant Technology, Inc., Albuquerque, NM). Dielectric measurements were conducted using an impedance analyser at the frequency range of 5 kHz-1 MHz (HP4294A, Agilent Technology).
Results and discussion
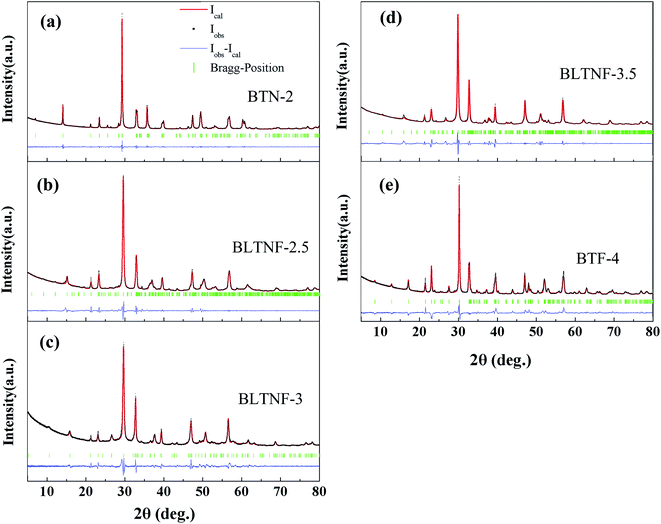
Room temperature X-ray diffraction (XRD) patterns of samples, as shown in Fig. 2, indicate the formation of Aurivillius structures for all the five samples with no secondary phase. Structures fitted from Rieveld refinements are shown in Table 1 with low Rwp obtained, indicating the correction of the fitness. As shown in Table 1, it can be clearly seen that c parameters of samples vary largely and are about 25.1132, 29.1250, 33.4223, 37.3095, and 41.2454 Å for BTN-2, BLTNF-2.5, BLTNF-3, BLTNF-3.5, and BTF-4, respectively. The in-between layer length of BLTNF-2.5 and BLTNF-3.5, when compared with those of BTN-2, BLTNF-3 and BTF-4, highly indicates the formation of intergrowth structure. Besides c parameters, a and b parameters of BLTNF-2.5 and BLTNF-3.5 differ largely from their component oxides, which have integral layers, to alternately accommodate to the difference of two constituent lattices. Such accommodation can introduce an internal stress at the interface of the two constituent lattices like that in the superlattices,27–29 which may lead to additional lattice distortion, and therefore impact the characteristics of these compounds.| Compound | Lattice parameter (Å) | Rwp | Rwp(w/o bck) | Rp | Space group | ||
|---|---|---|---|---|---|---|---|
| a | b | c | |||||
| Bi3TiNbO9 | 5.3998 | 5.4340 | 25.1132 | 5.32% | 10.68% | 3.58% | A21am |
| Bi3TiNbO9–Bi3LaTiNbFeO12 | 5.4241 | 5.4678 | 29.1250 | 6.22% | 12.46% | 3.73% | I2cm |
| Bi3LaTiNbFeO12 | 5.4675 | 5.5011 | 33.4223 | 5.83% | 15.69% | 4.05% | Fmmm |
| Bi3LaTiNbFeO12–Bi5Ti3FeO15 | 5.4459 | 5.4896 | 37.3095 | 7.68% | 17.47% | 5.36% | P21am |
| Bi5Ti3FeO15 | 5.4346 | 5.4654 | 41.2454 | 5.61% | 12.92% | 3.75% | A21am |
STEM-HAADF images of BLTNF-2.5, BLNTF-3 and BLTNF-3.5 are shown in Fig. 3 to reveal their atomic structure. Bright spots here represent Bi or La ions because their large atomic number in the compounds. For BLNTF-3, orderly structure with two loose layers (the perovskite layer) and two close layers of packing ions (fluorite layer) shows up, suggesting a well crystalline 3-layer Aurivillius structure. While for BLTNT-2.5, sandwiched by the two close layers, one and two loose layers with large layer distance arrange orderly and sequentially, indicating a 2–3 layer intergrowth structure. Similarly, a 3–4 layer intergrowth structure can be clearly observed for BLTNT-3.5. Observation of these superlattice-like intergrowth structures intensively indicates the corrections of XRD refinements.
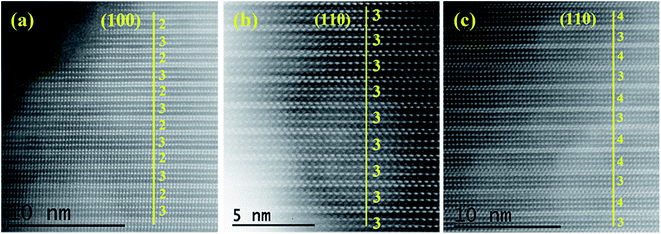 | ||
| Fig. 3 STEM-HAADF images of (a) Bi3TiNbO9–Bi3LaTiNbFeO12 (BLTNF-2.5); (b) Bi3LaTiNbFeO12 (BLTNF-3); and (c) Bi3LaTiNbFeO12–Bi5Ti3FeO15 (BLTNF-3.5). | ||
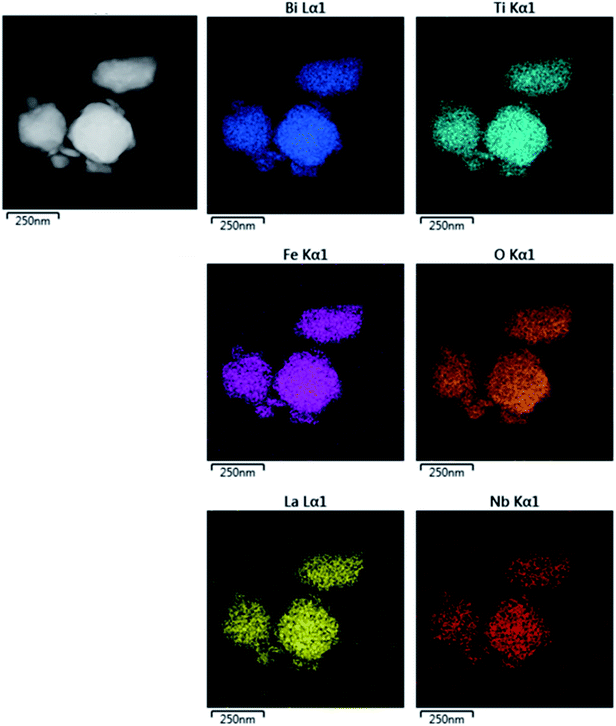
Fig. 4 shows TEM-EDS images of BLTNF-3.5. All the elements appear uniformly with no individual element enriched or lessened. This along with the XRD analysis further indicates that pure intergrowth samples can be prepared via a simple solid state reaction process.
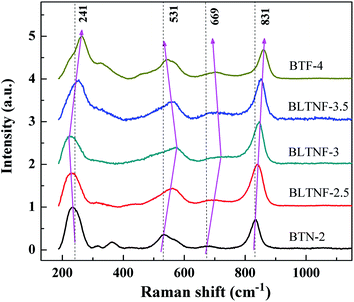
Raman spectra, as shown in Fig. 5, are made to provide some valuable information about lattice properties and structural distortions. It is generally accepted that the Raman modes below 200 cm−1, are ascribed to the vibration of Bi3+ ions, while those above 200 cm−1 respond to the motion of BO6 (B = Ti, Nb, Fe) octahedral.30,31 Yet, restricted by low test limit of spectrometer, only incomplete peaks below 200 cm−1 are gotten in this work, and therefore, we focus on the shifting tendency of modes above 200 cm−1 with respect to the layer change in samples. It has been reported that for BTN-2, the modes at 241 cm−1 represent the internal angle bending vibration of the BO6 octahedron; the modes at about 531 cm−1 correspond to the opposite excursions of the O atoms at the BO6 octahedron; the modes at about 669 cm−1 correspond to the band stretching of the BO6 octahedron; and the modes at about 831 cm−1 indicate the symmetric stretching of the BO6 (B = Ti, Nb) octahedron.30,32 With the increase of layer number, modes at 831 cm−1 shift steadily right, indicating its direct connection with the c parameter.31 Interestingly, other modes show different shift tendency: modes at 531 and 669 cm−1 shift right first and then left; while those at 221 cm−1 shift left first and then right. Compared with the parameters listed in Table 1, these vibrations seem to show large positive or negative dependence on a or b parameters. This, in a large scale, indicates the existence of a superlattice-like structure, in good agreement with the STEM-HADDF observation. And further, the lattice distortion rooting in the superlattice-like structures can be expected.
Before exploring the ferroelectric properties of the samples, SEM photos of fractured samples sintered at 1150 °C are taken as shown in Fig. 6. All the five samples are very dense with few pores detected. High densities of these samples help to rule out the current leakage via pores, and thus benefit the identification of native FE properties. Conductive properties of the samples under the applied DC electric fields are investigated at the room temperature, as shown in Fig. 6(f). Based on the linear slope of J–E curves, electrical resistivity of samples can be calculated as 2.8, 10.1, 3.4, 15.4, and 4.1 GΩ cm for BTN, BLTNF-2.5, BLTNF-3.5 and BTF-4, respectively. It can be clearly seen that BLTNF-3.5 and BLTNF-2.5 with the intergrowth structure have much higher electrical resistivity than those with integer-layer samples. This might result from the larger electron scattering because of the larger lattice distortion of the intergrowth structures.
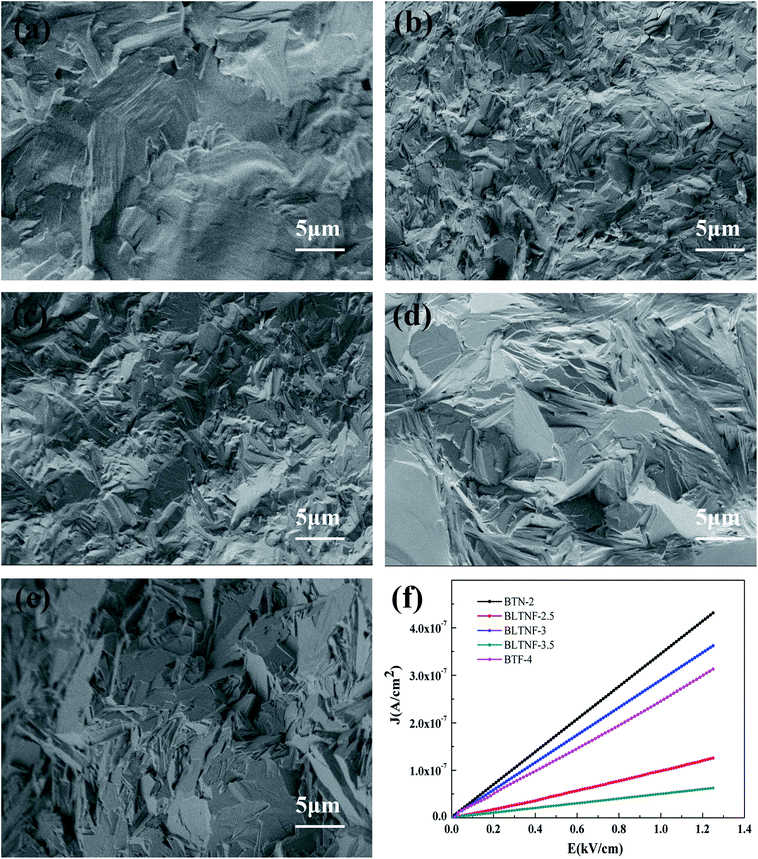 | ||
| Fig. 6 SEM micrographs of (a) BTN-2; (b) BLTNF-2.5; (c) BLTNF-3; (d) BLTNF-3.5; (e) BTF-4; (f)The J–E curve of the samples. | ||
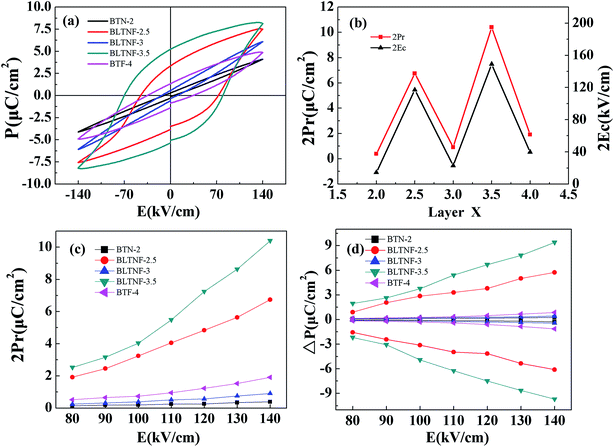
The RT P–E hysteresis loops measured at 50 Hz under different electric fields are shown in Fig. 7(a), and values of apparent remnant polarization (2Pr) and coercive field (2Ec) under the electric field 140 kV cm−1 are shown in Fig. 7(b) as function of layer numbers in these samples. Much enhanced 2Pr and 2Ec values can be clearly observed for BLTNF-2.5 and BLTNF-3.5 with the values of 6.74 and 10.40 μC cm−2 and 117, 149 kV cm−1, respectively. To identify a possible contribution from artificial polarization due to current leakage, pulsed polarization positive-up negative-down (PUND) measurements are performed, and the pulsed remnant polarizations ΔP (switched polarization-non-switched polarization) at different electric fields are shown in Fig. 7(d). Values of ΔP are very close to those of 2Pr shown in Fig. 7(c), indicating that the polarization of the samples arises mainly from their intrinsic properties.
Reasons for the high intrinsic ferroelectric performance of samples with the intergrowth phases can be attributed to their superlattice-like structure. As shown in Table 1, parameters of the constituent sublattices differ a lot from each other, especially in a and b directions. Such mismatching in sublattices will introduce a large interfacial tension in the intergrowth structure, which can result in larger BO6 octahedron distortion and Jahn–Teller distortion, and thus improve the ferroelectric polarization.
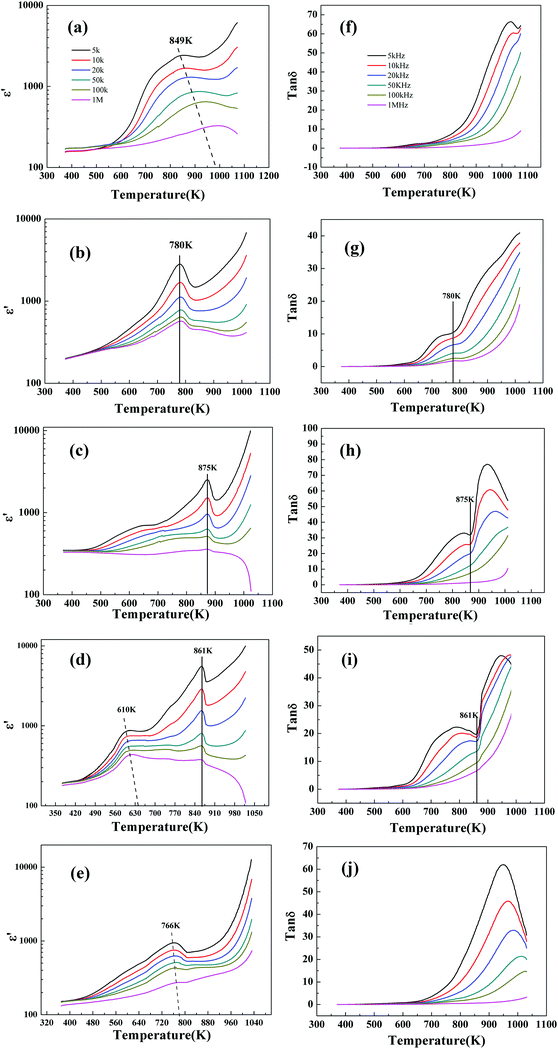
Dielectric properties of the samples measured at various frequencies under temperature 373–923 K are conducted as shown in Fig. 8 to determine the ferroelectric Curie temperature. A bump shoulder at 610 K which shifts to high temperatures at the enhanced frequencies can be observed for BLTNF-3.5. As indicated in literatures, such broad peak corresponds to the space charge polarization instead of Curie temperatures.33,34 Similar peaks are also observed for BTN-2 (849 K at 5 KHz) and BTF-4 (766 K at 5 KHz). For BLTNF-3.5, the peak corresponding to Curie temperatures locates at 861K, which doesn't shift with the testing frequencies. Similarly, high Curie temperatures can be obtained as 780 K for BLTNF-2.5 and 875 K for BLTNF-3. For BFT-4 and BTN-2, their Curie temperatures are too high to be obtained here.35,36 Dielectric loss factor of samples is also plotted in Fig. 8. Although Curie temperatures can be obtained in dielectric loss curves (as indicated by the line), peaks corresponding to space charge are invisible. Whereas, additional peaks above Curie temperatures are observed in BTN-2, BLTNF-3, BLTNF-3.5 and BTF-4 samples, corresponding to dielectric relaxation.33
It should be also noted that the samples with intergrowth structures have lower Curie temperatures when compared with those having their component lattices. Such low Curie temperature should result from the internal stress of the superlattice-like structure which lowers the phase transformation energy.
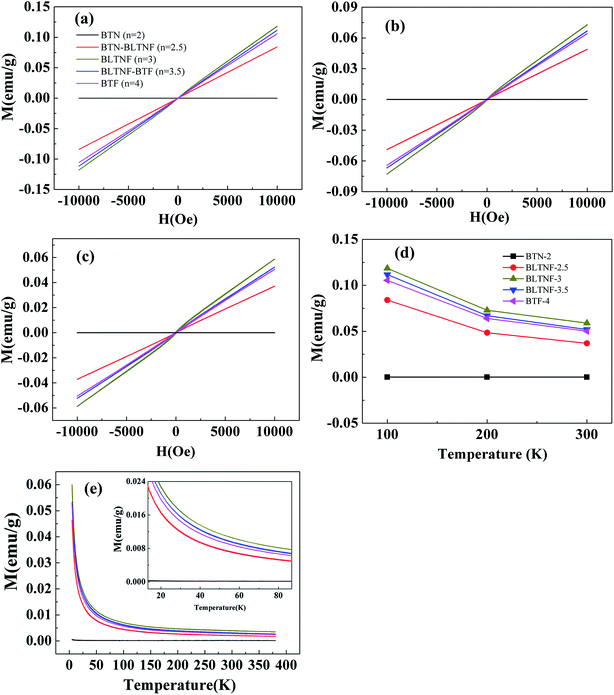
At last, we conducted a magnetic test to investigate the magnet performance. Fig. 9 shows the magnetic hysteresis loops of the samples measured at different temperatures and the temperature dependence of magnetization for the samples in zero field cooling (ZFC) and field cooling (FC) modes under a magnetic field of 500 Oe. BTN-2 shows diamagnetism character, while other samples are paramagnetic which increases with the Fe3+ contents. As indicated in Fig. 9(d), paramagnetism of samples decreases with increasing temperatures due to the disarranging of magnetic domain at high temperatures. Effective magnetic moments (Meff) of iron are calculated for each samples using the Curie–Weiss law.37 As shown in Table 2, BLTNF-2.5, BLTNF-3, BLTNF-3.5 and BFT-4 have similar effective magnetic moments around 3.45–3.85. As all known that the theoretical effective magnetic moment for iron can be calculated as 3.46 μB at low spin state and 11.83 μB at high spin state. And therefore, the iron ions in these samples are almost all at the low spin state. The slight difference here may be due to different environment of the FeO6 octahedral which has slight different crystal field splitting energy according to Jahn–Taller effect. It is also suggested that pure paramagnetic in these samples are mainly dependent on their iron contents, while hardly on their homogeneous or heterogeneous structure (intergrowth structure).
| Compound | Iron mass fraction (%) | Effective magnetic moment (μB) |
|---|---|---|
| Bi3TiNbO9 | 0 | — |
| Bi3TiNbO9–Bi3LaTiNbFeO12 | 2.703 | 3.75 |
| Bi3LaTiNbFeO12 | 4.837 | 3.58 |
| Bi3LaTiNbFeO12–Bi5Ti3FeO15 | 4.233 | 3.46 |
| Bi5Ti3FeO15 | 3.888 | 3.83 |
Conclusions
In summary, the intergrowth Aurivillius-type multiferroic oxide BLTNF-2.5 and BLTNF-3.5 were successfully synthesized via solid-state reaction method. The XRD and STEM-HADDF results proved that these oxides have a superlattice-like structure compared with their constituent oxides BTN-2, BLTNF-3 and BTF-4. Moreover, ferroelectric polarization and coercive filed of BLTNF-2.5 and BLTNF-3.5 had been greatly improved with the lower current leakage which should be attributed to their superlattice-like structure. Yet, magnetic measurements suggest that BLTNF-2.5 and BLTNF-3.5 present paramagnetic properties possessing similar effective magnetic moment with Bi3LaTiNbFeO12 and Bi5Ti3FeO15, implying that such superlattice-like structure seems to have less impact on their magnetic properties. These results might provide a new perspective for the development of the multiferroic family.Conflicts of interest
There are no conflicts to declare.Acknowledgements
This work was supported by the National Key R&D Program of China (2016YFA0401004), the Chinese Universities Scientific Fund (CUSF, WK2310000055), Anhui Provincial Natural Science Foundation (P. R. China, No. 1608085QE91), and the External Cooperation Program of BIC (Chinese Academy of Sciences, No. 211134KYSB20130017).Notes and references
- Y. Moritomo, A. Asamitsu, H. Kuwahara and Y. Tokura, Giant magnetoresistance of manganese oxides with a layered perovskite structure, Nature, 1996, 380, 141–144 CrossRef CAS.
- P. Mandal, M. Pitcher, J. Alaria, H. Niu, P. Borisov, P. Stamenov, J. Claridge and M. Rosseinsky, Designing switchable polarization and magnetization at room temperature in an oxide, Nature, 2015, 525, 363–366 CrossRef CAS PubMed.
- M. Fiebig, Revival of the magnetoelectric effect, J. Phys. D: Appl. Phys., 2005, 38, R123 CrossRef CAS.
- A. C. Garcia-Castro, A. H. Romero and E. Bousquet, Strain-Engineered Multiferroicity in Pnma NaMnF3 Fluoroperovskite, Phys. Rev. Lett., 2016, 116, 117202 CrossRef CAS PubMed.
- S. Ikegami and I. Ueda, Piezoelectricity in ceramics of ferroelectric bismuth compound with layer structure, Jpn. J. Appl. Phys., 1974, 13, 1572 CrossRef CAS.
- A. Yadav, C. Nelson, S. Hsu, Z. Hong, J. Clarkson, C. Schlepütz, A. Damodaran, P. Shafer, E. Arenholz and L. Dedon, Observation of polar vortices in oxide superlattices, Nature, 2016, 530, 198–201 CrossRef CAS PubMed.
- S. Zhang and F. Yu, Piezoelectric materials for high temperature sensors, J. Am. Ceram. Soc., 2011, 94, 3153–3170 CrossRef CAS.
- R. Singh, T. Bhimasankaram, G. Kumar and S. Suryanarayana, Dielectric and magnetoelectric properties of Bi5FeTi3O15, Solid State Commun., 1994, 91, 567–569 CrossRef CAS.
- M. Krzhizhanovskaya, S. Filatov, V. Gusarov, P. Paufler, R. Bubnova, M. Morozov and D. Meyer, Aurivillius phases in the Bi4Ti3O12/BiFeO3 system: Thermal behaviour and crystal structure, Z. Anorg. Allg. Chem., 2005, 631, 1603–1608 CrossRef CAS.
- X. Mao, W. Wang, X. Chen and Y. Lu, Multiferroic properties of layer-structured Bi5Fe0.5Co0.5Ti3O15 ceramics, Appl. Phys. Lett., 2009, 95, 082901 CrossRef.
- J. Wang, Z. Fu, R. Peng, M. Liu, S. Sun, H. Huang, L. Li, R. J. Knize and Y. Lu, Low magnetic field response single-phase multiferroics under high temperature, Mater. Horiz., 2015, 2, 232–236 RSC.
- X. Li, Z. Ju, F. Li, Y. Huang, Y. Xie, Z. Fu, R. Knize and Y. Lu, Visible light responsive Bi7Fe3Ti3O21 nanoshelf photocatalysts with ferroelectricity and ferromagnetism, J. Mater. Chem. A, 2014, 2, 13366–13372 CAS.
- B. Aurivillius, Mixed Bismuth Oxides with Layer lattices I. The structure type of CaNb2Bi2O9, Ark. Kemi, 1949, 1, 463–480 CAS.
- S. Sun, Y. Huang, G. Wang, J. Wang, Z. Fu, R. Peng, R. J. Knize and Y. Lu, Nanoscale structural modulation and enhanced room-temperature multiferroic properties, Nanoscale, 2014, 6, 13494–13500 RSC.
- G. Wang, H. Yang, J. Wang, S. Sun, Z. Fu, X. Zhai, R. Peng, R. J. Knize and Y. Lu, Engineering the exchange bias and bias temperature by modulating the spin glassy state in single phase Bi9Fe5Ti3O27, Nanoscale, 2017, 9, 8305–8313 RSC.
- J. Zhu, W.-P. Lu, X.-Y. Mao, R. Hui and X.-B. Chen, Study on properties of lanthanum doped SrBi4Ti4O15 and Sr2Bi4Ti5O18 ferroelectric ceramics, Jpn. J. Appl. Phys., 2003, 42, 5165 CrossRef CAS.
- D. Mercurio, G. Trolliard, T. Hansen and J. Mercurio, Crystal structure of the ferroelectric mixed Aurivillius phase Bi7Ti4NbO21, Int. J. Inorg. Mater., 2000, 2, 397–406 CrossRef CAS.
- Z. Yi, Y. Wang, Y. Li and Q. Yin, Ferroelectricity in intergrowth Bi3TiNbO9–Bi4Ti3O12 ceramics, J. Appl. Phys., 2006, 99, 114101 CrossRef.
- Z. Yi, Y. Li, Z. Wen, S. Wang, J. Zeng and Q. Yin, Intergrowth Bi2WO6–Bi3TiNbO9 ferroelectrics with high ionic conductivity, Appl. Phys. Lett., 2005, 86, 192906 CrossRef.
- I. Ismailzade, V. Nesterenko, F. Mirishli and P. Rustamov, X-Ray and electrical studies of system Bi4Ti3O12-BiFeO3, Soviet Physics - Crystallography, 1967, 12, 400–405 Search PubMed.
- S. Nakashima, H. Fujisawa, S. Ichikawa, J. M. Park, T. Kanashima, M. Okuyama and M. Shimizu, Structural and ferroelectric properties of epitaxial Bi5Ti3FeO15 and natural-superlattice-structured Bi4Ti3O2–Bi5Ti3FeO15 thin films, J. Appl. Phys., 2010, 108, 074106 CrossRef.
- X. Gao, H. Gu, Y.-X. Li, Z.-G. Yi, M. Čeh and K. Žagar, Structural evolution of the intergrowth bismuth-layered Bi7Ti4NbO21, J. Mater. Sci., 2011, 46, 5423–5431 CrossRef CAS.
- H. Ogawa, D. Iida, S. Takahashi, T. Moriyama and A. Kan, Ferroelectric properties and crystal structure of mixed-layer Bi7-xSrxTi4Nb1-xWxO21 ceramics, Ferroelectrics, 2016, 498, 1–11 CrossRef CAS.
- X. Tian, S. Qu, B. Wang, H. Du and Z. Xu, Intergrowth Bismuth Layer-Structured Na0.5Bi2.5Nb2O9–Bi4Ti3O12 High Temperature Ferroelectrics Ceramics, J. Inorg. Organomet. Polym. Mater., 2014, 24, 355–359 CrossRef CAS.
- H. Zou, J. Li, Q. Cao, X. Wang, X. Hui, Y. Li, Y. Yu and X. Yao, Intensive up-conversion photoluminescence of Er3+-doped Bi7Ti4NbO21 ferroelectric ceramics and its temperature sensing, J. Adv. Dielectr., 2014, 4, 1450028 CrossRef CAS.
- H. Zhang, H. Yan and M. J. Reece, High temperature lead-free relaxor ferroelectric: Intergrowth Aurivillius phase BaBi2Nb2O9–Bi4Ti3O12 ceramics, J. Appl. Phys., 2010, 107, 104111 CrossRef.
- K. J. Choi, M. Biegalski, Y. Li, A. Sharan, J. Schubert, R. Uecker, P. Reiche, Y. Chen, X. Pan and V. Gopalan, Enhancement of ferroelectricity in strained BaTiO3 thin films, Science, 2004, 306, 1005–1009 CrossRef CAS PubMed.
- J. Junquera and P. Ghosez, Critical thickness for ferroelectricity in perovskite ultrathin films, Nature, 2003, 422, 506–509 CrossRef CAS PubMed.
- L. W. Martin and A. M. Rappe, Thin-film ferroelectric materials and their applications, Nat. Rev. Mater., 2016, 2, 16087 CrossRef.
- S. Kojima, R. Imaizumi, S. Hamazaki and M. Takashige, Raman scattering study of bismuth layer-structure ferroelectrics, Jpn. J. Appl. Phys., 1994, 33, 5559 CrossRef CAS.
- P. Graves, G. Hua, S. Myhra and J. Thompson, The Raman modes of the Aurivillius phases: temperature and polarization dependence, J. Solid State Chem., 1995, 114, 112–122 CrossRef CAS.
- Y. Du, M. Zhang, Q. Chen, Z. Yuan, Z. Yin and Q. Zhang, Size effect and evidence of a size-driven phase transition in Bi4Ti3O12 nanocrystals, Solid State Commun., 2002, 124, 113–118 CrossRef CAS.
- J. Yang, L. Yin, Z. Liu, X. Zhu, W. Song, J. Dai, Z. Yang and Y. Sun, Magnetic and dielectric properties of Aurivillius phase Bi6Fe2Ti3O18 and the doped compounds, Appl. Phys. Lett., 2012, 101, 012402 CrossRef.
- A. Srinivas, M. M. Kumar, S. Suryanarayana and T. Bhimasankaram, Investigation of dielectric and magnetic nature of Bi7Fe3Ti3O21, Mater. Res. Bull., 1999, 34, 989–996 CrossRef CAS.
- A. Moure and L. Pardo, Microstructure and texture dependence of the dielectric anomalies and dc conductivity of Bi3TiNbO9 ferroelectric ceramics, J. Appl. Phys., 2005, 97, 084103 CrossRef.
- X. Mao, W. Wang, H. Sun, Y. Lu and X. Chen, Influence of different synthesizing steps on the multiferroic properties of Bi5Fe1Ti3O15 and Bi5Fe0.5Co0.5Ti3O15 ceramics, J. Mater. Sci., 2012, 47, 2960–2965 CrossRef CAS.
- X. Zuo, M. Zhang, E. He, B. Guan, Y. Qin, J. Yang, X. Zhu and J. Dai, Structural, magnetic, and dielectric properties of W/Cr co-substituted Aurivillius Bi5FeTi3O15, J. Alloys Compd., 2017, 726, 1040–1046 CrossRef CAS.
| This journal is © The Royal Society of Chemistry 2018 |

![[thin space (1/6-em)]](https://www.rsc.org/images/entities/char_2009.gif)
