 Open Access Article
Enhancing the low temperature NH3-SCR activity of FeTiOx catalysts via Cu doping: a combination of experimental and theoretical study†
Kai Cheng‡
ab,
Weiyu Song‡a,
Ying Chenga,
Huiling Zhenga,
Lu Wanga,
Jian Liu *a,
Zhen Zhao
 a and
Yuechang Weia
aState Key Laboratory of Heavy Oil Processing, China University of Petroleum, 18# Fuxue Road, Chang Ping District, Beijing, 102249, China. E-mail: liujian@cup.edu.cn; Fax: +86-10-69724721; Tel: +86-10-89732326
bDepartment of Mechanical and Automation Engineering, The Chinese University of Hong Kong, New Territories, Hong Kong SAR, Shatin, China
First published on 24th May 2018
Abstract
A series of FeαCu1−αTiOx catalysts with variable Cu doping amounts was directly synthesized by the sol–gel method and their catalytic performances were tested for the selective catalytic reduction of NO with ammonia. The highest activity was achieved on Fe0.9Cu0.1Ti catalyst. NO conversion was above 80% and N2 selectivity exceeded 90% on this catalyst in the temperature range of 200–375 °C. High NO and NH3 oxidation activities facilitated the high NH3-SCR activities of the catalysts in the low temperature range, while too strong NH3 oxidation ability resulted in the decline of NH3-SCR activity. DFT calculations based on the Fe and Cu co-doping TiO2 model showed that the barrier of NH3 activation is dramatically reduced as compared to pure Fe doping. This is due to the lowered p-band of lattice O. However, such activated O will also strongly decrease the barrier for the dissociation of NH2 to NH species, which will lead to the formation of N2O. Both Brønsted and Lewis acid sites over Fe0.9Cu0.1Ti catalyst are involved in the NH3-SCR reaction. The adsorption of NOx is strong in the low temperature range, and large amounts of nitrates were decomposed on the catalyst surface in the high temperature range.
1. Introduction
Fast urbanization and the rapid development of industry have caused serious air pollution and stringent regulations are being released with growing environmental awareness. It is generally considered that air pollution is predominantly from the combustion processes of fossil fuels in power plants, vehicles and other incineration processes. Among various air contaminants, nitrogen oxides (NOx) are notable and are known as the major causes of photochemical smog, haze, acid rain, ozone depletion and the greenhouse effect. Selective catalytic reduction of NOx with NH3 (NH3-SCR) is a powerful technique for the abatement of NOx from stationary sources. WO3 (MoO3) modified V2O5/TiO2 are the current commercially used catalysts for NH3-SCR in industry. However, some disadvantages still exist in these catalyst systems, including high working temperature, toxicity of vanadium species and low N2 selectivity at high temperatures. Therefore, many researchers are trying to develop new NH3-SCR catalysts with high deNOx efficiency, high N2 selectivity, excellent hydrothermal stability and insensitivity to co-existing poisoning components in the SCR atmosphere, such as H2O, SO2 or alkali metals.1–3Recently, Fe-based catalysts have attracted much attention for the SCR reaction.4–6 For example, FeTiOx catalyst is more active than crystalline Fe2O3 and TiO2. The active iron titanate crystallites in FeTiOx catalyst prepared at low calcination temperature were mainly in the form of a specific edge-shared Fe3+–(O)2–Ti4+ structure. However, the catalytic activity of FeTiOx catalyst is low at low temperature.7–10 It is essential to enhance the low-temperature SCR activity of FeTiOx catalyst. Among the alternatives of active components examined for the low-temperature SCR reaction, copper has been widely explored owing to its efficacy and relatively low cost.11–14 It is well known that the SCR performance of catalysts depends on the dispersion, nuclearity and oxidation state of the active components, which could be efficiently controlled by the preparation method.15,16
In the present work, a series of FeαCu1−αTiOx catalysts with variable Cu doping amounts was directly synthesized by the sol–gel method and applied in the NH3-SCR process. The obtained Fe0.9Cu0.1TiOx catalysts exhibited excellent SCR activity. Based on this result, the effects of Cu substitution amounts on the structure, acidity and redox properties of the FeαCu1−αTiOx catalysts were also studied. The reactivity of surface-adsorbed NH3 and NOx species on the Fe0.9Cu0.1TiOx catalysts was investigated using in situ diffused reflectance infrared Fourier transformed spectroscopy (DRIFTS) technique.
2. Experimental and computational details
2.1. Catalyst preparation
FeαCu1−αTiOx catalysts were prepared by the sol–gel method. All chemicals used were of analytical grade. A solution of 34 ml of butyl titanate (Sinopharm Chemical Reagent Co., Ltd, ≥98.0%) and 136 ml of anhydrous ethanol (Sinopharm Chemical Reagent Co., Ltd, ≥99.7%) was added dropwise to another solution of 34 ml of deionized water, 34 ml of anhydrous ethanol, 6.8 ml of nitric acid (Sinopharm Chemical Reagent Co., Ltd, 65.0–68.0%) and a certain amount of ferric nitrate (Sinopharm Chemical Reagent Co., Ltd, ≥98.0%) and copper nitrate (Sinopharm Chemical Reagent Co., Ltd, ≥98.0%) at room temperature under vigorous stirring to carry out hydrolysis. After continuously stirring for 3 h, the yellowish transparent sol was yielded. Subsequently, the sol was dried at 80 °C for 24 h to form a xerogel. After being crushed and sieved through a 60–100 mesh, the xerogel was calcinated at 500 °C for 5 h in air. The catalysts were denoted as FeαCu1−αTiOx, where α represents the molar ratio of n(Fe)/n(Fe + Cu).2.2. Physical and chemical characterization
The crystal structures of the fresh catalysts were determined with a powder X-ray diffractometer using Cu Kα (λ = 0.1542 nm) radiation combined with a nickel filter operating at 40 kV and 10 Ma (Shimadzu, Japan). The diffractometer data were recorded for 2θ values from 10° to 80° at a scanning rate of 4° min−1. The patterns were compared with ICDD files for phase identification.The Brunauer–Emmett–Teller (BET) surface areas were measured by N2 adsorption and desorption (Quantachrome Instruments, USA). The samples were degassed at 200 °C for 12 h.
TEM images were obtained using a JEOL JEM 2100 electron microscope equipped with a field emission source at an accelerating voltage of 200 kV. Drops of the suspension were applied and, after drying, the fine particles were well dispersed on a copper grid coated with carbon. The elemental local mapping was acquired by energy-dispersive spectroscopy (EDS) using a Tecnai F20 electron microscope equipped with a STEM unit and a CCD detector.
X-ray photoelectron spectroscopy (XPS) spectra were recorded with a standard AlK source (1486.6 eV) working at 350 W (XSAM800, Kratos Analytical Ltd, UK). The working pressure was less than 2 × 10⁻⁷ Pa. The spectrometer was calibrated by assuming the binding energy (BE) of the Au 4f7/2 line to lie at 84.0 eV with respect to the Fermi energy level. The binding energies of Ce 3d and O 1s were calibrated using the C 1s peak (BE = 284.8 eV) as the standard.
Temperature-programmed reduction with H2 (H2-TPR) experiments were performed using a Quantachrome Instruments Autosorb IQ. A 100 mg sample was pretreated under Ar by calcination at 300 °C for 1 h and subsequently cooled to 30 °C. Afterwards, 10% H2/Ar flow (60 ml min−1) was passed over the catalyst bed while the temperature was ramped from 30 to 800 °C at a heating rate of 10 °C min−1.
The nature of the acid sites of the catalysts was determined by pyridine-IR (Py-IR) on a Magna IR 560 FT-IR instrument with a resolution of 4 cm−1. The samples were dehydrated at 500 °C for 5 h under a vacuum of 1.33 × 10⁻³ Pa, followed by the adsorption of purified pyridine vapor at room temperature for 20 min. The system was then degassed and evacuated at different temperatures, and Py-IR spectra were recorded.
In situ DRIFTS spectra were recorded using a thermo Nicolet IS50 spectrometer, which was equipped with a high-temperature environmental cell fitted with a ZnSe window and an MCT detector cooled with liquid N2. The catalyst was loaded in the Harrick IR cell and heated to 400 °C under N2 at a total flow rate of 50 ml min−1 for 60 min to remove adsorbed impurities. A background spectrum was collected under a flowing N2 atmosphere and was subtracted from the sample spectra. The DRIFTS spectra were recorded by accumulating 32 scans with a resolution of 4 cm−1.
2.3. Activity measurements
The activity tests of the various catalysts for the NH3-SCR of NO were carried out in a fixed bed quartz reactor (i.d. 6 mm). The feed gas mixture consisted of 1000 ppm of NO, 1000 ppm of NH3, 3 vol% of O2 and Ar-balanced gas. A total flow rate of 500 ml min−1 was maintained for all experiments. The concentrations of NO in the inlet and outlet gas were measured by a flue gas analyzer (Model-4000VM, SIGNAL International Ltd., UK). Meanwhile, the concentrations of NH3, NO, NO2 and N2O were measured by an FTIR spectrometer (Nicolet IS50). All catalysts were kept on stream at each temperature for 30 min. NO conversion was defined as follows:
 | (1) |
N2 selectivity in the SCR reaction was calculated from eqn (2).
 | (2) |
2.4. Computational details
In this work, the Vienna ab initio simulation package (VASP)17,18 was used to calculate all states with the electron exchange correlation effect described by the Perdew–Burke–Ernzerhof functional within the generalized gradient approximation (GGA-PBE).19 The calculations involved on-site Coulomb corrections20 (DFT+U, Ueff = 4.2 eV for Ti 3d states, 6.0 eV for Cu 3d state, 4.5 eV for Mn 3d states). The spin-polarized calculations were performed. PAW pseudopotential was used to describe the core–valence electron interaction.21 A plane-wave basis set with an energy cutoff of 400 eV was used in this work. The climbing nudged elastic band method (CI-NEB)22,23 was employed to locate the transition states. The anatase TiO2 (101) surface was presented by a six-layer slab model with a vacuum gap of 15 Å. For all the surface calculations, the model was a periodic slab with a (2 × 2) surface unit cell. A Monkhorst pack 2 × 2 × 1 k-point mesh was used for the Brillouin zone integration. During structural optimizations, all of the atoms except those in the bottom two TiO2 layers of the slab were allowed to relax until atom forces were smaller than 0.05 eV Å−1. Adsorption energy was calculated using the following expression: Ead = Etot − Eslab − Ex. Etot is the total energy of the combined system with the adsorbate X bound to the slab, Eslab is the energy of the slab alone, and Ex is the energy of the adsorbate in the gas phase. According to this definition, exothermic adsorption results in a negative value of Ead.3. Results and discussion
3.1. SCR performance
Fig. 1 shows the NH3-SCR performance as a function of temperature on the FeαCu1−αTiOx catalysts with GHSV = 50![[thin space (1/6-em)]](https://www.rsc.org/images/entities/char_2009.gif) 000 h−1. The FeTiOx catalyst showed very narrow operation temperature windows, and 80% NO conversion was obtained at a higher temperature of 275 °C. The temperature at which NO conversion exceeded 80% decreased to 255 °C for Fe0.95Cu0.05TiOx and about 150 °C for CuTiOx. The temperature range for optimum NO reduction (>80%) extends toward lower temperatures. Thus, copper oxide plays an important role in the low-temperature NH3-SCR reaction.16 Among these catalysts, the Fe0.9Cu0.1TiOx catalyst with the molar ratio of Fe
000 h−1. The FeTiOx catalyst showed very narrow operation temperature windows, and 80% NO conversion was obtained at a higher temperature of 275 °C. The temperature at which NO conversion exceeded 80% decreased to 255 °C for Fe0.95Cu0.05TiOx and about 150 °C for CuTiOx. The temperature range for optimum NO reduction (>80%) extends toward lower temperatures. Thus, copper oxide plays an important role in the low-temperature NH3-SCR reaction.16 Among these catalysts, the Fe0.9Cu0.1TiOx catalyst with the molar ratio of Fe![[thin space (1/6-em)]](https://www.rsc.org/images/entities/char_2009.gif) :
:![[thin space (1/6-em)]](https://www.rsc.org/images/entities/char_2009.gif) Cu = 9
Cu = 9![[thin space (1/6-em)]](https://www.rsc.org/images/entities/char_2009.gif) :
:![[thin space (1/6-em)]](https://www.rsc.org/images/entities/char_2009.gif) 1 showed the best activity with NO conversion above 80% from 200 °C to 375 °C. Comparatively, the maximal NO conversion on CuTiOx only reached 89%, indicating that CuOx addition can remarkably enhance the low-temperature NH3-SCR activity of FeTiOx catalysts and broaden the temperature window for NO conversion.
1 showed the best activity with NO conversion above 80% from 200 °C to 375 °C. Comparatively, the maximal NO conversion on CuTiOx only reached 89%, indicating that CuOx addition can remarkably enhance the low-temperature NH3-SCR activity of FeTiOx catalysts and broaden the temperature window for NO conversion.
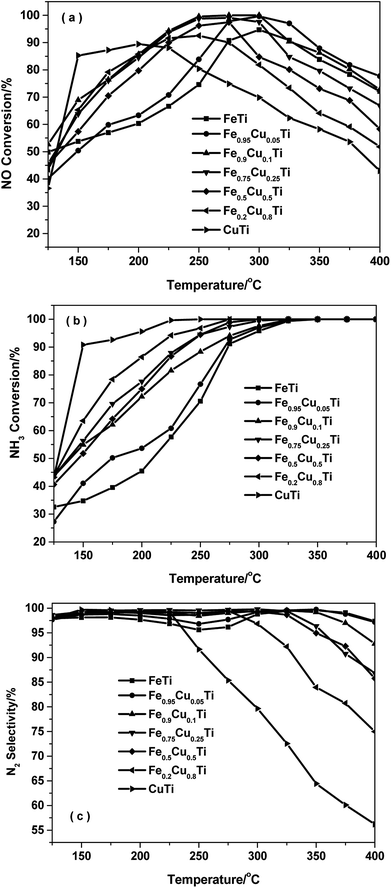 | ||
Fig. 1 NH3-SCR performance as a function of temperature on FeαCu1−αTiOx catalysts with GHSV = 50![[thin space (1/6-em)]](https://www.rsc.org/images/entities/char_2009.gif) 000 h−1. (a) NO conversion, (b) NH3 conversion and (c) N2 selectivity. 000 h−1. (a) NO conversion, (b) NH3 conversion and (c) N2 selectivity. | ||
Fig. 1b shows the NH3 conversion as a function of temperature over various catalysts during the NH3-SCR reaction. The NH3 conversion monotonously increased with increasing of the Cu doping amount in the FeαCu1−αTiOx catalysts. At a temperature of 150 °C the CuTiOx catalysts gave an ammonia conversion above 80% and this was maintained above 90% in the temperature range of 200–400 °C. The results indicate that gaseous NH3 is activated more easily on Cu-containing catalysts, thus the Cu-containing catalysts showed better low-temperature activity than FeTiOx catalysts.
DFT calculations were then performed to gain a better understanding of the role of doping Cu in enhancing the reactivity. As shown in Fig. S1,† NH3 adsorbs on the Cu–Fe–TiO2 surface with an adsorption energy of −0.92 eV, 0.08 eV stronger than that on the Fe–TiO2 surface. This suggests that Cu doping can slightly enhance NH3 adsorption. As shown in previous studies, the dissociation of adsorbing NH3 is the rate-limiting step of the NH3-SCR reaction.24–26 The activation barrier of this step was calculated on the two comparative models (Fe–Cu–TiO2 and Fe–TiO2). The H of adsorbed NH3 can be dissociated to surface O atom to form NH2 species with an energy barrier of 0.64 eV, which is 0.71 eV lower than that on Fe–TiO2. The lower energy barrier of NH3 dissociation indicates higher SCR activity, consistent with the experimental results. The calculated density of states (DOS) (Fig. 2a) shows that the energy level of the conduction band of the active O p on Cu–Fe–TiO2 is lower than that on Fe–TiO2. This is owing to the strong interaction between Cu d bands and the O p band, which strongly changed the electron state of the neighboring O atom (Fig. 2b). From the electronic point of view, the essence of NH3 dissociation with one H to the lattice O involves one electron being added to the conduction band of the O p orbital. The lower the conduction band, the easier the process. This explains the calculated lower energy barrier.
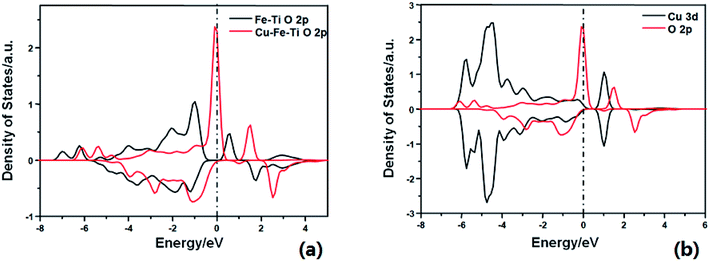 | ||
| Fig. 2 Calculated projected density of states for (a) O 2p on Fe–TiO2 surface (black) and Cu–Fe–TiO2 surface (red); (b) Cu 3d (black) and O 2p (red) on Cu–Fe–TiO2 surface. | ||
Fig. 1c shows the N2 selectivity for the NH3-SCR of NO over FeαCu1−αTiOx catalysts. Although the substitution of Fe by Cu in iron titanate catalyst could enhance the low-temperature SCR activity, the N2 selectivity had an obvious decrease owing to the production of N2O with the increasing of the Cu molar amount, especially at high temperatures above 250 °C. The further dissociation of NH2 to NH will lead to the formation of N2O. The calculated energy barrier is 0.76 eV for this step on Fe–Cu– TiO2, which is 0.38 eV lower than NH2 dissociation on Fe–TiO2. This explains the experimental result that the N2 selectivity had an obvious decrease owing to the production of N2O on the Cu–Fe–TiO2 catalyst.
3.2. NH3 and NO oxidation activities of FeαCu1−αTiOx catalysts
A previous study13 showed that the N2 selectivity in the SCR reaction had a strong inverse correlation with the oxidation of NH3, therefore separate NH3 oxidation experiments were also conducted over FeαCu1−αTiOx catalysts. As shown in Fig. 3, the NH3 conversions had an obvious enhancement with the increasing of Cu substitution amounts, and the highest NH3 conversions were obtained over the CuTiOx catalyst. However, the N2 selectivity showed an obvious decrease in NH3 oxidation reactions at the same time, which is in accordance with the changing trend of N2 selectivity in the SCR reaction. This implies that although the NO oxidation activity is enhanced when Fe is partially substituted by Cu, which is beneficial to the promotion of SCR activity, the unselective oxidation of NH3 to N2O, NO or NO2 in the SCR conditions is also enhanced, resulting in the production of a large amount of by-products. There should be a compromise between the SCR activity and N2 selectivity when we determine on the Cu substitution amount in practical applications.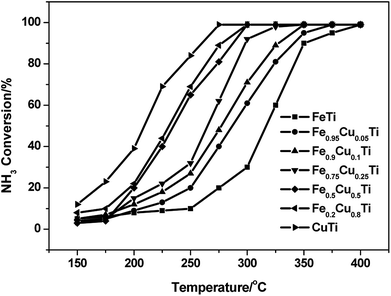 | ||
Fig. 3 NH3 oxidation profile of FeαCu1−αTiOx catalysts. Reaction conditions: [NH3] = 1000 ppm, [O2] = 3%, balance N2 and GHSV = 50![[thin space (1/6-em)]](https://www.rsc.org/images/entities/char_2009.gif) 000 h−1. 000 h−1. | ||
It was reported that the enhancement of NO oxidation to NO2 over SCR catalysts could significantly promote the low-temperature activity owing to the occurrence of “fast SCR”: 4NH3 + 2NO + 2NO2 + O2 → 4N2 + 6H2O.27–29 The effect of NO2 and the detailed “fast SCR” reaction mechanism have been studied extensively over conventional V2O5–WO3/TiO2 and Fe–zeolite catalysts (such as Fe/HBEA and Fe/ZSM-5) by many researchers. In this study, the effect of Cu substitution amounts on the NO oxidation activity of iron titanate catalysts was also investigated and the results are shown in Fig. 4. With the increasing of Cu substitution amounts, the NO conversion to NO2 showed an obvious enhancement, and the maximum conversions were obtained over CuTiOx catalyst. Although the NO oxidation activity of CuTiOx was higher than that of Fe0.9Cu0.1TiOx, the SCR activity over the former catalyst was still much lower than that over the latter one, as shown in Fig. 4. This implies that the SCR activity over CuTiOx catalyst is not just related to the NO oxidation activity.
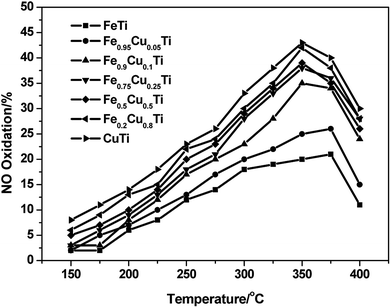 | ||
Fig. 4 NO oxidation profile of FeαCu1−αTiOx catalysts. Reaction conditions: [NO] = 1000 ppm, [O2] = 3%, balance N2 and GHSV = 50![[thin space (1/6-em)]](https://www.rsc.org/images/entities/char_2009.gif) 000 h−1. 000 h−1. | ||
3.3. XRD results
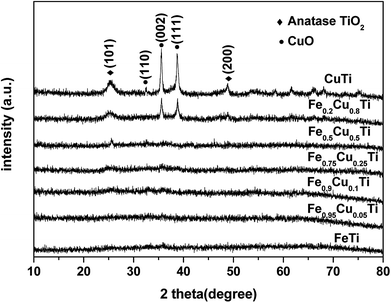
Powder XRD patterns of FeαCu1−αTiOx catalysts are shown in Fig. 5. FeTiOx catalyst showed no obvious sharp diffraction peaks besides some broad bumps, implying that this catalyst was mainly in the form of amorphous iron titanate, which were thought to be the real active phases. With the increasing of Cu molar amount from 0 to 0.25, XRD patterns of FeαCu1−αTiOx catalysts exhibited no significant variation, indicating that these samples were still in an amorphous state. The part substitution of Fe by Cu did not destroy the catalyst structures. However, when Cu substitution amounts increased to above 0.25, TiO2 and CuO phase peak appeared, which indicated that the amorphous state structure was destroyed. The negligible effect of increasing Cu amount above 0.25 on the SCR activity is related to this change.3.4. BET results
Fig. S2† shows the nitrogen adsorption–desorption isotherms and the corresponding pore size distribution curves of the FeαCu1−αTiOx catalysts. The isotherms for the FeαCu1−αTiOx catalysts are similar to typical type IV isotherms, which are characteristic of mesoporous materials. In the diameter range below 3 nm, the adsorbed volume on the Fe0.9Cu0.1TiOx catalyst was highest among all catalysts. This means that the Fe0.9Cu0.1Ti sample included the most abundant micropores or mesopores, which can supply a greater inner surface area for the occurrence of the SCR reaction. The BET surface areas in Table 1 also followed such a sequence, which is in good agreement with the sequence of SCR activity. The Fe0.9Cu0.1Ti catalyst exhibited the largest BET surface area, which is beneficial to the NH3-SCR process.| Samples | SBET (m2 g−1) | Vmic (cm2 g−1) | Average pore diameter (nm) |
|---|---|---|---|
| FeTiOx | 185.2 | 0.30 | 4.6 |
| Fe0.95Cu0.05TiOx | 187.0 | 0.27 | 4.3 |
| Fe0.9Cu0.1TiOx | 244.5 | 0.27 | 5.1 |
| Fe0.75Cu0.25TiOx | 121.2 | 0.23 | 5.1 |
| Fe0.5Cu0.5TiOx | 128.1 | 0.23 | 4.8 |
| Fe0.2Cu0.8TiOx | 104.7 | 0.21 | 5.2 |
| CuTiOx | 89.1 | 0.20 | 5.9 |
3.5. TEM results
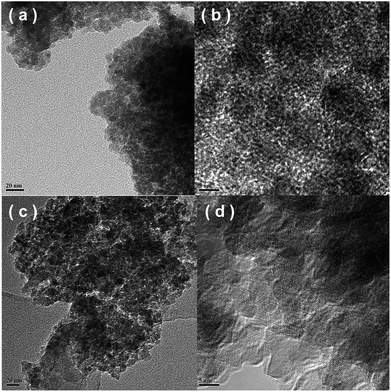
Fig. 6 shows the TEM/HRTEM images of the Fe0.9Cu0.1Ti and Fe0.5Cu0.5Ti catalysts. Both catalysts were made of nanoparticles in the size range of 15–30 nm, as shown in Fig. 6a and c. For the Fe0.9Cu0.1Ti catalyst, no interplanar distances of Fe2O3, CuO and TiO2 were seen on the surface of the catalyst. This suggests the formation of the homogeneous phase of Fe2O3, CuO and TiO2, which is consistent with the XRD results. For the Fe0.5Cu0.5Ti catalyst, two phases with the interplanar spacing are shown in Fig. 6d, corresponding to the interplanar distances of CuO and TiO2 planes, respectively. The results mean that the amorphous state structure was destroyed on the Fe0.5Cu0.5Ti catalyst.3.6. Py-IR results
FTIR spectroscopy of adsorbed pyridine was performed to study the acid properties of the FeTiOx and Fe0.9Cu0.1TiOx samples. As shown in Fig. 7, the bands located at 1540 and 1640 cm−1 are assigned to pyridinium ions adsorbed on Brønsted sites. The bands located at 1440, 1455 and 1630 cm−1 are due to pyridinium ions adsorbed on Lewis sites. Brønsted and Lewis acid sites were observed in both FeTiOx and Fe0.9Cu0.1TiOx catalysts, where Lewis acid sites prevail over Brønsted acid sites at 200 °C. When the adsorption temperature was increased to 350 °C, the intensities of the Lewis and Brønsted peaks decreased. It can be seen that Lewis and Brønsted acid sites are more abundant in the Fe0.9Cu0.1TiOx catalyst than in the FeTiOx catalyst. The more Lewis acid sites over the Fe0.9Cu0.1TiOx catalyst would not be attributed to the addition of Cu substance with abundant Lewis acid sites, but the changes in catalyst structure and electron charge density caused by the generation of Ti–O–Fe mixed bonds. It has been reported that the acid sites may interact with the active components, and therefore inhibit the agglomeration of the active components. Moreover, the increasing of Lewis acid sites would promote the SCR performance by enhancing the activation of NH3.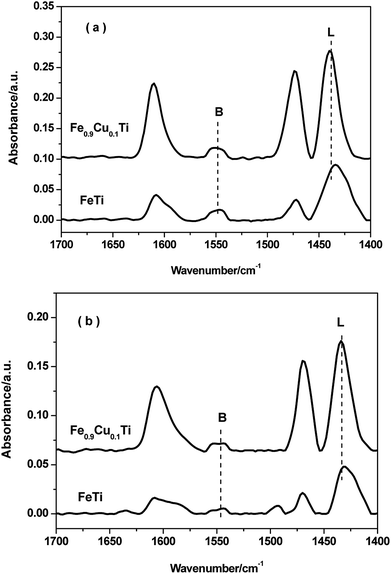 | ||
| Fig. 7 FT-IR spectra of pyridine adsorbed on FeTiOx and Fe0.9Cu0.1TiOx after degassing at 200 °C and 350 °C. | ||
3.7. XPS results
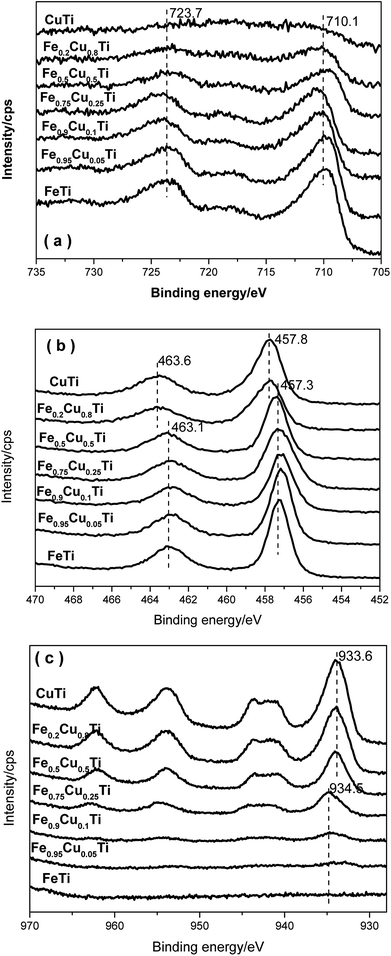
Fig. 8a shows the XPS results for Fe 2p. Two characteristic peaks ascribed to Fe 2p3/2 at 710.1 eV and Fe 2p1/2 at 723.7 eV appeared for each Fe-containing sample, indicating that the iron species in these samples are in the Fe3+ oxidation state. With the increasing of Cu substitution amounts, the intensities of the Fe 2p3/2 and Fe 2p1/2 peaks gradually decreased owing to the concentration reduction of surface iron species. However, the corresponding binding energies do not show variation, implying that the differences in the SCR over these catalysts are not caused by the redox ability after changing the iron species state.Fig. 8b shows the XPS spectra of Ti 2p in all catalysts. Two characteristic peaks at ca. 457.3 and 463.1 eV appear with the increasing of the Cu molar content from 0 to 0.5, which are assigned to Ti 2p3/2 and Ti 2p1/2. On further increasing the Cu doping amount, the binding energies of Ti 2p3/2 and Ti 2p1/2 in relevant samples are shifted toward higher BE by 0.5 eV. Combined with the XRD results, this phenomenon may be due to the phase transformation.
Fig. 8c shows XPS spectra of Cu 2p in all catalysts. The Cu 2p3/2 signal is composed of two peaks at 933.6 eV and 934.5 eV, where the former is assigned to the presence of CuO species30,31 and the latter to Cu2+ species. Cu2+ species are detected when the Cu doping amount is below 0.25. Further increasing the Cu doping amount to above 0.25, the catalysts are in the CuO phase. It indicates that the Cu2+ species transform to the CuO phase when the Cu substitution amount increases to above 0.25. This result is also consistent with the XRD results. CuO could accelerate NH3 oxidation and, as a result, the transformation of Cu species from Cu2+ to CuO would cause the decrease of the selectivity of the FeαCu1−αTiOx catalysts.
3.8. In situ DRIFTS studies
4. Conclusions
A series of FeαCu1−αTiOx catalysts with variable Cu doping amounts was directly synthesized by the sol–gel method, and their catalytic performances were tested for the selective catalytic reduction of NO with ammonia. The partial substitution of Fe by Cu could significantly promote the SCR activity of iron titanate catalysts, especially in the low temperature range. The highest activity was achieved on Fe0.9Cu0.1Ti catalyst. NO conversion was above 80% and N2 selectivity exceeded 90% on this catalyst in the temperature range of 200–375 °C. However, the N2 selectivity showed an obvious decrease with the increasing of Cu substitution amounts, and there should be a compromise between the SCR activity and N2 selectivity when we determine the Cu substitution amount in practical industrial applications.High NO and NH3 oxidation activities facilitated the high NH3-SCR activities of the catalysts in the low-temperature range, while too strong NH3 oxidation ability resulted in the decline of NH3-SCR activity. DFT calculations show that the barrier of NH3 activation is dramatically reduced with the doping of both Cu and Fe owing to the lowered p-band of lattice O. However, such activated O will also strongly decrease the barrier for the dissociation of NH2 to NH species, which will lead to the formation of N2O and, accordingly, the decrease of N2 selectivity.
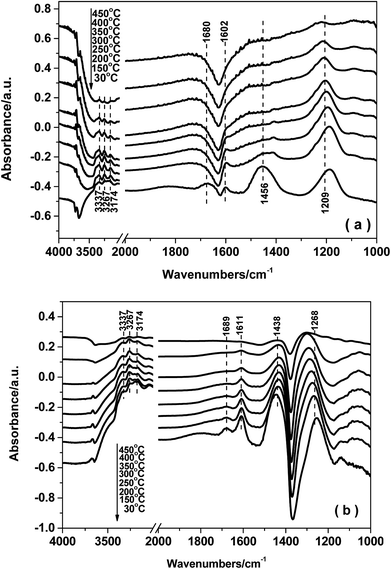
The reaction mechanism for NH3-SCR over the Fe0.9Cu0.1TiOx catalyst was studied by means of in situ DRIFT spectroscopy. The results demonstrated that both Brønsted and Lewis acid sites over Fe0.9Cu0.1Ti catalyst were active in the NH3-SCR reaction. On the one hand, NOx adspecies were easily adsorbed at low temperature on the Fe0.9Cu0.1TiOx catalyst, which were beneficial to the NH3-SCR process at low temperature via the L–H mechanism. On the other hand, the adsorption of nitrate species was decomposed at high temperature, leading to more active sites available for the adsorption and activation of NH3. Thus a higher catalytic activity was obtained.
Conflicts of interest
There are no conflicts to declare.Acknowledgements
This work was financially supported by the National Natural Science Foundation of China (21376261, 21173270, 21503273), 863 Program (2015AA034603), Scientific Research Foundation of China University of Petroleum Beijing (2462015YJRC005).References
- R. M. Heck, Catal. Today, 1999, 53, 519–523 CrossRef.
- V. Parvulescu, P. Grange and B. Delmon, Catal. Today, 1998, 46, 233–316 CrossRef.
- A. Fritz and V. Pitchon, Appl. Catal., B, 1997, 13, 1–25 CrossRef.
- Z. Ren, Y. Teng, L. Zhao and R. Wang, Catal. Today, 2017, 297, 36–45 CrossRef.
- J. Liu, J. Meeprasert, S. Namuangruk, K. Zha, H. Li, L. Huang, P. Maitarad, L. Shi and D. Zhang, J. Phys. Chem. C, 2017, 121, 4970–4979 Search PubMed.
- Z. Fan, J. W. Shi, C. Gao, G. Gao, B. Wang and C. Niu, ACS Appl. Mater. Interfaces, 2017, 9, 16117–16127 Search PubMed.
- F. Liu, H. He and C. Zhang, Chem. Commun., 2008, 17, 2043–2045 RSC.
- F. Liu, H. He, C. Zhang, Z. Feng, L. Zhao, Y. Xie and T. Hu, Appl. Catal., B, 2010, 96, 408–420 CrossRef.
- F. Liu, K. Asakura, H. He, Y. Liu, W. Shan, X. Shi and C. Zhang, Catal. Today, 2011, 164, 520–527 CrossRef.
- F. Liu, K. Asakura, P. Xie, J. Wang and H. He, Catal. Today, 2013, 201, 131–138 CrossRef.
- F. Nakajima and I. Hamada, Catal. Today, 1996, 29, 109–115 CrossRef.
- X. Li, G. Lu, Z. Qu, D. Zhang and S. Liu, Appl. Catal., A, 2011, 398, 82–87 CrossRef.
- S. Roy, B. Viswanath, M. S. Hegde and G. Madres, J. Phys. Chem. C, 2008, 398, 6002–6012 Search PubMed.
- D. Pietrogiacomi, A. Magliano, D. Sannino, M. C. Campa, P. Ciambelli and V. Indovina, Appl. Catal., B, 2005, 60, 83–92 CrossRef.
- T. Boningari, R. Koirala and P. G. Smirniotis, Appl. Catal., B, 2014, 127, 255–264 CrossRef.
- C. Sun, Z. Jie, Y. Lv, L. Qi, B. Liu, F. Gao, K. Sun, L. Dong and Y. Chen, Appl. Catal., B, 2011, 103, 206–220 CrossRef.
- G. Kresse and J. Furthmüller, Phys. Rev. B: Condens. Matter Mater. Phys., 1996, 54, 11169–11186 CrossRef.
- G. Kresse and J. Furthmüller, Comput. Mater. Sci., 1996, 6, 15–50 CrossRef.
- J. Perdew, K. Burke and M. Ernzerhof, Phys. Rev. Lett., 1996, 77, 3865–3868 CrossRef PubMed.
- S. L. Dudarev, S. Y. Savrasov, C. J. Humphreys and A. P. Sutton, Phys. Rev. B: Condens. Matter Mater. Phys., 1998, 57, 1505–1509 CrossRef.
- P. E. Blöchl, Phys. Rev. B: Condens. Matter Mater. Phys., 1994, 50, 17953–17979 CrossRef.
- G. Henkelman, B. P. Uberuaga and H. Jónsson, J. Chem. Phys., 2000, 113, 9901 CrossRef.
- G. Henkelman and H. Jónsson, J. Chem. Phys., 2000, 113, 9978 CrossRef.
- W. Song, J. Liu, H. Zheng, S. Ma, Y. Wei, A. Duan, G. Jiang, Z. Zhao and E. J. Hensen, Catal. Sci. Technol., 2016, 6, 2120–2128 Search PubMed.
- X. Yao, L. Zhang, L. Li, L. Liu, Y. Cao, X. Dong, F. Gao, Y. Deng, C. Tang and Z. Chen, Appl. Catal., B, 2014, 150, 315–329 CrossRef.
- Y. Li, J. Deng, W. Song, J. Liu, Z. Zhao, M. Gao, Y. Wei and L. Zhao, J. Phys. Chem. C, 2016, 120, 14669–14680 Search PubMed.
- G. Qi and R. T. Yang, Appl. Catal., B, 2003, 44, 217–225 CrossRef.
- G. Madia, M. Koebel, A. Martin Elsener and A. Wolkaun, Ind. Eng. Chem. Res., 2002, 15, 3512–3517 CrossRef.
- R. Q. Long and R. T. Yang, J. Catal., 2001, 198, 20–28 CrossRef.
- G. Lu, X. Li, Z. Qu, Q. Zhao, L. Zhao and G. Chen, Chem. Eng. J., 2011, 168, 1128–1133 CrossRef.
- T. Zhang, J. Liu, D. Wang, Z. Zhao, Y. Wei, K. Cheng, G. Jiang and A. Duan, Appl. Catal., B, 2014, 148–149, 520–531 CrossRef.
- P. G. Smirniotis, D. A. Pena and B. S. Uphade, Angew. Chem., Int. Ed., 2001, 40, 2479–2482 CrossRef PubMed.
- L. Lietti, I. Nova, G. Ramis, L. DallAcqua, G. Busca, E. Giamello, P. Forzatti and F. Bregani, J. Catal., 1999, 187, 419–435 CrossRef.
- S. Guerrero, I. Guzmán, G. Aguila and A. Paulo, Catal. Commun., 2009, 11, 38–42 CrossRef.
- M. Kantcheva, Appl. Catal., B, 2003, 42, 89–109 CrossRef.
Footnotes |
| † Electronic supplementary information (ESI) available. See DOI: 10.1039/c8ra02931h |
| ‡ The two authors contribute equally to this work. |
| This journal is © The Royal Society of Chemistry 2018 |

