 Open Access Article
The crystallization kinetics of Co doping on Ni–Mn–Sn magnetic shape memory alloy thin films
Changlong Tan*a,
Jiachen Zhu a,
Zhenhua Wang
 a,
Kun Zhang
 a,
XiaoHua Tiana and
Wei Caib
aSchool of Science, Harbin University of Science and Technology, Harbin 150080, China. E-mail: changlongtan@hrbust.edu.cn
bSchool of Materials Science and Engineering, Harbin Institute of Technology, Harbin 150001, China
First published on 18th July 2018
Abstract
Co doping is an effective means to improve the performance of Ni–Mn–Sn alloy bulks and thin films. However, the Co doping effect on the crystallization process of the Ni–Mn–Sn alloy thin films is important but not clear. Therefore, we investigate the influence of Co doping on the crystallization kinetics for Ni50Mn37−xSn13Cox (x = 0, 0.5, 1.5, 4) magnetic shape memory alloy thin films by DSC analysis. For the non-isothermal process, each DSC curve has a single exothermic peak, which is asymmetrical. The crystallization peak temperatures and the activation energy of thin films both rise gradually with increasing Co content. Then, the activation energy of Ni50Mn37−xSn13Cox (x = 0, 0.5, 1.5, 4) thin films obtained by the Kissinger equation method is determined as 157.9 kJ mol−1, 198.8 kJ mol−1, 213 kJ mol−1 and 253.6 kJ mol−1, respectively. The local activation energy of thin films with different Co content show the different variation tendency. In the isothermal crystallization, the average of the Avrami exponent n for thin films of each Co content is approximately 1.5, suggesting that the mechanism of crystallization is two-dimensional diffusion-controlled growth for Ni50Mn37−xSn13Cox (x = 0, 0.5, 1.5, 4) thin films.
1. Introduction
The Ni–Mn–Sn magnetic shape memory alloys (MSMAs) have recently attracted considerable attention due to their unique properties and potential applications.1–5 Researchers seek to add a fourth element to enhance the properties of Ni–Mn–Sn MSMAs, and it is found that Co addition has been shown to have an outstanding effect on the performance of Ni–Mn–Sn MSMAs, such as the magnetocaloric effect, magnetoresistance effect and elastocaloric effect.6–9 Previously, Kainuma et al. obtained a huge magnetic-field-induced shape recovery strain of about 1.0% in the Ni–Co–Mn–Sn polycrystalline alloy, and it accompanied reverse martensitic transformation.10 Some researchers also reported that the Co-doped in Ni–Mn–Sn alloys are an effective way to enhance the difference in magnetization between the martensite phase and austenite phase.11–13 Recently, Cong et al. established the complete phase diagram of Ni50−xCoxMn39Sn11 alloys.14Different from the bulk materials, the applications of Ni–Mn–Sn based alloys in micro-devices such as actuators, sensors, magnetic cooling, hybrid systems and magnetic driven micro-electromechanical systems (MEMS) need high quality thin films and even free-standing thin films.15–17 Modak et al. have reported that refrigeration capacity (RC) and magnetic entropy change (ΔSm) increased by Co addition in Ni–Mn–Sn thin films.18 Ramudu et al. found a relatively large exchange bias effect (EBE) in Ni–Mn–Sn–Co thin films.19 So far, Ni–Mn–Sn–Co alloy thin films are well studied and they can be properly used in the above-mentioned applications.
As we know, Ni–Mn–Sn based alloy thin films that prepared by magnetic sputtering at room temperature are usually amorphous alloys, which are at as-deposited state.20–22 The shape memory effect, magnetocaloric effect and other significant properties cannot exhibit in the amorphous Ni–Mn–Sn based thin films. Therefore, it is a precondition that crystalline state of alloy thin films for investigating their properties and considering their practical application. Furthermore, the crystallization behavior exhibits the compositional sensitivity.21 However, the influence of Co content on the crystallization behavior of Ni–Mn–Sn thin films is still unknown. Therefore, it is essential to investigate the effect of Co doping on the crystallization kinetics of Ni–Mn–Sn free-standing magnetic shape memory alloy thin films, which can be the foundation of following research.
In this study, for the first time, we focus on the influence of Co doping on the crystallization kinetics of Ni50Mn37−xSn13Cox (x = 0, 0.5, 1.5, 4) free-standing magnetic shape memory alloy thin films. Non-isothermal crystallization and isothermal crystallization of alloy thin films have been researched by Perkin-Elmer differential scanning calorimetric (DSC). In non-isothermal process, every DSC curve has one exothermic peak. The crystallization peak temperatures and activation energy of the Ni–Mn–Sn–Co thin films both rise gradually with increasing Co content. The local activation energy of thin films with different Co content show the different variation tendency. In the isothermal crystallization, the average of Avrami exponent n for thin films of each Co content are approximate 1.5, suggesting that the mechanism of crystallization is two-dimensional diffusion-controlled growth for Ni50Mn37−xSn13Cox (x = 0, 0.5, 1.5, 4) thin films. This study can elucidate the influence of Co content on the crystallization kinetics of Ni–Mn–Sn magnetic shape memory alloy thin films and provide guidance for designing and annealing process of thin films.
2. Experimental
The photoresist was deposited on silicon (100) substrate by spinning, and Ni–Mn–Sn–Co alloy thin films is deposited on photoresist and silicon substrate by dc magnetron sputtering from the Ni50Mn37Sn13 sputtering target after setting working (Ar) gas pressure at 1.5 × 10⁻³ mbar and sputtering power at 100 W for 2 hours. Co is doped in the thin films by symmetrically placing Co wire on the Ni–Mn–Sn target. Later, the photoresist thin film is separated by acetone. The elemental composition of the Ni–Mn–Sn–Co free-standing thin films detected by energy dispersive X-ray analysis is found to be Ni50Mn37−xSn13Cox (x = 0, 0.5, 1.5, 4). The crystallization of thin films are determined by the Rigaku D/max-rb rotating anode X-ray diffraction meter (XRD) using Cu K radiation at room temperature. The microstructure of thin films is determined by atomic force microscope (AFM). Non-isothermal and isothermal crystallization of amorphous Ni–Mn–Sn–Co free-standing thin films samples are carried out on diamond differential scanning calorimetry (Diamond DSC, Perkin-Elmer). In the non-isothermal heating, a set of DSC plots is investigated at the heating rates of 10 K min−1, 20 K min−1, 30 K min−1, 40 K min−1 and 60 K min−1. In the isothermal analysis, the amorphous samples are firstly heated at a rate of 100 K min−1 to a fixed temperature (20 K below the crystallization temperature), then heated to the crystallization temperature at 20 K min−1, finally held temperature for a few minutes, until completion of crystallization.3. Results and discussion
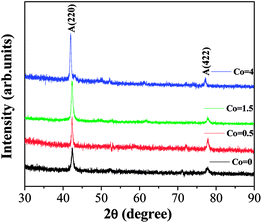
Fig. 1 shows the room-temperature X-ray diffraction (XRD) patterns of Ni50Mn37−xSn13Cox (x = 0, 0.5, 1.5, 4) thin films after isothermal process. It is clear that all thin films show a typical diffraction cubic austenitic structure (L21), and the super lattice reflections such as the A(220) and A(422) peaks are observed.23 It is also found that the super lattice reflections peaks of thin films has no significant difference with the increasing Co content, which is rather similar to the Ni50Mn37−xCoxSn13 reported by Yang.24 The compositions of Ni50Mn37−xSn13Cox (x = 0, 0.5, 1.5, 4) thin films determined by EDX analysis were shown in Table 1.| Samples | Ni (at%) | Mn (at%) | Sn (at%) | Co (at%) |
|---|---|---|---|---|
| Co-0 | 50.05 | 36.93 | 13.02 | 0 |
| Co-0.5 | 50.11 | 36.55 | 12.83 | 0.51 |
| Co-1.5 | 49.96 | 35.41 | 13.11 | 1.52 |
| Co-4 | 50.07 | 33.03 | 12.94 | 3.96 |
Fig. 2 shows the microstructure of annealed Ni50Mn37−xSn13Cox (x = 0, 0.5, 1.5, 4) thin films determined by AFM. The size of selected area is 1 μm × 1 μm. The surface morphology of thin films is composed of defined grains, which demonstrate the thin films have fully crystallized. It can be clearly seen that the grain size decreases gradually with increasing Co content. In Fig. 2, it is found that the grains are unevenly distributed. This is because the motion of sputtering particles is uncontrollable, particles are randomly sputtered onto the substrate. The inset of Fig. 2 is the microstructure of as-deposited Ni50Mn37Sn13 thin films shows disordered structure without any grains. It indicates that the as-deposited Ni50Mn37Sn13 thin films are amorphous alloys.
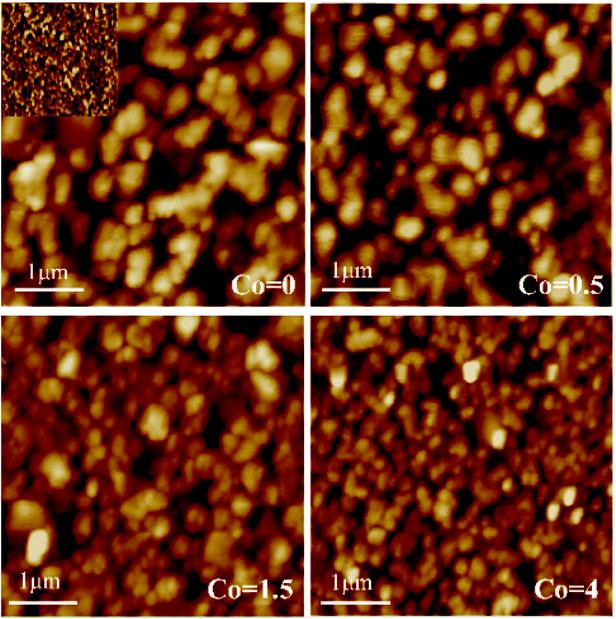 | ||
| Fig. 2 AFM images of annealed Ni50Mn37−xSn13Cox (x = 0, 0.5, 1.5, 4) thin films, the inset is AFM image of as-deposited Ni50Mn37Sn13 thin films. | ||
Fig. 3 shows the DSC curves of Ni50Mn37−xSn13Cox (x = 0, 0.5, 1.5, 4) thin films obtained from the heating rates of 10 K min−1, 20 K min−1, 30 K min−1, 40 K min−1 and 60 K min−1 in non-isothermal crystallization. Each DSC curve has a single exothermic peak, indicating that the occurrence of one-step crystallization. The exothermal peaks with different Co content are all moved to higher temperatures gradually with increasing heating rates. This manifests that the crystallization behavior is in a marked kinetic nature.25–27 The values of the onset of crystallization temperature Tx and the crystallization peak temperature Tp for the different heating rates of samples are given in Table 2. It is found that the Tp are significantly shifted to higher temperatures with increasing Co content from Table 1. For example, the crystallization peak temperatures are determined at 542 K, 562.7 K, 568.7 K and 574.2 K at the heating rates of 40 K min−1, respectively. This can be attributed to the grain refinement effect of Ni–Mn–Sn films.28 From Fig. 2, the grain size of Ni–Mn–Sn–Co thin films decreases gradually with increasing Co content, which means the grain boundaries of thin films increase with increasing Co content. The plenty of grain boundaries can act as potential barriers. They separate the individual grains, and limit movement of atomics, thereby imposing constraints on the nucleation and growth of crystallization process, such as crystallographic symmetry.29 Thus, the crystallization peak temperatures Tp rise gradually with increasing Co content.
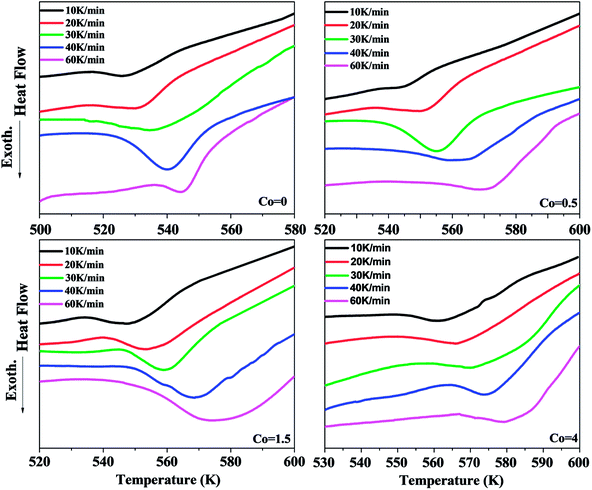 | ||
| Fig. 3 DSC curves of Ni50Mn37−xSn13Cox (x = 0, 0.5, 1.5, 4) thin films obtained from different heating rates, respectively. | ||
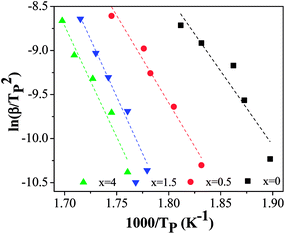
In the cause of further confirming the effects of Co addition on the crystallization kinetics of thin films, the activation energy of crystallization Ec is calculated. The Ec can be determined by the Kissinger equation:30
| ln(β/T2p) = −Ec/RTp + constants | (1) |
Fig. 5 shows the plots of the relation between temperature and crystallized volume fraction of Ni50Mn37−xSn13Cox (x = 0, 0.5, 1.5, 4) magnetic shape memory alloy thin films at different heating rates severally. It is found that temperature-crystallized volume fraction curves are mainly sigmoid curves in each Co content. It indicates that crystallization process of Ni50Mn37−xSn13Cox (x = 0, 0.5, 1.5, 4) thin films are not surface crystallization but bulk crystallization.33 As shown in Fig. 5, the curves shift to the higher temperature gradually with the increase of Co content.
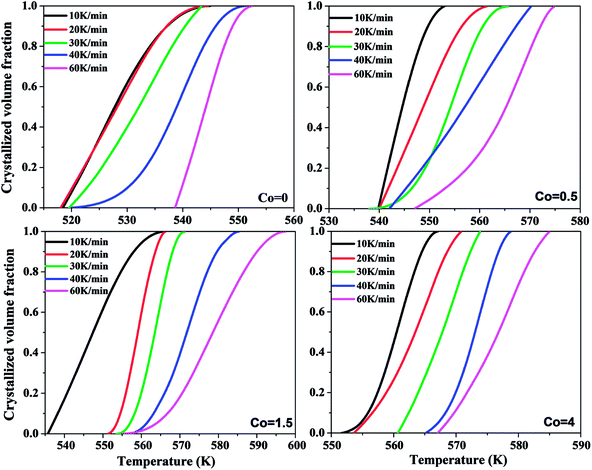 | ||
| Fig. 5 Plots of the relation between crystallized volume fraction and temperature of Ni50Mn37−xSn13Cox (x = 0, 0.5, 1.5, 4) thin films. | ||
The activation energy obtained from Kissinger equation is apparent activation energy. The apparent activation energy represent the average of activation energy in the whole crystallization process. The activation energy is diverse because the different stages of crystallization have the different mechanism of nucleation and growth. Thus, for purpose of reflecting the change of activation energy, it is essential to investigate the local activation energy. Therefore, the local activation energy of Ni50Mn37−xSn13Cox (x = 0, 0.5, 1.5, 4) free-standing thin films are calculated by Doyle method. Its relation is34
 | (2) |
Fig. 6 shows the local activation energy Ec(α) versus the crystallized volume fraction α of the Ni50Mn37−xSn13Cox (x = 0, 0.5, 1.5, 4) free-standing thin films. From Fig. 5, we can found that the Ec(α) of thin films with different Co content show the different variation tendency. As Co = 0, Ec(α) increase with increasing crystallized volume fraction. As Co = 0.5 and 1.5, Ec(α) decrease with increasing crystallized volume fraction. As Co = 4, Ec(α) basically remains at 250 kJ mol−1. It indicates that the α has obvious influence on the variation of Ec(α), and the crystallization mechanism of Ni50Mn37−xSn13Cox (x = 0, 0.5, 1.5, 4) thin films changed constantly. The average of local activation energy with each Co content calculated by Doyle method is close to the apparent activation energy obtained from Kissinger's equation, indicating that the activation energy calculated by two methods have little error.
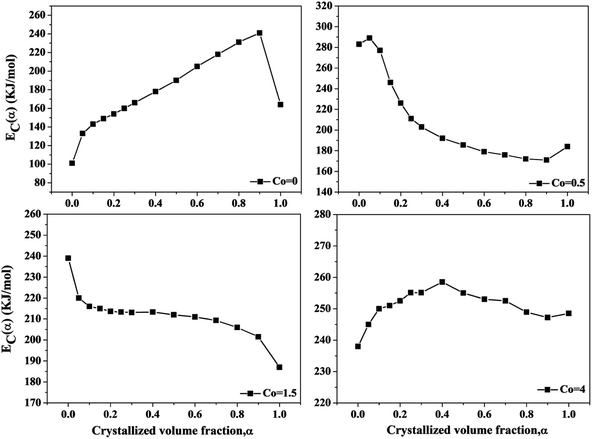 | ||
| Fig. 6 The local activation energy versus the crystallized volume fraction α of Ni50Mn37−xSn13Cox (x = 0, 0.5, 1.5, 4) thin films. | ||
In order to investigate the effect of Co content on the nucleation and growth of crystallization process, the isothermal crystallization process of Ni50Mn37−xSn13Cox (x = 0, 0.5, 1.5, 4) magnetic shape memory alloy thin films were also observed. Fig. 7 shows a set of the isothermal DSC curves of Ni50Mn37−xSn13Cox (x = 0, 0.5, 1.5, 4) thin films at each corresponding temperatures, respectively. The isothermal crystallization temperature of thin films with each Co content are selected below the non-isothermal crystallization temperature at 10 K min−1 with each corresponding Co content, in order to ensure the completion of full crystallization. The single exothermic peaks of all DSC curves appeared after passing a certain incubation time. The incubation time decreases with increasing isothermal temperature. It implies that the crystallization process is influenced by the isothermal temperatures.21
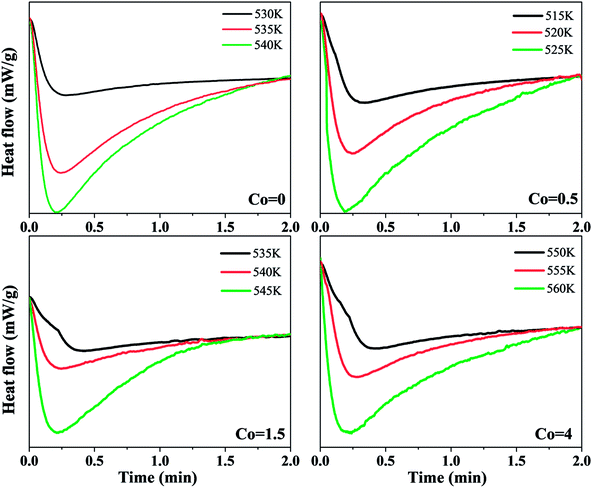 | ||
| Fig. 7 Isothermal DSC curves of Ni50Mn37−xSn13Cox (x = 0, 0.5, 1.5, 4) thin films at different temperatures. | ||
In order to reveal the crystallization mechanism of Ni50Mn37−xSn13Cox (x = 0, 0.5, 1.5, 4) free-standing thin films, the plots of crystallized volume fraction-isothermal time for Ni50Mn37−xSn13Cox (x = 0, 0.5, 1.5, 4) thin films in isothermal crystallization are shown in Fig. 8. From Fig. 8, almost all curves are sigmoidal. Then, crystallization kinetics can be analyzed by the theoretical Johnson–Mehl–Avrami (JMA) equations:35
ln[−ln(1 − x)] = n![[thin space (1/6-em)]](https://www.rsc.org/images/entities/char_2009.gif) ln ln![[thin space (1/6-em)]](https://www.rsc.org/images/entities/char_2009.gif) k + n k + n![[thin space (1/6-em)]](https://www.rsc.org/images/entities/char_2009.gif) ln(t − τ) ln(t − τ)
| (3) |
 | (4) |
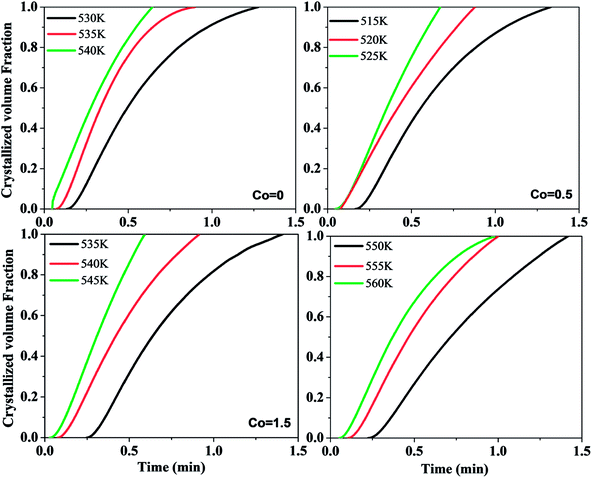 | ||
| Fig. 8 Plots of crystallized volume fraction–time curves for Ni50Mn37−xSn13Cox (x = 0, 0.5, 1.5, 4) thin films in isothermal crystallization. | ||
Fig. 9 shows the plots of ln[ln(1/1 − x)] versus ln(t − τ) at corresponding temperature of Ni50Mn37−xSn13Cox (x = 0, 0.5, 1.5, 4) free-standing thin films. Evidently, the data of ln[ln(1/1 − x)] versus ln(t − τ) are approximate to straight lines, and the value of Avrami exponent n could be obtained from the slope in Fig. 9. The data of 5% < x < 90% are almost on a straight line, a slight deviation in linearity can be put down to the non-steady nucleation in the final stage of crystallization.26 The Avrami exponents at different temperatures are shown in Table 3. The Avrami exponents n for all Ni50Mn37−xSn13Cox (x = 0, 0.5, 1.5, 4) thin films are mainly in the range of 1.3 to 1.6. Averaging the n of each Co content respectively, the average of Avrami exponent for each Co content are all nearly 1.5. On the basis of the relation between the crystallization mechanism of nucleation and growth and Avrami exponent n in isothermal conditions,35–38 it can be found that the main mechanism of nucleation and growth for Ni50Mn37−xSn13Cox (x = 0, 0.5, 1.5, 4) thin films are all diffusion-controlled two-dimensional growth. Co content has a small influence on the crystallization mechanism of Ni50Mn37−xSn13Cox (x = 0, 0.5, 1.5, 4) free-standing thin films.
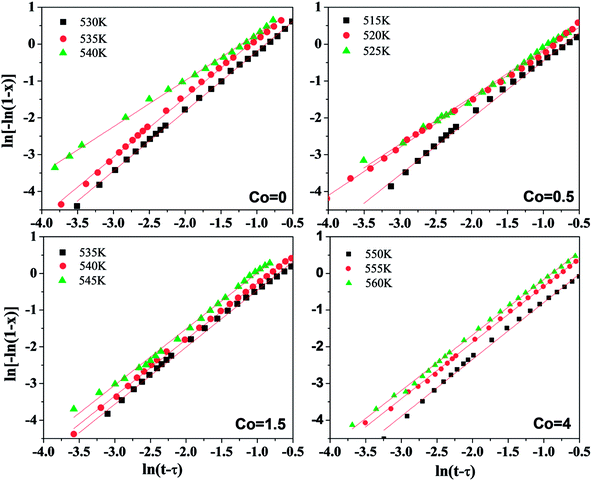 | ||
| Fig. 9 The JMA plots for the isothermal crystallization of the Ni50Mn37−xSn13Cox (x = 0, 0.5, 1.5, 4) thin films at different crystallization temperatures. | ||
| Heating rates (K min−1) | Co0 | Co0.5 | Co1.5 | Co4 | ||||
|---|---|---|---|---|---|---|---|---|
| Tx (K) | Tp (K) | Tx (K) | Tp (K) | Tx (K) | Tp (K) | Tx (K) | Tp (K) | |
| 10 | 519 | 525.8 | 539 | 545.8 | 535 | 547 | 551 | 561 |
| 20 | 517 | 531.1 | 537 | 551.7 | 541 | 553.7 | 553 | 566.4 |
| 30 | 514 | 535.1 | 538 | 555.3 | 545 | 559 | 554 | 570 |
| 40 | 518 | 540 | 539 | 562.7 | 548 | 568.7 | 565 | 574.2 |
| 60 | 535 | 544.8 | 539 | 569.2 | 543 | 575.7 | 566 | 579.1 |
| Avrami exponent n | |||
|---|---|---|---|
| Co0 | Co0.5 | Co1.5 | Co4 |
| 1.62 | 1.59 | 1.56 | 1.55 |
| 1.42 | 1.39 | 1.53 | 1.52 |
| 1.26 | 1.28 | 1.50 | 1.51 |
Moreover, we have a discussion about the process of nucleation. Firstly, the alloy nucleates by diffusion-control near the small number of clusters that formed during the formation of amorphous structures preferentially at a certain temperature. With the increase of temperature or the extension of time, the small clusters formed by a large number of atoms nucleates by diffusion-control successively. The small clusters that near the preferential-formed nucleus grow up gradually, until all grains form and end up with colliding with each other.
Fig. 10 shows the plot of lnk vs. 1000/T of Ni50Mn37−xSn13Cox thin films for isothermal crystallization process. According to eqn (4), the activation energy EA can be calculated by the slope of lnk vs. 1000/T. With increase of Co content, the EA is 152.3 kJ mol−1, 171.3 kJ mol−1, 220.2 kJ mol−1 and 229.8 kJ mol−1, respectively. These values of EA obtained by JMA equation are close to the Ec calculated from Kissinger equations, implying that the mechanism of two crystallization methods are similar for Ni50Mn37−xSn13Cox (x = 0, 0.5, 1.5, 4) thin films.
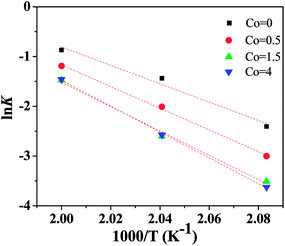 | ||
| Fig. 10 Plot of lnk vs. 1000/T of Ni50Mn37−xSn13Cox (x = 0, 0.5, 1.5, 4) thin films for isothermal crystallization process. | ||
The crystallization process can exhibit different nucleation and growth behavior at different stages. Thus, in order to study the details of crystallization mechanism, it is essential to investigate the local Avrami exponent of crystallization process. Radlinski and Calka have suggested an analysis method for isothermal DSC, which can obtain the local Avrami exponent n(x) with crystallized volume fraction x efficiently.39 The local Avrami exponent n(x) can be calculated by the following equation:
 | (5) |
Fig. 11 shows the local Avrami exponents n(x) versus crystallized volume fraction x at different temperatures of Ni50Mn37−xSn13Cox (x = 0, 0.5, 1.5, 4) thin films. It can be seen that the change of local Avrami exponents n(x) with different Co content is roughly similar. They all first decrease, then tend to be flat, and rise rapidly in the end. It implies that the change in Co content has a small influence on the crystallization mechanism of Ni50Mn37−xSn13Cox (x = 0, 0.5, 1.5, 4) thin films. The local Avrami exponent n ≈ 2 in the beginning, and decreased from 2 to 1.5 in the range of 0 < x < 0.2. Then, the local Avrami exponent stays around 1.5 in the range of 0.2 < x < 0.8. Finally, the local Avrami exponent quick rises to 3 in the range of 0.8 < x < 1. Therefore, the crystallization process is divided into three stages approximately: in the first stage that x ranges from 0 to 0.2, implying the mechanism of nucleation and growth is diffusion-controlled two-dimensional growth, and the nucleation rate decreased in this stage. x ranges from 0.2 to 0.8 in the second stage, implying that the crystallization mechanism is diffusion-controlled two-dimensional growth, and the nucleation rate is zero. x ranges from 0.8 to 1 in the third stage, implying that the crystallization mechanism is diffusion-controlled three-dimensional growth, and the nucleation rate increases. The variation of local Avrami exponents n(x) demonstrates that the mechanism of nucleation and growth for Ni50Mn37−xSn13Cox (x = 0, 0.5, 1.5, 4) free-standing thin films changes constantly.
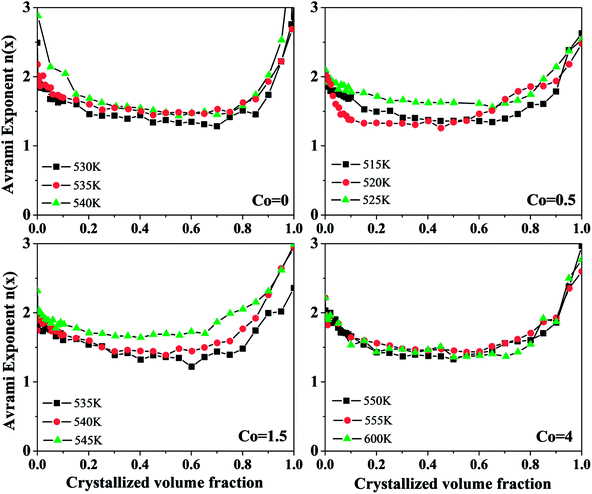 | ||
| Fig. 11 The local Avrami exponents n(x) versus crystallized volume fraction of Ni50Mn37−xSn13Cox (x = 0, 0.5, 1.5, 4) thin films. | ||
4. Conclusions
In conclusion, the effects of Co doping on the crystallization kinetics of Ni50Mn37−xSn13Cox (x = 0, 0.5, 1.5, 4) free-standing magnetic shape memory alloy thin films have been investigated by using XRD analysis, AFM analysis, non-isothermal and isothermal DSC analysis. Ni50Mn37−xSn13Cox (x = 0, 0.5, 1.5, 4) thin films are typical cubic austenitic structure (L21). The grain size of thin films decreases gradually with increasing Co content. In non-isothermal crystallization, the activation energy calculated by Kissing's method is 157.9 kJ mol−1, 198.8 kJ mol−1, 213 kJ mol−1 and 253.6 kJ mol−1, respectively. The crystallization peak temperatures and apparent activation energy both rise gradually with increasing Co content, which could be due to the fact that Co doping changes the number of grain boundaries of Ni–Mn–Sn alloy thin films. The local activation energy of thin films with different Co content show the different variation tendency. In isothermal crystallization, the isothermal temperatures influence the crystallization process of Ni50Mn37−xSn13Cox (x = 0, 0.5, 1.5, 4) thin films. The average of Avrami exponent n for thin films of each Co content is approximately 1.5. The activation energies obtained in non-isothermal crystallization and isothermal crystallization are close, implying that the mechanisms of the two crystallization methods are similar. The variation of local Avrami exponents n(x) demonstrates that the crystallization mechanism of Ni50Mn37−xSn13Cox (x = 0, 0.5, 1.5, 4) thin films changes constantly, from diffusion-controlled two-dimensional growth to diffusion-controlled three-dimensional growth. The nucleation rate decreases firstly, then remains zero for some time, and finally increases.Conflicts of interest
There are no conflicts to declare.Acknowledgements
The authors acknowledge the supports of National Natural Science Foundation of China (Grant No. 51471064 and 51301054); and Program for Youth Academic Backbone in Heilongjiang Provincial University (Grant No. 1251G022).References
- Y. Sutou, Y. Imano, N. Koeda, T. Omori, R. Kainuma, K. Ishida and K. Oikawa, Appl. Phys. Lett., 2004, 85, 4358–4360 CrossRef.
- K. Ullakko, J. K. Huang, C. Kantner, R. C. O'Handley and V. V. Kokorin, Appl. Phys. Lett., 1996, 69, 1966–1968 CrossRef.
- N. Teichert, A. Auge, E. Yüzüak, I. Dincer, Y. Elerman, B. Krumme, H. Wende, O. Yildirim, K. Potzger and A. Hüzütten, Acta Mater., 2015, 86, 279–285 CrossRef.
- R. Modak, B. Samantaray, P. Mandal and A. Srinivasan, Appl. Phys. A, 2016, 122, 1–7 CrossRef.
- T. Krenke, M. Acet, E. F. Wassermann, X. Moya, L. Manosa and A. Planes, Phys. Rev. B: Condens. Matter Mater. Phys., 2005, 72, 014412 CrossRef.
- C. Jing, Z. Li, H. L. Zhang, J. P. Chen and Y. F. Qiao, Eur. Phys. J. B, 2009, 67, 193–196 CrossRef.
- H. S. Liu, C. L. Zhang, Z. D. Han, H. C. Xuan and D. H. Wang, J. Alloys Compd., 2009, 467, 27–30 CrossRef.
- Z. Han, D. Wang, B. Qian, J. Feng and X. Jiang, Jpn. J. Appl. Phys., 2010, 49, 0211 Search PubMed.
- Z. Yang, D. Y. Cong, L. Huang, Z. H. Nie and X. M. Sun, Mater. Des., 2015, 92, 932–936 CrossRef.
- R. Kainuma, Y. Imano, W. Ito, H. Morito, Y. Sutou, K. Oikawa, A. Fujita and K. Ishida, Appl. Phys. Lett., 2006, 88, 192513 CrossRef.
- W. Ito, X. Xu, R. Y. Umetsu, T. Kanomata, K. Ishida and R. Kainuma, Appl. Phys. Lett., 2010, 97, 242512 CrossRef.
- R. Y. Umetsu, A. Sheikh, W. Ito, B. Ouladdiaf, K. R. A. Ziebeck, T. Kanomata and R. Kainuma, Appl. Phys. Lett., 2011, 98, 042507 CrossRef.
- D. Y. Cong, S. Roth, M. Potschke, C. Hurrich and L. Schultz, Appl. Phys. Lett., 2010, 97, 1966 CrossRef.
- D. Y. Cong, S. Roth and L. Schultz, Acta Mater., 2012, 60, 5335–5351 CrossRef.
- K. Bhattacharya and R. D. James, J. Mech. Phys. Solids, 1999, 47, 531–576 CrossRef.
- J. W. Dong, J. Q. Xie, J. Lu, C. Adelmann, C. J. Palmstrøm, J. Cui, Q. Pan, T. W. Shield, R. D. James and S. McKernan, J. Appl. Phys., 2004, 95, 2593–2600 CrossRef.
- B. Winzek, S. Schmitz, H. Rumpf, T. Sterzl, R. Hassdorf, S. Thienhaus, J. Feydt, M. Moske and E. Quandt, Mater. Sci. Eng., A, 2004, 378, 40–46 CrossRef.
- R. Modak, M. M. Raja and A. Srinivasan, J. Magn. Magn. Mater., 2017, 448, 146–152 CrossRef.
- R. Machavarapu and G. Jakob, Appl. Phys. Lett., 2013, 102, 232406 CrossRef.
- Z. Wang, E. Guo, C. Tan, X. Tian, W. Cai and J. Zhu, RSC Adv., 2017, 7, 42866–42874 RSC.
- X. H. Tian, Z. H. Wang, J. C. Zhu, C. L. Tan, K. Zhang, Z. Yu and W. Cai, J. Non-Cryst. Solids, 2018, 495, 19–26 CrossRef.
- R. Vishnoi and D. Kaur, Surf. Coat. Technol., 2010, 204, 3773–3782 CrossRef.
- S. E. Muthu, N. V. R. Rao, M. M. Raja, D. M. R. Kumar, D. M. Radheep and S. Arumugam, J. Phys. D: Appl. Phys., 2010, 43, 425002 CrossRef.
- L. H. Yang, H. Zhang, F. X. Hu, J. R. Sun, L. Q. Pan and B. G. Shen, J. Alloys Compd., 2014, 588, 46–48 CrossRef.
- J. Z. Chen and S. K. Wu, Thin Solid Films, 1999, 339, 194–199 CrossRef.
- Z. Z. Yuan, X. D. Chen, B. X. Wang and Z. J. Chen, J. Alloys Compd., 2005, 399, 166–172 CrossRef.
- S. Venkataraman, J. Eckert, L. Schultz and D. J. Sordelet, Intermetallics, 2016, 14, 1085–1090 CrossRef.
- A. L. Alves, E. C. Passamani, V. P. Nascimento and A. Y. Takeuchi, J. Phys. D: Appl. Phys., 2010, 43, 227–238 CrossRef.
- R. Vishnoi and D. Kaur, Surf. Coat. Technol., 2010, 204, 3773–3782 CrossRef.
- H. E. Kissinger, Anal. Chem., 1957, 29, 1702–1706 CrossRef.
- S. K. Wu, K. H. Tseng and J. Y. Wang, Thin Solid Films, 2002, 408, 316–320 CrossRef.
- T. Hysen, T. Senoy, R. V. Ramanujan and M. R. Anantharaman, J. Mater. Sci., 2008, 43, 635–640 CrossRef.
- A. A. Pratap, K. N. Lad, T. L. S. Rao, P. Majmudar and N. S. Saxena, J. Non-Cryst. Solids, 2004, 345, 178–181 CrossRef.
- C. D. Doyle, J. Appl. Polym. Sci., 1961, 5, 1845–1864 CrossRef.
- M. Avrami, J. Chem. Phys., 1939, 7, 1103–1112 CrossRef.
- M. Avrami, J. Chem. Phys., 1940, 8, 212–224 CrossRef.
- M. Avrami, J. Chem. Phys., 1941, 9, 177–184 CrossRef.
- J. Málek, Thermochim. Acta, 1995, 267, 61–73 CrossRef.
- A. Calka and A. P. Radlinski, J. Mater. Res., 1985, 3, 59 CrossRef.
| This journal is © The Royal Society of Chemistry 2018 |

