 Open Access Article
A highly selective fluorescent probe for detection of Cd2+ and HSO3− based on photochromic diarylethene with a triazole-bridged coumarin-quinoline group
Shuli Guo,
Gang Liu*,
Congbin Fan and
Shouzhi Pu*
Jiangxi Key Laboratory of Organic Chemistry, Jiangxi Science and Technology Normal University, Nanchang 330013, PR China. E-mail: pushouzhi@tsinghua.org.cn; Fax: +86 791 83805870; Tel: +86 791 83805870 Tel: +86 791 83831996
First published on 21st June 2018
Abstract
A novel photochromic diarylethene containing a quinoline-linked 3-aminocoumarin Schiff base unit (1O) was synthesized and used for the selective detection of Cd2+ and HSO3−. The synthesized probe exhibited a straightforward response for the selective detection of Cd2+. Its fluorescence emission red-shifted ∼126 nm and was enhanced 24.9 fold in the presence of Cd2+. Meanwhile, the fluorescence color of 1O changed from dark cyan to golden yellow. The binding stoichiometry between 1O and Cd2+ was determined to be 1![[thin space (1/6-em)]](https://www.rsc.org/images/entities/char_2009.gif) :
:![[thin space (1/6-em)]](https://www.rsc.org/images/entities/char_2009.gif) 1. A molecular logic circuit with three inputs and one output was successfully constructed with its light and metal-responsive behaviors. In addition, 1O was able to selectively recognize HSO3− with a 135-fold enhanced fluorescence emission and a notable fluorescence color change from dark cyan to bright cyan. The 1H NMR and mass spectrometry analyses suggest that the HSO3− sensing of 1O is based on the hydrolysis of the Schiff base group of 1O.
1. A molecular logic circuit with three inputs and one output was successfully constructed with its light and metal-responsive behaviors. In addition, 1O was able to selectively recognize HSO3− with a 135-fold enhanced fluorescence emission and a notable fluorescence color change from dark cyan to bright cyan. The 1H NMR and mass spectrometry analyses suggest that the HSO3− sensing of 1O is based on the hydrolysis of the Schiff base group of 1O.
1. Introduction
Among various heavy metal ions, cadmium(II) is one of the most dangerous ions due to its high toxicity and carcinogenicity.1,2 As we know, Cd2+ has been widely used in many fields such as industry, agriculture, metallurgy, etc.3,4 However, high levels of Cd2+ can impose huge threats to the environment and human health due to its bioaccumulation through the food chain.5,6 Excessive intake of Cd2+ can not only increase the risk of cancer, heart disease, cardiovascular diseases and diabetes,7–10 but also damage the liver and kidneys. As a highly toxic heavy metal, cadmium has been listed on the “CERCLA Priority List of Hazardous Substances” of Toxic Substances and Disease Registry (ATSDR).11 Thus, efficient methodologies for selective detection of Cd2+ are desperately needed. One of the greatest challenges in Cd2+ detection is the highly similar binding properties of Cd2+ and Zn2+ that are located in the same group of the periodic table.12 Therefore, the development of highly selective sensors of Cd2+ without interferences from Zn2+ under physiological conditions has become a hot research topic.Anions play important roles in biological, medical, environmental and chemical sciences.13–15 Among various anions, bisulfite (HSO3−) is one of the most concerned anions, which has been widely used as an enzyme inhibitor, antimicrobial agent, beverages, and an antioxidant for foods.16 In fact, addition of bisulfite to beer and wine has been customary for centuries in most countries. However, it has been found that some individuals are sensitive to high concentrations of HSO3− with the syndromes of asthmatic attack, gastrointestinal distress, allergic reaction and skin allergy.17–22 Thus, the bisulfite content in foodstuffs has been strictly limited in many countries. For this reason, the selective and sensitive chemosensors of bisulfite are highly desired. To date, many of the reported HSO3− sensors have based on different reaction mechanisms, including coordination to metal ions,23,24 complexation with amines,25,26 Michael additions,27–32 selective reaction with aldehyde or levulinate.33–35 For instance, Zeng et al. Reported a mitochondria-targeted probe derived from the conjugation of carbazole and benzo[e]indolium, to which 1,4-nucleophilic addition reaction with bisulfite occurred.36 However, there are no reports for HSO3− sensors, which based on Schiff base with hydrolysis mechanisms.
A variety of advanced technologies, such as inductively coupled plasma-atomic emission spectrometry (ICP-AES),37 atomic absorption spectroscopy (AAS)38 and inductively coupled plasma-mass spectrometry (ICP-MS),39 have been widely used for the analysis of Cd2+ and HSO3−. By comparison, fluorescent probes are superior and have attracted increasing attentions in ion detections in both chemistry and biology due to their high sensitivity, good selectivity, easy operation, and low cost.40–46
Among the reported photo-responsive materials, diarylethene is one of the most promising photo-switchable molecules, which have exhibited great potentials in optical information storage media and photonic switch devices with their excellent photo reactivity, thermal stability, and fatigue resistance.47–51 Moreover, diarylethenes have also been extensively introduced to application in electronic logic devices in recent years, because they exhibit excellent optical performances and multi-response to various ions owing to their special structures.52–54 As known to all, electronic equipment has gradually become a necessity in people's lives and the logic circuits are essential for the fabrication of optoelectronic devices. According to the above advantages, an increasing number of diarylethenes were introduced to fluorescent sensor for detection of different ions in recent years. For instance, Li et al. reported a highly selective fluorescent probe for Cd2+ and Zn2+ based on a new diarylethene with quinoline–benzimidazole conjugated system,55 Zhang et al. reported a fluorescent sensor for Cd2+ based on a new diarylethene with a 1,8-naphthyridine unit,56 Duan et al. studied a fluorescent probe for Cd2+ based on a diarylethene with pyridinepiperazine-linked hydroxyquinoline group.57 However, there are no diarylethene-based chemosensors that exhibit fluorescence response to both Cd2+ and HSO3−. Thus, development of fluorescent probes toward Cd2+ and HSO3− are still challenging.
In this study, we designed and synthesized a novel photochromic diarylethene bearing a quinoline-linked 3-aminocoumarin Schiff base unit (1O), and its photochromic and fluorescent responses to Cd2+ and HSO3− were systematically discussed. Scheme 1 shows the photochromic process of 1O.
2. Experiments
2.1 General methods
All solvents were of analytical grade and distilled before use. Other reagents were used as-received. 1H NMR and 13C NMR spectra were recorded on a Bruker AV400 spectrometer (400 MHz) using DMSO-d6, CDCl3 and CD3CN as the solvents and tetramethylsilane (TMS) as the internal standard. Mass spectra were obtained using an Agilent 1100 Ion Trap LC/MS MSD system. Infrared spectra (IR) were collected on a BrukerVertex-70 spectrometer. Melting points were measured using a WRS-1B melting point apparatus. All metal ions, except for Hg2+ and K+ that were prepared with their chloride salts, were obtained by dissolving the corresponding metal nitrates (0.1 mmol) in distilled water (10 mL). All anions were obtained by dissolving the corresponding potassium or sodium salts (0.1 mmol) in distilled water (10 mL). The EDTA solution was prepared with ethylenediaminetetraacetic acid disodium salt (Na2EDTA) (1.0 mmol) in distilled water (10 mL). Fluorescence spectra were measured with a Hitachi F-4600 fluorescence spectrophotometer. UV-vis absorption spectra were recorded on an Agilent 8453 UV/vis spectrophotometer equipped with an MUA-165 UV lamp and MVL-210 visible lamp for photoirradiation. Fluorescence quantum yield was measured using a QY C11347-11 absolute PL quantum yield spectrometer. Photoirradiation was conducted on a setup consisting of an SHG-200 UV lamp, Cx-21 ultraviolet fluorescence analysis cabinet, and BMH-250 visible lamp.2.2 Synthesis of 1O
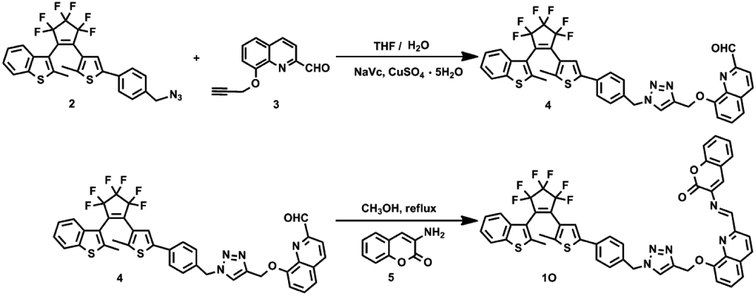
1O was synthesized following the route shown in Scheme 2. Compounds 2 and 3 were prepared by the methods reported in literature.58,59![[double bond, length as m-dash]](https://www.rsc.org/images/entities/char_e001.gif) N–), 7.15 (s, 1H, Ar–H), 7.29 (d, 1H, Ar–H), 7.35 (t, 3H, Ar–H), 7.40 (s, 1H, Ar–H), 7.42 (s, 2H, Ar–H), 7.47 (q, 2H, Ar–H), 7.52 (s, 1H, Ar–H), 7.54 (s, 1H, Ar–H), 7.60 (q, 2H, Ar–H), 7.62 (s, 1H, Ar–H), 7.79 (d, 1H, Ar–H), 7.94 (d, 1H, Ar–H), 8.51 (d, 2H, Ar–H); 13C NMR (100 MHz, DMSO, TMS): δ = 14.56, 15.07, 50.17, 53.01, 63.50, 83.50, 109.65, 111.73, 116.18, 119.37, 120.60, 120.75, 121.62, 121.92, 123.07, 123.36, 124.59, 124.86, 125.29, 125.71, 125.99, 126.36, 127.07, 127.98, 129.35, 130.98, 132.67, 136.35, 137.81, 138.11, 138.42, 141.20, 142.07, 143.62, 144.23, 148.55, 154.11, 154.52, 159.14; IR (KBr, v, cm−1): 1715 (–C
N–), 7.15 (s, 1H, Ar–H), 7.29 (d, 1H, Ar–H), 7.35 (t, 3H, Ar–H), 7.40 (s, 1H, Ar–H), 7.42 (s, 2H, Ar–H), 7.47 (q, 2H, Ar–H), 7.52 (s, 1H, Ar–H), 7.54 (s, 1H, Ar–H), 7.60 (q, 2H, Ar–H), 7.62 (s, 1H, Ar–H), 7.79 (d, 1H, Ar–H), 7.94 (d, 1H, Ar–H), 8.51 (d, 2H, Ar–H); 13C NMR (100 MHz, DMSO, TMS): δ = 14.56, 15.07, 50.17, 53.01, 63.50, 83.50, 109.65, 111.73, 116.18, 119.37, 120.60, 120.75, 121.62, 121.92, 123.07, 123.36, 124.59, 124.86, 125.29, 125.71, 125.99, 126.36, 127.07, 127.98, 129.35, 130.98, 132.67, 136.35, 137.81, 138.11, 138.42, 141.20, 142.07, 143.62, 144.23, 148.55, 154.11, 154.52, 159.14; IR (KBr, v, cm−1): 1715 (–C![[double bond, length as m-dash]](https://www.rsc.org/images/entities/char_e001.gif) O), 1628 (–C
O), 1628 (–C![[double bond, length as m-dash]](https://www.rsc.org/images/entities/char_e001.gif) N), 1338 (–C–N), 1275 (–C–O); MS (m/z): Calculated for C48H31F6N5O3S2 [M]+: 903.1773, found: 904.1836 for [1O + H]+ and 926.1658 for [1O + Na]+.
N), 1338 (–C–N), 1275 (–C–O); MS (m/z): Calculated for C48H31F6N5O3S2 [M]+: 903.1773, found: 904.1836 for [1O + H]+ and 926.1658 for [1O + Na]+.3. Results and discussion
3.1 Photochromic of diarylethene 1O
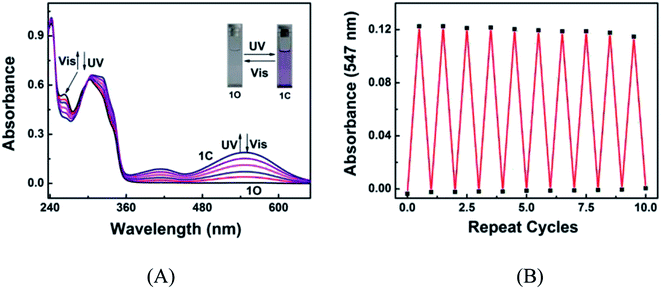
The photochromic behavior of diarylethene 1O induced by UV/vis light was investigated in acetonitrile (C = 2.0 × 10⁻⁵ mol L−1) at room temperature. As shown in Fig. 1A, the 1O solution in acetonitrile is colorless, exhibiting a sharp absorption peak at 242 nm due to the π–π* transition. A new absorption band centered at 547 nm appeared upon the irradiation with 297 nm light, accompanied with a visible color change from colorless to purple, due to the photocyclization of 1O to 1C.60–62 The photocyclization reaction reached the photostationary state (PSS) in 4.5 min under the irradiation of UV light, where a clear isosbestic point was observed at 300 nm. These observations suggest that the irritation caused a two-component photochromic reaction.63−65 The absorption spectrum was successfully restored to the original state, accompanied by the color change from purple to colorless, by irradiating the 1C solution with visible light. The cyclization and cycloreversion quantum yields were calculated to be 0.139 and 0.324, respectively. The fatigue resistance of 1O was tested by alternating irradiation with UV and visible light at room temperature. Ten coloration–decoloration cycles of 1O caused only 6.5% degradation (Fig. 1B).3.2 Changes in absorption spectrum induced by Cd2+
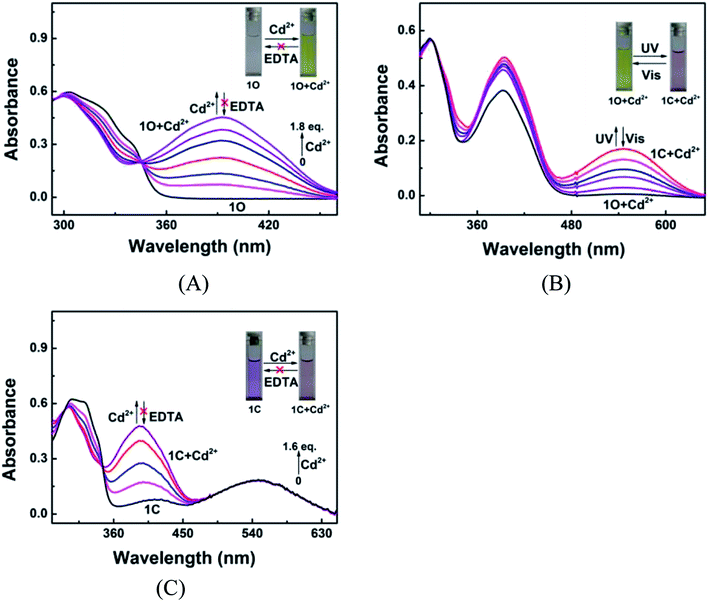
Fig. 2 shows the absorption spectra and colors of 1O induced by Cd2+/EDTA and UV/vis stimuli in acetonitrile. A new absorption band appeared at 392 nm as Cd2+ added and the band intensity increased with the increase of Cd2+ amount and reached the maximum at 1.8 equiv. of Cd2+, accompanied by a notable color change from colorless to yellow, due to the formation of complex 1O + Cd2+. The addition of an excess amount of EDTA did not restore the original color of 1O, suggesting that the Cd2+ sensing process of 1O was irreversible (Fig. 2A). As depicted in Fig. 2B, the 1O + Cd2+ complex was also photoisomerized under the alternating irradiation with UV and visible light. Upon the irradiation with 297 nm UV light, the yellow solution of 1O + Cd2+ turned plum and a new absorption band emerged at 547 nm (εmax = 8.5 × 10³ mol−1 L cm−1) due to the formation of the closed-ring isomer 1C + Cd2+.66,67 Reversely, the plum solution turned yellow, and the absorption spectrum was restored to that of the open-ring isomer 1O + Cd2+ upon irradiation with visible light. Directly adding Cd2+ to the solution of 1C weakened the absorption band centered at 322 nm and enhanced the absorption at 393 nm. Meanwhile, the solution color changed from purple to plum, indicating that 1C and Cd2+ formed 1C + Cd2+ complex. It is worth noting that the complexation between 1C and Cd2+ was not be reversed by EDTA either (Fig. 2C). These results indicate that both isomers of 1O have stronger Cd2+ binding ability than EDTA.3.3 Fluorescence response of 1O to metal ions
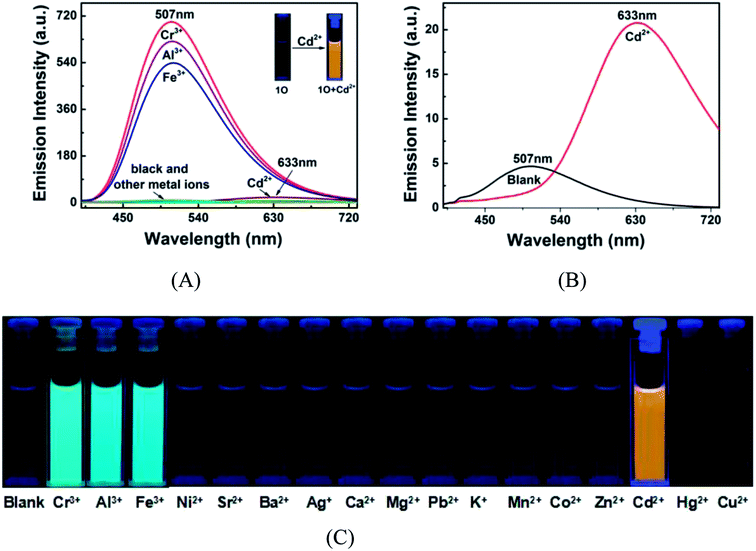
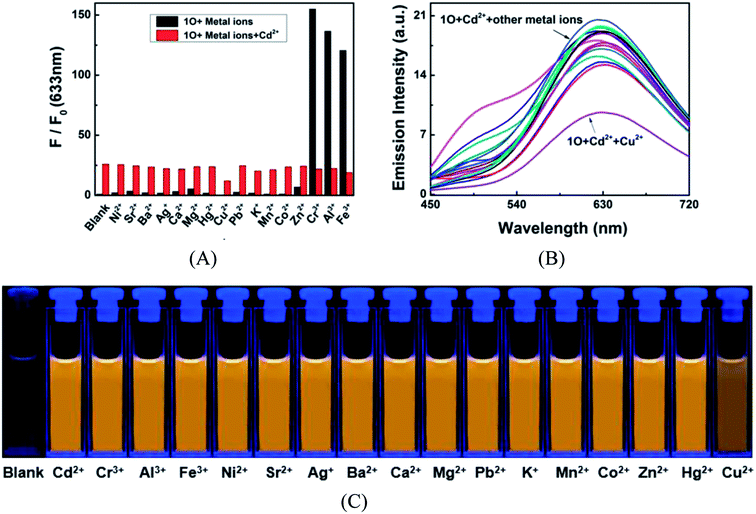
The fluorescence and color responses of 1O (2.0 × 10⁻⁵ mol L−1 in acetonitrile) to various metal cations (2.4 equiv.) including Cd2+, Cr3+, Al3+, Fe3+, Cu2+, Zn2+, Co2+, Mn2+, Hg2+, Pb2+, K+, Ca2+, Mg2+, Ba2+, Sr2+, Ag+ and Ni2+ were investigated with a fluorescence spectroscopy. All metal ions except for Cr3+, Al3+ and Fe3+ caused no obvious changes in the fluorescence emission at 507 nm of 1O (Fig. 3A). The fluorescence emission of 1O at 507 nm was dramatically enhanced as Cr3+, Al3+ or Fe3+ added, companied by the color change from dark cyan to bright cyan (Fig. 3C). However, the maximum emission peak had an obvious red-shift from 507 nm to 633 nm upon the addition of Cd2+ to 1O in acetonitrile, we can see this phenomenon more clearly through Fig. 3B. The structural rigidity of the Cd2+ complexes and metal binding close to the diarylethene might be the factors that cooperate to induce the large emission peak shift. Meanwhile, it's emission intensity enhanced by 24.9 folds with the stimulation of 2.4 equiv. of Cd2+, accompanied by a color change from dark cyan to golden yellow. These results indicate that 1O can selectively recognize Cd2+ over other metal ions in acetonitrile.To further demonstrate the selectivity of 1O towards Cd2+ in acetonitrile, competitive experiments were conducted on Cd2+ in the presence of equal equivalent of other competitive metal cations listed above. As shown in Fig. 4, the fluorescence response of 1O to Cd2+ was not significantly affected by other competing metal ions, except for Cu2+ that caused a reduction in emission intensity. However, compared with the variations of emission intensity and fluorescence color induced by Cd2+ alone, the interference of Cu2+ is negligible. As mentioned above, most Cd2+ fluorescent probes encounter the interference from Zn2+ that is located in the same group in the periodic table and has similar chemical properties to Cd2+. Yet such interference was not observed in the Cd2+ chemosensing of 1O too. These results suggested that 1O is highly selective to Cd2+ over other competing cations, even Cr3+, Al3+, Fe3+, and Zn2+ in acetonitrile.
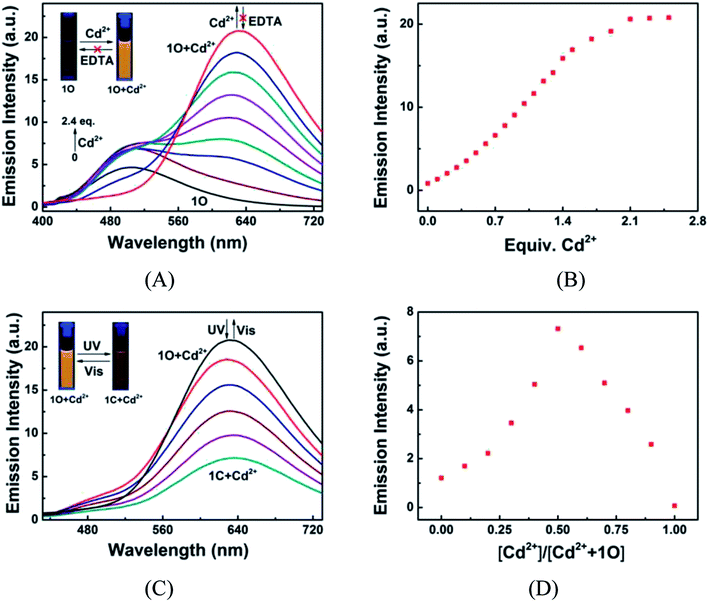
The fluorescence responses of 1O to Cd2+/EDTA and light stimuli were investigated in acetonitrile at room temperature. The emission peak of 1O at 507 nm disappeared and a new peak centered at 633 nm appeared as Cd2+ added due to the formation of 1O + Cd2+ complex (Fig. 5A). The emission intensity at 633 nm linearly increased with the increase of Cd2+ concentration and reached the maximum at 2.4 equiv. Cd2+, followed by a plateau with further titration (Fig. 5B). Meanwhile, the fluorescence color changed from dark cyan to golden yellow. The fluorescence quantum yield of 1O + Cd2+ was determined to be 0.031, 14.5-fold greater than that of 1O (Φf, 1O = 0.002). The 126 nm re-shift of emission peak and up to 24.9-fold enhanced emission intensity suggest that 1O is an ideal fluorescent chemosensor of Cd2+. The subsequent addition of excess EDTA did not restore the fluorescence to the original state of 1O, suggesting that the Cd2+ sensing process of 1O was irreversible. The 1O + Cd2+ complex also exhibited photoswitchable fluorescence behaviors upon alternating irradiation with UV and visible light. The fluorescence of 1O + Cd2+ was quenched dramatically with a clear color change from golden yellow to fawn brown upon the irradiation with 297 nm light, due to the formation of weak fluorescence closed-ring isomer of 1C + Cd2+ (Fig. 5C). However, the fluorescence intensity of 1O + Cd2+ was only reduced to ca. 34% at the photostationary state, possibly owing to the incomplete cyclization and the formation of isomers with parallel conformations. The back irradiation with appropriate visible light regenerated the open-ring isomer 1O + Cd2+ and the original emission intensity was recovered.
Additionally, in order to determine the binding stoichiometry between 1O and Cd2+, the Job's plot with emission intensity at 633 nm as a function of molar fraction of 1O was drawn. The concentration of 1O + Cd2+ reached the maximum at the molar fraction of [Cd2+]/([Cd2+] + [1O]) = ∼0.5 (Fig. 5D), indicating that the binding stoichiometry was 1![[thin space (1/6-em)]](https://www.rsc.org/images/entities/char_2009.gif) :
:![[thin space (1/6-em)]](https://www.rsc.org/images/entities/char_2009.gif) 1. The 1
1. The 1![[thin space (1/6-em)]](https://www.rsc.org/images/entities/char_2009.gif) :
:![[thin space (1/6-em)]](https://www.rsc.org/images/entities/char_2009.gif) 1 coordination stoichiometry of 1O with Cd2+ was further confirmed by the ESI mass spectrometry (ESI-MS) analysis. 1O exhibited a characteristic peak at 926.1658 m/z for [1O + Na]+ (calcd 926.1659) and 904.1836 m/z for [1O + H]+ (calcd 904.1852), which disappeared as 2.4 equiv. of Cd2+ were added, accompanied by the appearance of a new peak at 1016.0887 m/z for [1O + Cd2+ − H]+ (calcd 1016.0884) (Fig. 6).
1 coordination stoichiometry of 1O with Cd2+ was further confirmed by the ESI mass spectrometry (ESI-MS) analysis. 1O exhibited a characteristic peak at 926.1658 m/z for [1O + Na]+ (calcd 926.1659) and 904.1836 m/z for [1O + H]+ (calcd 904.1852), which disappeared as 2.4 equiv. of Cd2+ were added, accompanied by the appearance of a new peak at 1016.0887 m/z for [1O + Cd2+ − H]+ (calcd 1016.0884) (Fig. 6).
3.4 Application in logic circuits
Based on the photochromic behaviors of the diarylethene 1O in response to Cd2+ and UV/vis lights, a logic circuit was constructed with light irradiations and Cd2+ as the inputs and the absorbance of 1O at 393 nm as the output (Fig. 7). As shown in Fig. 7A, the absorption of 1O (output) can be effectively modulated by a logic circuit constructed with the three inputs including In1: 297 nm UV light, In2: λ > 500 nm visible light, and In3: Cd2+ (Fig. 7B). The output can be either ‘on’ or ‘off ’ with the Boolean value of ‘1’ or ‘0’. For example, In1 is ‘on’ with the Boolean value of ‘1’ when 297 nm light is used. Similarly, In2 is ‘1’ as irradiation with appropriate visible light (λ > 500 nm) is used and In3 is ‘1’ as Cd2+ is added. The output is considered at ‘on’ state with the Boolean value of ‘1’ if the absorbance at 393 nm is greater 0.18. Otherwise, it is regarded at ‘off state with the Boolean value of ‘0’. Table 1 lists all possible strings of the binary inputs and the corresponding output digits. Upon the stimulation of different inputs, the diarylethene can exhibit an on–off–on photochromic switching behavior.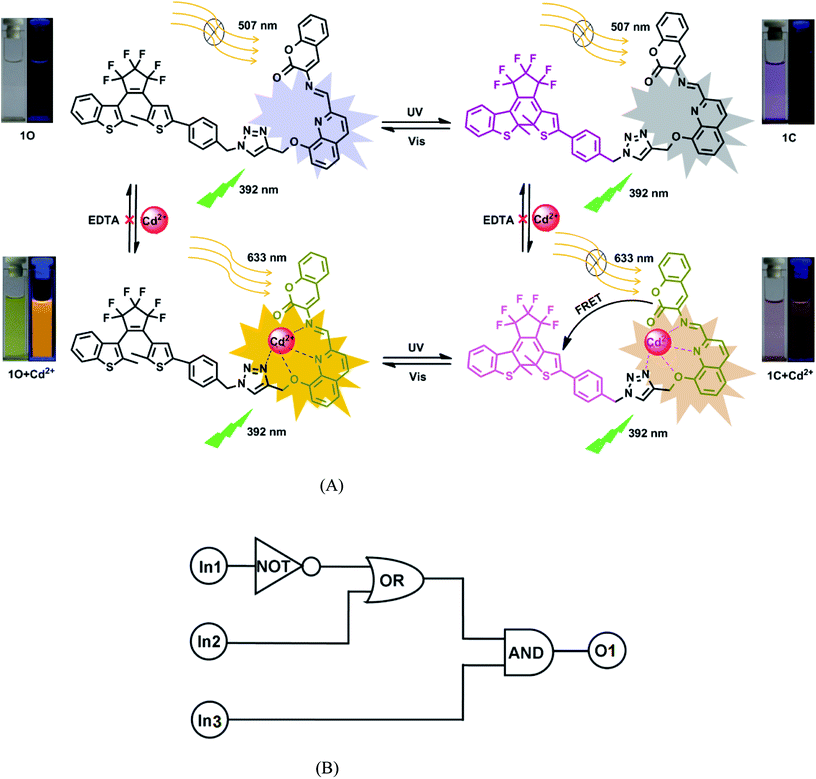 | ||
| Fig. 7 (A) Changes in the photochromism, color, and fluorescent of 1O induced by Cd2+/EDTA and UV/vis lights; (B) the combinational logic circuit equivalents to the truth table in Table 1, where In1 (297 nm UV light), In2 (500 nm visible light), In3 (Cd2+) are inputs, and O1 is output. | ||
| Input | Output λab = 393 nm | ||
|---|---|---|---|
| In1 (UV) | In2 (Vis) | In3 (Cd2+) | |
| a The output is defined as 1 if the absorbance at 393 nm is greater than 0.18, otherwise it is defined as 0. | |||
| 0 | 0 | 0 | 0 |
| 0 | 0 | 1 | 1 |
| 1 | 0 | 0 | 0 |
| 0 | 1 | 0 | 0 |
| 1 | 0 | 1 | 0 |
| 0 | 1 | 1 | 1 |
| 1 | 1 | 0 | 0 |
| 1 | 1 | 1 | 1 |
3.5 Fluorescence response of 1O to anions
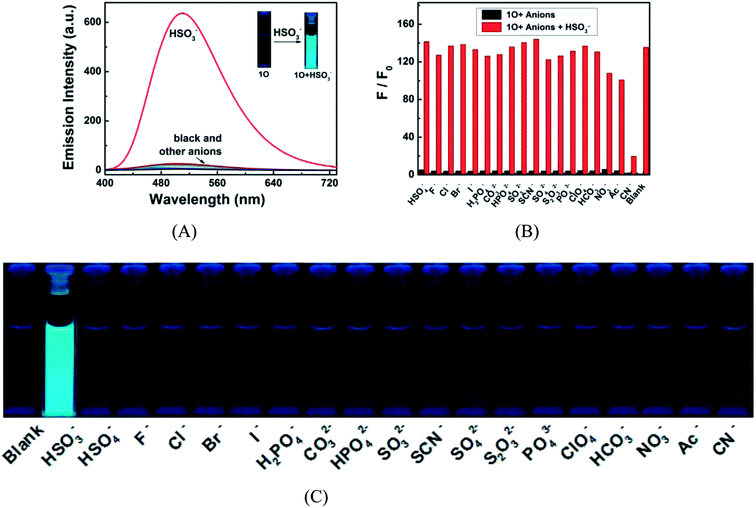
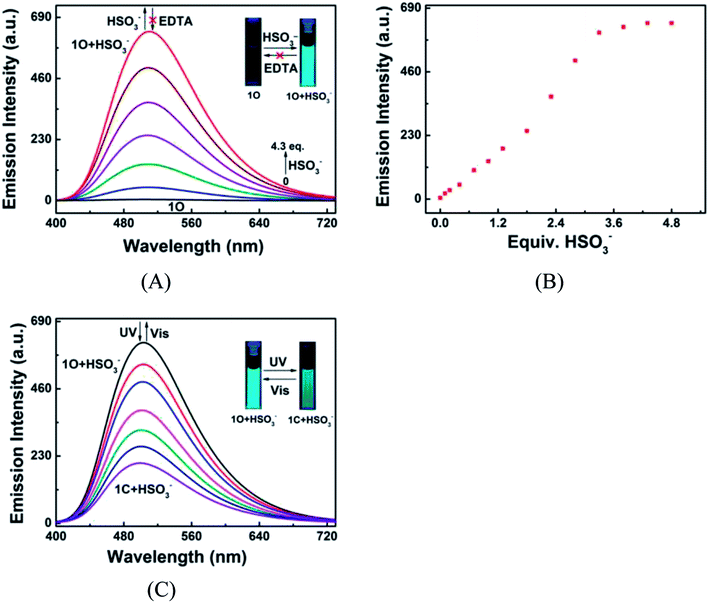
The fluorescence responses of 1O to a variety of anions including HSO3−, HSO4−, F−, Cl−, Br−, I−, H2PO4−, CO32−, HPO42−, SO32−, SCN−, SO42−, S2O32−, PO43−, ClO4−, HCO3−, NO3−, Ac− and CN− were measured in acetonitrile to explore its potential application as a selective anion sensor. As shown in Fig. 8A and C for the fluorescence spectra of 1O in the presence of 4.3 equiv. anions, none of them, except for HSO3− caused notably fluorescent emission at 510 nm and a fluorescent color change from dark cyan to bright cyan. Compared with that of 1O, the fluorescence intensity was enhanced by 135.5 folds, suggesting that 1O can recognize HSO3−. The selectivity of the reorganization was further confirmed by competitive experiments. As depicted in Fig. 8B, all competing anions, except for CN− showed no obvious interference with the HSO3− sensing.To further illuminate the responsive fluorescent emission of 1O induced by HSO3− and UV/vis irradiation, fluorescence titration was conducted at room temperature. As shown in Fig. 9A and B, the fluorescence emission of 1O at 510 nm linearly increased with the increase of HSO3− amount, accompanied by a notable fluorescent color change from dark cyan to bright cyan, and reached the maximum at 4.3 equiv. HSO3−, followed by a plateau as HSO3− further added. The addition of excess EDTA did not recover its original fluorescence intensity, indicating that the HSO3− sensing process of 1O was irreversible (Fig. 9A). The absolute fluorescence quantum yield of 1O + HSO3− was determined to be 0.048, 23 folds high than that of 1O (Φf, 1O = 0.002). These results suggest that the diarylethene can also be potentially used as a fluorescent probe for the quantitative detection of HSO3−. The 1O + HSO3− complex also exhibited photoswitchable fluorescence behavior upon alternating irradiation with UV and visible light. The fluorescence of 1O + HSO3− was quenched dramatically with a clear color change from bright cyan to light cyan under the irradiation of 297 nm light, due to the formation of closed-ring isomer 1C + HSO3− (Fig. 9C). The fluorescence intensity of 1O + HSO3− was weakened to ca. 32% at PSS due to the incomplete cyclization and existence of isomers with parallel conformations. Upon the irradiation of visible light, the fluorescent spectrum was restored to the initial state of 1O + HSO3−.
To further explore the interaction between 1O and HSO3− in solution and determine the sensing mechanism, the 1H NMR titration of 1O with HSO3− was performed in deuterated acetonitrile. 1O exhibited a singlet at δ 6.18 ppm of the imine protons (N![[double bond, length as m-dash]](https://www.rsc.org/images/entities/char_e001.gif) CH) (Fig. 10A). As 4.3 equiv. HSO3− was added to the 1O solution, the singlet at δ 6.18 ppm disappeared and a new singlet appeared at δ 10.26 ppm that was attributed to aldehyde protons (–CHO). These results suggest that 1O was hydrolyzed to afford compound 4 in the presence of HSO3− in acetonitrile, similar phenomena were also found in other reported probes.68–70
CH) (Fig. 10A). As 4.3 equiv. HSO3− was added to the 1O solution, the singlet at δ 6.18 ppm disappeared and a new singlet appeared at δ 10.26 ppm that was attributed to aldehyde protons (–CHO). These results suggest that 1O was hydrolyzed to afford compound 4 in the presence of HSO3− in acetonitrile, similar phenomena were also found in other reported probes.68–70
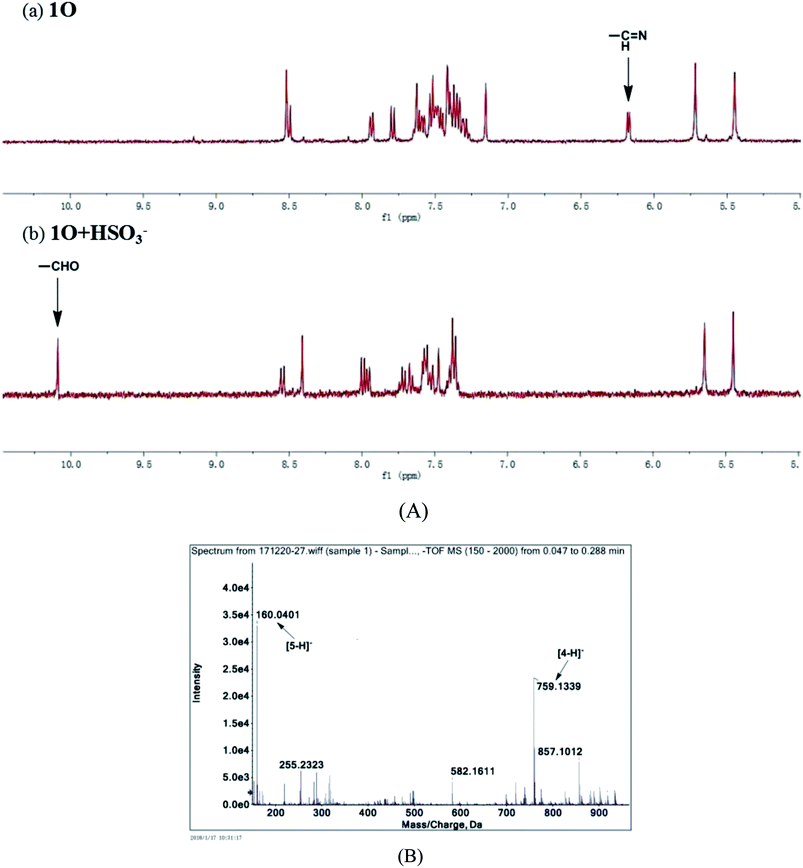 | ||
| Fig. 10 (A) Partial 1H NMR spectra of 1O in the absence (a) and presence of 4.3 eq. (b) of HSO3− in deuterated acetonitrile; (B) ESI-MS spectrum of 1O + HSO3−. | ||
The mass spectra of 1O and 1O + HSO3− more directly evidenced the reaction. As depicted in Fig. 10B, the peaks of 1O at 926.1658 m/z for [1O + Na]+ (calcd 926.1659) and 904.1836 m/z for [1O + H]+ (calcd 904.1852) disappeared after 4.3 equiv. HSO3− added, and two new peaks appeared at m/z = 759.1340 for compound 4, (calcd C39H26F6N4O2S2 [M − H]−: 759.13216) and 160.0401 for compound 5 (calcd for C9H7NO2 [M − H]−: 160.03976). Therefore, the enhanced fluorescence and color change of 1O in recognizing HSO3− was due to the cleavage of imine bond in 1O that generated aldehyde and amine, e.g. compound 4 and 3-aminocoumarin 3, as depicted in Scheme 3.
4. Conclusion
In summary, a novel photochromic chemosensor, a diarylethene bearing a quinoline-linked 3-aminocoumarin group (1O), was designed and synthesized. It exhibited typical photochromism and fluorescent switching properties and high selectivity to Cd2+ and HSO3−. 1O showed a straightforward response for the selective detection of Cd2+, ∼126 nm red shifted emission peak and up to 24.9-fold enhanced fluorescence intensity, accompanied by a notable fluorescent color change from dark cyan to golden yellow. The competitive experiments suggest that such selective fluorescent response of 1O to Cd2+ is not interfered by other competing metal cations including Zn2+. The binding stoichiometry between 1O and Cd2+ was determined to be 1![[thin space (1/6-em)]](https://www.rsc.org/images/entities/char_2009.gif) :
:![[thin space (1/6-em)]](https://www.rsc.org/images/entities/char_2009.gif) 1. Similarly, it was found that HSO3− was able to enhance the fluorescence emission of 1O in acetonitrile up to 135.5-fold and caused a notable fluorescence color change from dark cyan to bright cyan due to the hydrolysis of the C
1. Similarly, it was found that HSO3− was able to enhance the fluorescence emission of 1O in acetonitrile up to 135.5-fold and caused a notable fluorescence color change from dark cyan to bright cyan due to the hydrolysis of the C![[double bond, length as m-dash]](https://www.rsc.org/images/entities/char_e001.gif) N bond in 1O that produced an aldehyde and amine. These results suggest that the diarylethene derivative has a great application potential as a fluorescent sensor of both Cd2+ and HSO3−.
N bond in 1O that produced an aldehyde and amine. These results suggest that the diarylethene derivative has a great application potential as a fluorescent sensor of both Cd2+ and HSO3−.
Conflicts of interest
There are no conflicts of interest to declare.Acknowledgements
The authors are grateful for the financial support from the National Natural Science Foundation of China (21363009, 21662015), the “5511” science and technology innovation talent project of Jiangxi, the key project of Natural Science Foundation of Jiangxi Province (20171ACB20025), the Science Funds of Natural Science Foundation of Jiangxi Province (20171BAB203014, 20171BAB203011).References
- L. Zhang, W. Hu, L. Yu and Y. Wang, Chem. Commun., 2015, 51, 4298–4301 RSC.
- Z. Shi, Q. Han, L. Yang, H. Yang, X. Tang and W. Dou, et al., Chem.–Eur. J., 2015, 21(1), 290–297 CrossRef PubMed.
- S. F. Zhou, J. J. Wang, L. Gan, X. J. Han, H. L. Fan, L. Y. Mei, J. Huang and Y. Q. Liu, J. Alloys Compd., 2017, 721, 492–500 CrossRef.
- R. Kumar, T. Bhuvana and A. Sharma, RSC Adv., 2017, 7, 42146–42158 RSC.
- J. N. Hao and B. Yan, Chem. Commun., 2015, 51, 7737–7740 RSC.
- Y. Lv, L. Wu, W. Shen, J. Wang, G. Xuan and X. Sun, J. Porphyrins Phthalocyanines, 2015, 19, 769–774 CrossRef.
- C. D. Klaassen, J. Liu and B. Diwan, Toxicol. Appl. Pharmacol., 2009, 238, 215–220 CrossRef PubMed.
- X. Y. Xu and B. Yan, Sens. Actuators, B, 2016, 222, 347–353 CrossRef.
- Y. Luo, D. Tang, W. Zhu, Y. Xu and X. Qian, J. Mater. Chem. C, 2015, 3, 8485–8489 RSC.
- V. N. Mehta, J. V. Rohit and S. K. Kailasa, New J. Chem., 2016, 40, 4566–4574 RSC.
- Agency for Toxic Substances and Disease Registry, 4770 Buford Hwy NE, Atlanta, GA 30341, http://www.atsdr.cdc.gov/cercla/07list.html.
- A. Sil, A. Maity, D. Giri and S. K. Patra, Sens. Actuators, B, 2016, 226, 403–411 CrossRef.
- J. J. Park, Y. H. Kim, C. Kim and J. Kang, Tetrahedron Lett., 2011, 52, 2759–2763 CrossRef.
- H. Li, Anal. Chim. Acta, 2015, 897, 102–108 CrossRef PubMed.
- J. Y. Noh, I. H. Hwang, H. Kim, E. J. Song, K. B. Kim and C. Kim, Bull. Korean Chem. Soc., 2013, 34, 1985 CrossRef.
- M. Li, W. Feng, H. Zhang and G. Feng, Sens. Actuators, B, 2017, 243, 51–58 CrossRef.
- G. Xu, H. Wu, X. Liu, R. Feng and Z. Liu, Dyes Pigm., 2015, 120, 322–327 CrossRef.
- D. P. Li, Z. Y. Wang, X. J. Cao, J. Cui, X. Wang, H. Z. Cui, J. Y. Miao and B. X. Zhao, Chem. Commun., 2016, 52, 2760–2763 RSC.
- Y. Zhang, L. Guan, H. Yu, Y. Yan, L. Du, Y. Liu, M. Sun, D. Huang and S. Wang, Anal. Chem., 2016, 88, 4426–4431 CrossRef PubMed.
- J. Xu, J. Pan, X. Jiang, C. Qin, L. Zeng, H. Zhang and J. Zhang, Biosens. Bioelectron., 2016, 77, 725–732 CrossRef PubMed.
- W. L. Wu, Z. Y. Wang, X. Dai, J. Y. Miao and B. X. Zhao, Sci. Rep., 2016, 6, 25315 CrossRef PubMed.
- G. Wang, H. Chen, X. Chen and Y. Xie, RSC Adv., 2016, 6, 18662–18666 RSC.
- L. He, W. Lin, Q. Xu and H. Wei, ACS Appl. Mater. Interfaces, 2014, 6, 22326–22333 CrossRef PubMed.
- L. Yuan, W. Lin, K. Zheng, L. He and W. Huang, Chem. Soc. Rev., 2013, 42, 622–661 RSC.
- A. V. Leontiev and D. M. Rudkevich, J. Am. Chem. Soc., 2005, 127, 14126–14127 CrossRef PubMed.
- Y. Sun, C. Zhong, R. Gong, H. Mu and E. Fu, J. Org. Chem., 2009, 74, 7943–7946 CrossRef PubMed.
- Q. Sun, W. Zhang and J. Qian, Talanta, 2017, 162, 107–113 CrossRef PubMed.
- Y. Chen, X. Wang, X. Yang, Y. Zhong, Z. Li and H. Li, Sens. Actuators, B, 2015, 206, 268–275 CrossRef.
- W. Chen, Q. Fang, D. Yang, H. Zhang, X. Song and J. Foley, Anal. Chem., 2015, 87, 609–616 CrossRef PubMed.
- J. Xu, J. Pan, X. Jiang, C. Qin, L. Zeng and H. Zhang, et al., Biosens. Bioelectron., 2016, 77, 725–732 CrossRef PubMed.
- M. J. Peng, X. F. Yang, B. Yin, Y. Guo, F. Suzenet, D. En and Y. W. Duan, Chem.–Asian J., 2014, 9, 1817–1822 CrossRef PubMed.
- L. Tan, W. Lin, S. Zhu, L. Yuan and K. Zheng, Org. Biomol. Chem., 2014, 12, 4637–4643 RSC.
- L. M. Zhu, J. C. Xu, Z. Sun, B. Q. Fu, Q. Q. Qin and L. T. Zeng, et al., Chem. Commun., 2015, 5, 1154–1156 RSC.
- X. Liu, Q. Yang, W. Chen, L. Mo, S. Chen and J. Kang, et al., Org. Biomol. Chem., 2015, 13, 8663–8668 RSC.
- S. Yu, X. Yang, Z. Shao, Y. Feng, X. Xi and R. Shao, et al., Sens. Actuators, B, 2016, 235, 362–369 CrossRef.
- J. Xu, J. Pan, X. Jiang, C. Qin, L. Zeng and H. Zhang, et al., Biosens. Bioelectron., 2016, 77, 725–732 CrossRef PubMed.
- D. P. Li, Z. Y. Wang, X. J. Cao, J. Cui, X. Wang, H. Z. Cui, J. Y. Miao and B. X. Zhao, Chem. Commun., 2016, 52, 2760–2763 RSC.
- F. Sa, W. T. Vong, T. M. Chan and C. W. K. Lam, Clin. Chim. Acta, 2010, 411, 909 CrossRef.
- M. A. Hamilton, P. W. Rode, M. E. Merchant and J. Sneddon, Microchem. J., 2008, 88, 52–55 CrossRef.
- Y. X. Zuo, J. K. Xu, F. X. Jiang, X. M. Duan, L. M. Lu, G. Ye, C. C. Li and Y. F. Yu, J. Electroanal. Chem., 2017, 794, 71–77 CrossRef.
- Y. Yue, F. Huo, C. Yin, J. O. Escobedo and R. M. Strongin, Analyst, 2016, 141, 1859–1873 RSC.
- T. Kowada, H. Maed and K. Kikuchi, Chem. Soc. Rev., 2015, 44, 4955–4972 RSC.
- H. D. Xiao, K. Xin, H. F. Dou, G. Yin, Y. W. Quan and R. Y. Wang, Chem. Commun., 2015, 51, 1442–1445 RSC.
- W. W. Qin, W. Dou, V. Leen, W. Dehaen, M. V. D. Auweraer and N. Boens, RSC Adv., 2016, 6, 7806–7816 RSC.
- B. Sen, M. Mukherjee, S. Banerjee, S. A. Pal and P. Chattopadhyay, Dalton Trans., 2015, 44, 8708–8717 RSC.
- Q. Lin, T. T. Lu, X. Zhu, T. B. Wei, H. Li and Y. M. Zhang, Chem. Sci., 2016, 7, 5341–5346 RSC.
- M. Irie, T. Fukaminato and K. Matsuda, Chem. Rev., 2014, 114, 12174–12277 CrossRef PubMed.
- W. L. Li, X. Li, Y. S. Xie, Y. Wu, M. Q. Li and X. Y. Wu, et al., Sci. Rep., 2015, 5, 9186 CrossRef PubMed.
- G. T. Xu, B. Li, J. Y. Wang, D. B. Zhang and Z. N. Chen, Chem.–Eur. J., 2015, 21, 3318–3326 CrossRef PubMed.
- B. Li, H. M. Wen, J. Y. Wang, L. X. Shi and Z. N. Chen, Inorg. Chem., 2015, 54, 11511–11519 CrossRef PubMed.
- Y. L. Fu, Y. Y. Tu, C. B. Fan, C. H. Zheng, G. Liu and S. Z. Pu, New J. Chem., 2016, 40, 8579–8586 RSC.
- S. Z. Pu, Q. Sun, C. B. Fan, R. J. Wang and G. Liu, J. Mater. Chem. C, 2016, 4, 3075–3093 RSC.
- S. J. Xia, G. Liu and S. Z. Pu, J. Mater. Chem. C, 2015, 3, 4023–4029 RSC.
- G. Li, L. L. Ma, G. Liu, C. B. Fan and S. Z. Pu, RSC Adv., 2017, 7, 20591 RSC.
- G. Li, D. B. Zhang, G. Liu and S. Z. Pu, Tetrahedron Lett., 2016, 57, 5205–5210 CrossRef.
- X. X. Zhang, R. J. Wang, C. B. Fan, G. Liu and S. Z. Pu, Dyes Pigm., 2017, 139, 208–217 CrossRef.
- F. Duan, G. Liu, P. Liu, C. B. Fan and S. Z. Pu, Tetrahedron, 2016, 72, 3213–3220 CrossRef.
- G. F. Wu, M. X. Li, J. J. Zhu, K. W. C. Lai, Q. X. Tong and F. Lu, RSC Adv., 2016, 6, 100696–100699 RSC.
- S. Z. Pu, H. C. Ding, G. Liu, C. H. Zheng and H. Y. Xu, J. Phys. Chem. C, 2014, 118, 7010–7017 CrossRef.
- C. B. Fan, L. L. Gong, L. Huang, F. Luo, R. Krashina and X. F. Yi, et al., Angew. Chem., Int. Ed., 2017, 56, 7900–7906 CrossRef PubMed.
- S. Y. Li, D. B. Zhag, J. Y. Wang, R. M. Lu, C. H. Zheng and S. Z. Pu, Sens. Actuators, B, 2017, 245, 263–272 CrossRef.
- S. L. Guo, G. Liu, C. B. Fan and S. Z. Pu, Sens. Actuators, B, 2018, 266, 603–613 CrossRef.
- S. Z. Pu, C. C. Zhang, C. B. Fan and G. Liu, Dyes Pigm., 2016, 129, 24–33 CrossRef.
- H. J. Jia, S. Z. Pu, C. B. Fan, G. Liu and C. H. Zheng, Dyes Pigm., 2015, 121, 211–220 CrossRef.
- H. C. Ding, B. Q. Lia, S. Z. Pu, G. Liu, D. C. Jia and Z. Yu, Sens. Actuators, B, 2017, 247, 26–35 CrossRef.
- E. T. Feng, C. B. Fan, N. S. Wang, G. Liu and S. Z. Pu, Dyes Pigm., 2018, 151, 22–27 CrossRef.
- Z. L. Shi, Y. Y. Tu, R. J. Wang, G. Liu and S. Z. Pu, Dyes Pigm., 2018, 149, 764–773 CrossRef.
- L. Y. Wang, J. J. Ou, G. P. Fang and D. R. Cao, Sens. Actuators, B, 2016, 222, 1184–1192 CrossRef.
- Z. L. Luo, K. Yin, Z. Yu, M. X. Chen, Y. Li and J. Ren, Spectrochim. Acta, Part A, 2016, 169, 38–44 CrossRef PubMed.
- S. Erdemir, B. Tabakci and M. Tabakci, Sens. Actuators, B, 2016, 228, 109–116 CrossRef.
| This journal is © The Royal Society of Chemistry 2018 |


