 Open Access Article
Creative Commons Attribution 3.0 Unported Licence
Stimuli-responsive fluorescence switching of cyanostilbene derivatives: ultrasensitive water, acidochromism and mechanochromism†
Bin Wangab and
ChunYing Wei *a
*a
aKey Laboratory of Chemical Biology and Molecular Engineering of Ministry of Education, Institute of Molecular Science, Shanxi University, Taiyuan 030006, PR China. E-mail: weichuny@sxu.edu.cn
bSchool of Basic Medical Sciences, Shanxi Medical University, Taiyuan 030001, P. R. China. Tel: (+)86-351-7010699
First published on 21st June 2018
Abstract
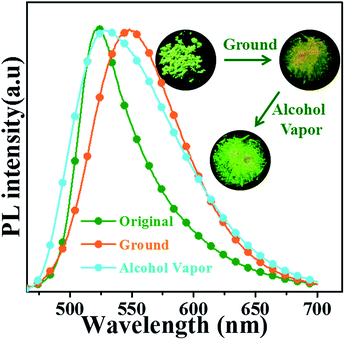
A novel donor–π–acceptor structure stimuli-responsive fluorescent material of (Z)-2-(4′-(diphenylamino)-[1,1′-biphenyl]-4-yl)-3-(pyridin-2-yl)acrylonitrile (oN-TPA) was designed and synthesized, with the cyano-group and pyridine as the acceptors (A) and triphenylamine as the donor (D). oN-TPA exhibits an obvious solvatochromic effect and the excited state is confirmed to be a hybridized local and charge-transfer (HLCT) state that simultaneously possesses the locally-excited (LE) state and charge transfer (CT) state characters. The LE state ensures relatively high fluorescence efficiency while the CT state provides multi-stimuli responsive fluorescence behaviors because it is easily tuned by the surrounding environment. Firstly, oN-TPA exhibits “on–off–on” fluorescence properties in the mixture of water/tetrahydrofuran (THF) with the increasing water content. For the “on–off” part, a good linear relationship between fluorescence intensity and water fraction is achieved, which is ascribed to the synergistic effect of protons in water and intramolecular charge-transfer (ICT) effect depending on solvent polarity. The “off–on” part demonstrates the aggregation-induced enhanced emission (AIEE) character of oN-TPA. Secondly, oN-TPA can be used as a protonic acid sensor to detect trifluoroacetic acid (TFA) in solvent and HCl vapour in the solid state due to the binding of the proton to the pyridine group. Finally, oN-TPA presents remarkable and reversible mechanochromic fluorescence switching between 552 nm and 642 nm (90 nm red-shift) during the pressurizing–depressurizing process. This work not only comprehensively demonstrates the stimuli-responsive fluorescence behaviors of oN-TPA, but also provides a D–π–A structure fluorescent material possessing potential applications in detection and sensing with remarkable fluorescence changes.
1. Introduction
Stimuli-responsive fluorescent materials have recently attracted more and more attention due to their potential applications as sensors, switches, and recording media in the past few years.1 Recently, various organic materials with efficient and reversible fluorescence behaviors have been developed, responding to light,2 mechanical force,3 temperature,4 pH,5 water,6 and solvent vapors.7 In the design of stimuli-responsive materials, a high solid-state efficiency is necessary for achieving obvious changes in fluorescence behavior towards various external stimuli. However, most luminescent materials suffer from the effects of aggregation-caused quenching (ACQ), which limits the application of chromic materials. A phenomenon named aggregation-induced enhanced emission (AIEE) appeared in 2001, which demonstrated enhanced emission in the aggregate state for the restriction of intramolecular rotations (RIR).8 From then on, more and more AIEE character luminescent materials have been developed and studied in organic light-emitting diodes (OLEDs),9 luminescent sensors,10 biomedical imaging,11 and smart materials.12 Except for the typical AIEE group of tetraphenylethene (TPE), many other systems have also been found to possess AIEE character.13Charge transfer (CT) fluorescent complexes usually consist of electron donor (D) and electron acceptor (A) parts, which have been extensively exploited in OLEDs,14 organic photo-voltaics (OPVs),15 field-effect transistors (FETs),16 nonlinear optics, and fluorescent chemosensors.17 CT molecules always show the strong solvatochromic effect, and their photoluminescence (PL) emissions exhibit a large red shift with the increase of solvent polarity. Therefore, the fluorescence emissions of CT-materials are greatly dependent on their excited states, which can be easily tuned by the surrounding environment, such as external stimulus. However, the strong CT-state usually causes a serious decrease in PL efficiency due to the small orbital overlap. Ma et al. proposed a named hybridized local and charge-transfer (HLCT)18 state method to realize high fluorescence efficiency (ηPL), and this excited state simultaneously possesses the locally-excited (LE) state and CT state characters. The LE component ensures relatively high fluorescence efficiency, and the CT component provides multi-stimuli responsive fluorescent behavior, which may provide a new strategy to achieve high-efficient and high-contrast stimuli responsive materials.
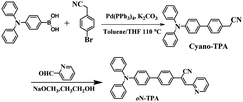
Herein, we report a D–π–A structure molecule of (Z)-2-(4′-(diphenylamino)-[1,1′-biphenyl]-4-yl)-3-(pyridin-2-yl)-acrylonitrile (oN-TPA) (Scheme 1), which exhibits the multi-stimuli responsive fluorescent properties. Solvatochromic experiments exhibit a large red-shift from 468 nm in low polar hexane to 615 nm in high polar acetonitrile. Combined with theoretical calculation and Lippert–Mataga model,19 the excited state is confirmed to be a HLCT state. The photophysical properties of oN-TPA in the mixture of THF/water demonstrate a pronounced AIEE effect. Moreover, it shows ultra-sensitivity PL response to water in THF, which can be used as a detector for water in organic solvents. The color and intensity of fluorescence produce the substantial changes by protonation, thus enabling it to work as a fluorescent pH sensor in both solution and solid states. At the same time, the switchable fluorescence of oN-TPA in the solid state is achieved during pressurizing–depressurizing process. Therefore, this work provides a comprehensive insight into the stimuli-responsive fluorescence behavior of a HLCT state luminescent material and a new strategy to achieve high efficient and easily tuned stimuli-responsive materials.
2. Experimental section
2.1 Constant-pressure experiments
The 1H NMR spectra were recorded by a Bruker Avance III 500 MHz spectrometer with DMSO-d6 as solvent and tetramethylsilane (TMS) as standard. The Shimadzu UV-2600 spectrophotometer (Japan) and SENS-9000 (GildenPhotonics, England) spectro-photometer were used to record UV-vis and PL spectra, respectively, and a solution of the sample (ca. 10−5 M) in a 1 cm quartz cuvette was used in the measurement. Digital photographs were taken by 550D (Canon, Japan) digital cameras. We used spectrometer C11347 (Hamamatsu, Japan) to measure their absolute fluorescence quantum yields. Powder XRD measurements were conducted in the range 5 < 2θ < 40 (PANalytical, Netherlands). X-ray crystallographic intensity data were collected using a Bruker APEX-II CCD, Gemini Ultra CCD diffractometer equipped with a graphite monochromated Enhance (Mo) X-ray source (λ = 0.71073 Å).2.2 High-pressure experiments
The crystal was placed in the hole of a T301 steel gasket, A 4![[thin space (1/6-em)]](https://www.rsc.org/images/entities/char_2009.gif) :
:![[thin space (1/6-em)]](https://www.rsc.org/images/entities/char_2009.gif) 1 mixture of methanol and ethanol was used as a pressure transmitting medium (PTM). We conducted in situ steady-state PL measurements on an Ocean Optics QE65000 spectrometer in the reflection mode. Excitation source is the 355 nm line of a DPSS laser with a spot size of 20 mm. The diamond anvil cell (DAC) containing the sample was put on a Nikon fluorescence microscope to focus the laser on the sample. Optical photographs of the compressed oN-TPA samples were taken by an imaging camera (Canon EOS 5D Mark II) equipped on the fluorescence microscope. In situ transient-state PL was tested with a laser strobe spectro-fluorometer (produced by photon technology instruments) coupled to an inverted fluorescence microscope (Nikon Ti-U).
1 mixture of methanol and ethanol was used as a pressure transmitting medium (PTM). We conducted in situ steady-state PL measurements on an Ocean Optics QE65000 spectrometer in the reflection mode. Excitation source is the 355 nm line of a DPSS laser with a spot size of 20 mm. The diamond anvil cell (DAC) containing the sample was put on a Nikon fluorescence microscope to focus the laser on the sample. Optical photographs of the compressed oN-TPA samples were taken by an imaging camera (Canon EOS 5D Mark II) equipped on the fluorescence microscope. In situ transient-state PL was tested with a laser strobe spectro-fluorometer (produced by photon technology instruments) coupled to an inverted fluorescence microscope (Nikon Ti-U).
2.3 Lippert–Mataga model
The influence of solvent environment on the optical property of oN-TPA can be understood using the Lippert–Mataga equation:19
 | (1) |
2.4 Quantum chemical calculations
All the density functional theory (DFT) calculations were carried out using Gaussian 09 (version D.01) package on a Power Leader cluster. The excited state geometry was optimized by time-dependent density functional theory (TD-DFT) with the B3LYP functional at the basis set level of 6-31G(d,p). The emission properties were obtained using TD-M06-2X/6-31G(d,p) at the excited state geometries.2.5 Synthesis and structural characterization of oN-TPA
Solution of cyano-TPA (1.8 g, 5 mmol) prepared according to the previous literatures18d and 4-formylbenzonitrile (0.65 g, 6 mmol) in anhydrous EtOH (chromatographically pure, 30 ml) was treated with NaOCH3 (0.12 g, 2 mmol), stirred at room temperature for over 2 h, cooled to 0 °C, and filtered. The precipitate was repeatedly washed with EtOH to give the desired oN-TPA powders (2.2 g, 90%). oN-TPA: 1H NMR (500 MHz, DMSO-d6 see Fig. S1, ESI†) δ 8.76 (d, J = 4.0 Hz, 1H), 8.10 (s, 1H), 7.95–7.99 (m, 1H), 7.90 (d, J = 8.5 Hz, 2H), 7.82 (d, J = 8.5 Hz, 2H), δ 7.78 (d, J = 9.0 Hz, 1H), 7.69 (d, J = 9.0 Hz, 2H), 7.47–7.49 (m, 1H), 7.35 (t, J = 8.0 Hz, 4H), 7.05–7.11 (m, 8H); 13C NMR (500 MHz, DMSO-d6) δ = 154.4, 150.1, 147.5, 140.3, 136.8, 133.4, 129.4, 127.7, 127.1, 126.8, 124.7, 124.2, 123.5, 123.3, 117.4 and 114.6, MS(EI+): m/z 449.2.3. Results and discussion
3.1 Solvatochromic effect
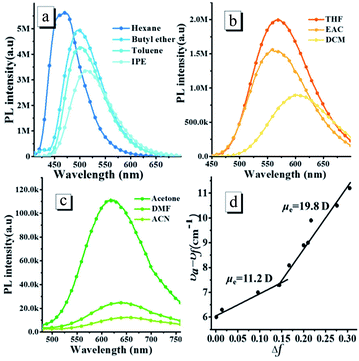
The oN-TPA possesses a typical D–π–A structure, in which the triphenylamine group acts as the electron donor part against the acceptor of the cyano-group and pyridine. Since the photophysical properties of D–π–A molecules are dependent on the solvent polarity, the absorption and PL spectra of oN-TPA were measured in the different solvents (Fig. S2, ESI† and Fig. 1), and the detailed data shown in Table S1, ESI.† The absorption spectra of oN-TPA display the minor changes in both shape and position in the different solvents (Fig. S2†). In contrast, with the increase of solvent polarity, the emission peak demonstrates a gradual red-shift from 469 nm in hexane to 650 nm in acetonitrile, exhibiting a strong solvatochromic effect (Fig. 1a–c). At the same time, the vibronic fine structure disappears and emission band broadens from low polarity to high polarity solvents, which illustrates an obvious intra-molecular charge-transfer (ICT) character in excited state. In addition, a clear decreasing trend of the ηPL in the different solvents is observed, which is ascribed to the CT effect depending on solvent polarity.19,20To evaluate the solvatochromic effect, the Lippert–Mataga model is applied to estimate the dipole moment (μe) of the excited state. The plot of Stokes shift against orientation polarizability (Δf) is shown in Fig. 1d. Notably, two linear relationships can be observed, indicating two different excited state properties in low and high polar solvents, respectively. The dipole moment, μe, is calculated to be 19.8 D in high polarity solvents, which is near the typical CT compound DMABN with μe of 23 D.21 The rapid decrease of PL quantum yield from 59.6% in THF to 0.8% in acetonitrile also illustrates a CT-dominant excited state in high-polarity solvents. While in low-polarity solvents, the dipole moment is calculated to be 11.2 D, which is obviously smaller than that of CT state in high polarity solvents. However, the red shift of 39 nm from 0.0012 in hexane to 0.145 in isopropyl ether indicates that the CT character still exists for S1 state.18 Meanwhile, a vibration fine structure and relatively high ηPL in hexane demonstrate the existence of LE component. Thus, the S1 state in low-polarity solvents contains CT and LE components simultaneously. The μe of 11.2 D, which is smaller than DMABN but larger than the LE compound about 8 D,21 is ascribed to the HLCT state character. The LE component in HLCT state ensures a relatively high PL efficiency, and the CT component in the excited state results in a large Stokes shift from low polar solvents to high polar solvents, which is sensitive to the external stimuli.
3.2 Aggregation-induced enhanced emission
To better understand the nature of excited states, we calculated and analyzed the S1→S0 natural transition orbital (NTO)22 of oN-TPA as depicted in Fig. 2. For the S1 state, the hole is delocalized over the whole molecule, while the particle is mainly localized at the diphenylethylene group with a small part of benzene on the TPA group. The separated orbitals provide a CT component with large dipole moment. In addition, orbital overlaps on acceptor provide a LE component, which ensures a relatively high radiative-transition rate with the oscillator strength (f) of 1.5188. NTO analysis indicates the coexistence of LE and CT components. The twist angle between donor and acceptor is 19.5°. Benefiting from the proper twist angle, a balance of LE and CT component is achieved. | ||
| Fig. 2 The S1→S0 NTO of oN-TPA. Herein, f represents the oscillator strength, and the weights of hole–particle are given for the S1→S0 excitation. | ||
To investigate the AIEE properties of oN-TPA, we measured the absorption and PL spectra in the water/THF mixture with different water fractions (Fig. S3, ESI† and Fig. 3). The fluorescence emissions demonstrate a slight red-shift and the intensities sharply decrease with gradual addition of water into the THF solution up to 70% (v/v), which can be ascribed to the enhanced ICT effect due to the increased solvent polarity. However, when the water fraction increases up to 80%, the aggregates appears, which can be verified by the lifted spectral tails from their absorption spectra. In addition, an obvious enhancement of the fluorescence intensity is observed because of the restriction in intramolecular rotations (RIR). As the water fractions reaches 90%, the fluorescence emission is further enhanced. Another reason for this AIEE behavior could be that the ICT process is effectually prevented, which is also helpful for the emission of light. Therefore, the emission maxima exhibit a blue-shift from 576 nm to 560 nm.
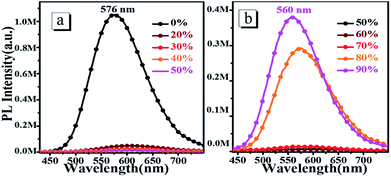 | ||
| Fig. 3 The steady-state fluorescence spectra of 10 μM oN-TPA in THF alone (0%) and THF–water mixture with water fractions from 20% to 90% (v/v). | ||
3.3 Water sensing
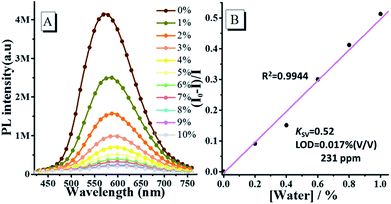
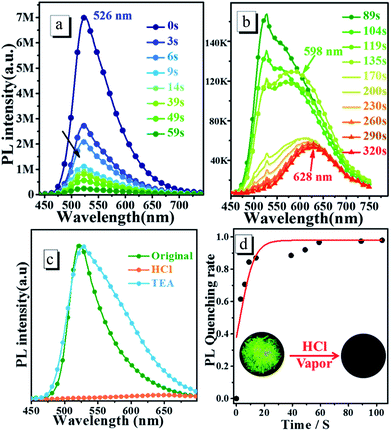
Based on the above results, the fluorescence emission of oN-TPA is highly sensitive to water, thus we further investigate its emission behaviour in THF by gradually increasing the content of water. Fig. 4a shows the fluorescence spectra of oN-TPA in THF with increasing the water fraction from 0 to 10% (v/v) in mixture solvents. In pure THF, oN-TPA exhibits a high PL efficiency of 59.6%, benefiting the full hybridization of LE and CT component. With the increase of water content, a significant decrease in the fluorescence intensity is observed, along with the red shift from 573 nm to 601 nm. It is ascribed to the synergistic effect of proton in water and ICT in mixture solvent. The fluorescence intensity is quenched by 61.9% when water content rises up to 3%. Especially, there is nearly no fluorescence emission when the water content reaches 7%. More importantly, a good linear relationship between fluorescent intensity (I0 − I)/I and water fraction is achieved when water fraction below 1% (Fig. S4, ESI†). The Stern–Volmer quenching constant (KSV) is 0.52 M−1, and the detection limit for water is 0.017% (231 ppm) in THF (Fig. 4b). Such a low detection limit indicates the high sensitivity of oN-TPA to water in THF. The results above suggest that oN-TPA can be used as a fast and effective PL probe to quantitatively detect low-level water in organic solvents.3.4 Sensing properties toward protonic acids
![[thin space (1/6-em)]](https://www.rsc.org/images/entities/char_2009.gif) :
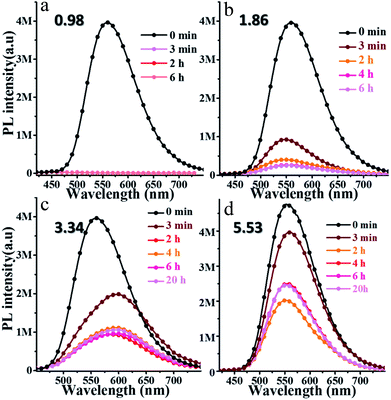
:![[thin space (1/6-em)]](https://www.rsc.org/images/entities/char_2009.gif) 9 at various pH were measured, and the pH was tuned by adding trifluoroacetic acid (TFA) concentration. As shown in Fig. 5a, after adding TFA for 3 minutes, the PL spectrum at pH 0.98 is almost a flat line parallel to the abscissa because of its transformation to the weakly emissive oN-TPAH+ under this acidic condition.23 When the pH increases to 1.86, there is still a weak fluorescence after 3 minutes (Fig. 5b). With the time getting longer, the oN-TPA molecule further undergoes protonation and its emission intensity gets weaker. As the pH further increases to 3.34 and 5.53 (Fig. 5c and d), the effect of proton quench reduces because of the progressive decrease in the population of oN-TPAH+ in solution. The extent of transformation of oN-TPA to oN-TPAH+ at the different pH values can also be followed by UV-vis absorption analysis (Fig. S5, ESI†). With the pH reduced from 4.52 to 0.96, the absorption peak at 374 nm nearly disappears and the band at 450 nm gradually increases, which should be ascribed to the formation of strong CT-state due to the increased electron withdrawing ability of protonated pyridine. At pH 4.52, a weak shoulder peak nearly disappears, showing that no protonation occurs at such a pH value.
9 at various pH were measured, and the pH was tuned by adding trifluoroacetic acid (TFA) concentration. As shown in Fig. 5a, after adding TFA for 3 minutes, the PL spectrum at pH 0.98 is almost a flat line parallel to the abscissa because of its transformation to the weakly emissive oN-TPAH+ under this acidic condition.23 When the pH increases to 1.86, there is still a weak fluorescence after 3 minutes (Fig. 5b). With the time getting longer, the oN-TPA molecule further undergoes protonation and its emission intensity gets weaker. As the pH further increases to 3.34 and 5.53 (Fig. 5c and d), the effect of proton quench reduces because of the progressive decrease in the population of oN-TPAH+ in solution. The extent of transformation of oN-TPA to oN-TPAH+ at the different pH values can also be followed by UV-vis absorption analysis (Fig. S5, ESI†). With the pH reduced from 4.52 to 0.96, the absorption peak at 374 nm nearly disappears and the band at 450 nm gradually increases, which should be ascribed to the formation of strong CT-state due to the increased electron withdrawing ability of protonated pyridine. At pH 4.52, a weak shoulder peak nearly disappears, showing that no protonation occurs at such a pH value.
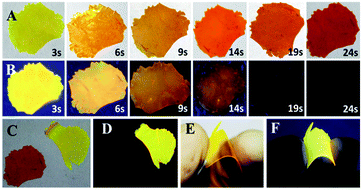
The doped film is more favorable to application, because it possesses higher luminescence efficiency of 82.5% benefiting from the rigid environment and higher sensitivity to HCl vapor for its larger area to protonation. oN-TPA is dispersed into PMMA matrix using CHCl3 (5%, dye/PMMA, w/w) dried on neat quartz plate to obtain doped film. In the natural light, it presents yellow (see Fig. 7E), and it performances a bright yellow emission under 365 nm UV light (see Fig. 7F). Exposed to HCl vapor, the film rapidly changes from yellowish green to red under natural light (see Fig. 7A). The emission intensity under 365 nm UV light is quenched quickly with exposure time, fluorescence quenching more than 95% at 19 s, and no fluorescent signal can be measured after 24 s (see Fig. 7B). Photographs of original and protonated film-doped in natural light and 365 nm UV light are given out for comparison (see Fig. 7C and D). These results indicate that HCl is an efficient medium for quenching the fluorescence of oN-TPA, which can be used to quickly detect HCl vapor.
3.5 Mechanofluorochromic experiments
![[thin space (1/6-em)]](https://www.rsc.org/images/entities/char_2009.gif) :
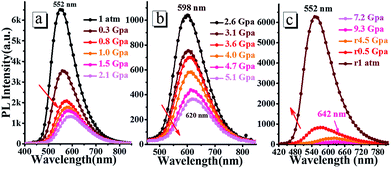
:![[thin space (1/6-em)]](https://www.rsc.org/images/entities/char_2009.gif) 1) as a pressure-transmitting medium. As shown in Fig. 9, with the hydrostatic pressure gradually increased from 1 atm to 9.3 GPa, the fluorescence spectra demonstrate a remarkable red-shift from green (552 nm) to orange (598 nm), and further to red (642 nm). At the same time, the emission intensity is reduced continuously. In the nature light, the color of the doped film presents a change from green to red (Fig. S8†). Upon the pressure released to 1 atm, both color and fluorescence recover to the original state, indicating its good reversibility as a pressure sensor. The emissions can be switched between 552 and 642 nm (90 nm red-shift) during pressurizing–depressurizing process, which could be applied as piezochromic luminescent material.
1) as a pressure-transmitting medium. As shown in Fig. 9, with the hydrostatic pressure gradually increased from 1 atm to 9.3 GPa, the fluorescence spectra demonstrate a remarkable red-shift from green (552 nm) to orange (598 nm), and further to red (642 nm). At the same time, the emission intensity is reduced continuously. In the nature light, the color of the doped film presents a change from green to red (Fig. S8†). Upon the pressure released to 1 atm, both color and fluorescence recover to the original state, indicating its good reversibility as a pressure sensor. The emissions can be switched between 552 and 642 nm (90 nm red-shift) during pressurizing–depressurizing process, which could be applied as piezochromic luminescent material.
4. Conclusions
In this work, we prepared a simple D–π–A structure multi-stimuli responsive fluorescence molecule of oN-TPA with AIEE effect. It exhibits obvious solvatochromic effect and its excited state is confirmed to be a HLCT state. Moreover, it can be used as a fast and effective PL probe to quantitatively detect low-level water in organic solvents, which is ascribed to the ICT effect with the increased mixture-solvents polarity. Because the pyridine unit can bind with a proton to form a cation, oN-TPA can also be used as a sensor for detecting protonic acids both in solvent for TFA and in solid for HCl vapor. Finally, it exhibits pronounced mechanochromic fluorescence properties, the reversibly emissions can be switched between 552 and 642 nm (90 nm red-shift) during pressurizing–depressurizing process. This work not only comprehensively demonstrates the stimuli-responsive fluorescence behaviors of oN-TPA, but also provides a D–π–A structure luminescent material possessing potential applications in detection and sensing with remarkable PL changes.Conflicts of interest
There are no conflicts to declare.Acknowledgements
This work was supported by the National Natural Science Foundation of China (21171108) and Shanxi Provincial Fund for Natural Sciences (201601D011026).Notes and references
- (a) M. M. Caruso, D. A. Davis, Q. Shen, S. A. Odom, N. R. Sottos, S. R. White and J. S. Moore, Chem. Rev., 2009, 109, 5755–5798 CrossRef PubMed; (b) Z. Chi, X. Zhang, B. Xu, X. Zhou, C. Ma, Y. Zhang, S. Liu and J. Xu, Chem. Soc. Rev., 2012, 41, 3878–3896 RSC; (c) X. Zhang, Z. Chi, Y. Zhang, S. Liu and J. Xu, J. Mater. Chem. C, 2013, 1, 3376–3390 RSC; (d) H. Sun, S. Liu, W. Lin, K. Y. Zhang, W. Lv, X. Huang, F. Huo, H. Yang, G. Jenkins and Q. Zhao, Nat. Commun., 2014, 5, 3601 CrossRef PubMed.
- (a) J. W. Chung, Y. You, H. S. Huh, B. K. An, S. J. Yoon, S. H. Kim, S. W. Lee and S. Y. Park, J. Am. Chem. Soc., 2009, 131, 8163–8172 CrossRef PubMed; (b) J. Wang, G. Yang, H. Jiang, G. Zou and Q. Zhang, Soft Matter, 2013, 9, 9785–9791 RSC.
- (a) X. Luo, J. Li, C. Li, L. Heng, Y. Q. Dong, Z. Liu, Z. Bo and B. Z. Tang, Adv. Mater., 2011, 23, 3261–3265 CrossRef PubMed; (b) Y. Zhang, J. W. Sun, G. Zhuang, M. Ouyang, Z. W. Yu, F. Cao, G. X. Pan, P. S. Tang, C. Zhang and Y. G. Ma, J. Mater. Chem. C, 2014, 2, 195–200 RSC.
- T. Guo, Q. Deng, G. Fang, Y. Yun, Y. Hu and S. Wang, Biosens. Bioelectron., 2016, 85, 596–602 CrossRef PubMed.
- M. Zhang, S. Zheng, L. Ma, M. Zhao, L. Deng, L. Yang and L. J. Ma, Spectrochim. Acta, Part A, 2014, 124, 682–686 CrossRef PubMed.
- (a) L. Sheng, M. Li, S. Zhu, H. Li, G. Xi, Y. Li, Y. Wang, Q. Li, S. Liang, K. Zhong and S. X.-A. Zhang., Nat. Commun., 2014, 5, 3044 CrossRef PubMed; (b) G. Xi, L. Sheng, I. Zhang, J. Du, T. Zhang, Q. Chen, G. Li, Y. Zhang, Y. Song, J. Li, Y. Zhang and S. X.-A. Zhang, ACS Appl. Mater. Interfaces, 2017, 9, 38032–38041 CrossRef PubMed.
- T. Zhou, T. Jia, S. Zhao, J. Guo, H. Zhang and Y. Wang, Cryst. Growth Des., 2011, 12, 179–184 CrossRef.
- J. Luo, Z. Xie, J. W. Lam, L. Cheng, H. Chen, C. Qiu, H. S. Kwok, X. Zhan, Y. Liu and D. Zhu, Chem. Commun., 2001, 1740–1741 RSC.
- (a) L. Yao, S. Zhang, R. Wang, W. Li, F. Shen, B. Yang and Y. Ma, Angew. Chem., 2014, 126, 2151–2155 CrossRef; (b) J. Huang, N. Sun, Y. Dong, R. Tang, P. Lu, P. Cai, Q. Li, D. Ma, J. Qin and Z. Li, Adv. Funct. Mater., 2013, 23, 2329–2337 CrossRef.
- (a) S. Chen, J. Liu, Y. Liu, H. Su, Y. Hong, C. K. Jim, R. T. Kwok, N. Zhao, W. Qin, J. W. Lam, K. S. Wong and B. Z. Tang, Chem. Sci., 2012, 3, 1804–1809 RSC; (b) Y. Liu, Y. Tang, N. N. Barashkov, I. S. Irgibaeva, J. W. Lam, R. Hu, D. Birimzhanova, Y. Yu and B. Z. Tang, J. Am. Chem. Soc., 2010, 132, 13951–13953 CrossRef PubMed; (c) D. Ding, J. Liang, H. Shi, R. T. Kwok, M. Gao, G. Feng, Y. Yuan, B. Z. Tang and B. Liu, J. Mater. Chem. B, 2014, 2, 231–238 RSC; (d) Y. Zhang, S. Li, G. Pan, H. Yang, M. Qile, J. Chen, Q. Song and D. Yan, Sens. Actuators, B, 2018, 254, 785–794 CrossRef.
- (a) M. J. Marín, F. Galindo, P. Thomas, T. Wileman and D. A. Russell, Anal. Bioanal. Chem., 2013, 405, 6197 CrossRef PubMed; (b) C. W. T. Leung, Y. Hong, S. Chen, E. Zhao, J. W. Y. Lam and B. Z. Tang, J. Am. Chem. Soc., 2013, 135, 62–65 CrossRef PubMed; (c) F. Oukacine, J. P. Quirino, L. Garrelly, B. Romestand, T. Zou and H. Cottet, Anal. Chem., 2011, 83, 4949–4954 CrossRef PubMed.
- (a) J. Shi, S. Zhang, M. Zheng, Q. Deng, C. Zheng, J. Li and F. Huang, Sens. Actuators, B, 2017, 238, 765–771 CrossRef; (b) S. Umar, A. K. Jha, D. Purohit and A. Goel, J. Org. Chem., 2017, 82, 4766–4773 CrossRef PubMed; (c) Y. Zhang, Q. Song, K. Wang, W. Mao, F. Cao, J. Sun, L. Zhan, Y. Lv, Y. Ma, B. Zou and C. Zhang, J. Mater. Chem. C, 2015, 3, 3049–3054 RSC.
- (a) C. Feng, K. Wang, Y. Xu, L. Liu, B. Zou and P. Lu, Chem. Commun., 2016, 52, 3836–3839 RSC; (b) G. Yin, Y. Ma, Y. Xiong, X. Cao, Y. Li and L. Chen, J. Mater. Chem. C, 2016, 4, 751–757 RSC.
- (a) W. Li, Y. Pan, L. Yao, H. Liu, S. Zhang, C. Wang, F. Shen, P. Lu, B. Yang and Y. Ma, Adv. Opt. Mater., 2014, 2, 892–901 CrossRef; (b) H. Uoyama, K. Goushi, K. Shizu, H. Nomura and C. dachi, Nature, 2012, 492, 234 CrossRef PubMed.
- (a) C. Ramanan, A. L. Smeigh, J. E. Anthony, T. J. Marks and M. R. Wasielewski, J. Am. Chem. Soc., 2011, 134, 386–397 CrossRef PubMed; (b) X. Zhang, Z. Lu, L. Ye, C. Zhan, J. Hou, S. Zhang, B. Jiang, Y. Zhao, J. Huang and S. Zhang, Adv. Mater., 2013, 25, 5791–5797 CrossRef PubMed.
- (a) A. Pron, P. Gawrys, M. Zagorska, D. Djurado and R. Demadrille, Chem. Soc. Rev., 2010, 39, 2577–2632 RSC; (b) X. Zhan, A. Facchetti, S. Barlow, T. J. Marks, M. A. Ratner, M. R. Wasielewski and S. R. Marder, Adv. Mater., 2011, 23, 268–284 CrossRef PubMed.
- (a) Y. Jiang, Y. Wang, J. Hua, J. Tang, B. Li, S. Qian and H. Tian, Chem. Commun., 2010, 46, 4689–4691 RSC; (b) B. Wang, Y. Wang, J. Hua, Y. Jiang, J. Huang, S. Qian and H. Tian, Chem.–Eur. J., 2011, 17, 2647–2655 CrossRef PubMed.
- (a) W. Li, Y. Pan, R. Xiao, Q. Peng, S. Zhang, D. Ma, F. Li, F. Shen, Y. Wang, B. Yang and Y. Ma, Adv. Funct. Mater., 2014, 24, 1609–1614 CrossRef; (b) H. Liu, Q. Bai, L. Yao, H. Zhang, H. Xu, S. Zhang, W. Li, Y. Gao, J. Li, P. Lu, H. Wang, B. Yang and Y. Ma, Chem. Sci., 2015, 6, 3797–3804 RSC; (c) S. Zhang, L. Yao, Q. Peng, W. Li, Y. Pan, R. Xiao, Y. Gao, C. Gu, Z. Wang, P. Lu, F. Li, S. Su, B. Yang and Y. Ma, Adv. Funct. Mater., 2015, 25, 1755–1762 CrossRef; (d) Y. Zhang, K. Wang, G. Zhuang, Z. Xie, C. Zhang, F. Cao, G. Pan, H. Chen, B. Zou and Y. Ma, Chem.–Eur. J., 2015, 21, 2474 CrossRef PubMed.
- Z. R. Grabowski, K. Rotkiewicz and W. Rettig, Chem. Rev., 2003, 103, 3899–4031 CrossRef PubMed.
- Y. Zhang, M. Qile, J. Sun, M. Xu, K. Wang, F. Cao, W. Li, Q. Song, B. Zou and C. Zhang, J. Mater. Chem. C, 2016, 4, 9954 RSC.
- S. Zhang, W. Li, L. Yao, Y. Pan, F. Shen, R. Xiao, B. Yang and Y. Ma, Chem. Commun., 2013, 49, 11302–11304 RSC.
- R. L. Martin, J. Chem. Phys., 2003, 118, 4775–4777 CrossRef.
- (a) P. S. Hariharan, J. Pitchaimani, V. Madhu and S. P. Anthony, Opt. Mater., 2017, 64, 53–57 CrossRef; (b) P. S. Hariharan, E. M. Mothi, D. Moon and S. P. Anthony, ACS Appl. Mater. Interfaces, 2016, 8, 33034–33042 CrossRef PubMed.
Footnote |
| † Electronic supplementary information (ESI) available. See DOI: 10.1039/c8ra03598a |
| This journal is © The Royal Society of Chemistry 2018 |

