 Open Access Article
CeO2-modified P2–Na–Co–Mn–O cathode with enhanced sodium storage characteristics
Yanzhi Wang *ab and
Jiantao Tanga
aHebei Key Laboratory of Applied Chemistry, College of Environmental and Chemical Engineering, Yanshan University, Qinhuangdao, Hebei 066004, China. E-mail: hhwyz@ysu.edu.cn; Fax: +86 335 8061569; Tel: +86 335 8061569
bState Key Laboratory of Metastable Material Science and Technology, Yanshan University, Qinhuangdao, 066004, China
First published on 3rd July 2018
Abstract
To improve the cycling stability and dynamic properties of layered oxide cathodes for sodium-ion batteries, surface modified P2–Na0.67Co0.25Mn0.75O2 with different levels of CeO2 was successfully synthesized by the solid-state method. X-ray photoelectron spectra, X-ray diffraction and Raman spectra show that the P2-structure and the oxidation state of cobalt and manganese of the pristine oxide are not affected by CeO2 surface modification, and a small amount of Ce4+ ions have been reduced to Ce3+ ions, and a few Ce ions have entered the crystal lattice of the P2-oxide surface during modification with CeO2. In a voltage range of 2.0–4.0 V at a current density of 20 mA g−1, 2.00 wt% CeO2-modified Na0.67Co0.25Mn0.75O2 delivers a maximum discharge capacity of 135.93 mA h g−1, and the capacity retentions are 91.96% and 83.38% after 50 and 100 cycles, respectively. However, the pristine oxide presents a low discharge capacity of 116.14 mA h g−1, and very low retentions of 39.83% and 25.96% after 50 and 100 cycles, respectively. It is suggested that the CeO2 modification enhances not only the maximum discharge capacity, but also the electric conductivity and the sodium ion diffusivity, resulting in a significant enhancement of the cycling stability and the kinetic characteristics of the P2-type oxide cathode.
1 Introduction
As secondary batteries, lithium ion batteries (LIBs) still dominate power supplies to electric vehicles and portable devices due to their high energy density, long life, high charging efficiency and wide operating temperature range.1–3 However, the scarcity of Li-deposits in the earth's crust, the high cost of lithium, and safety concerns about operation under extreme conditions restrict their applications in large-scale energy storage systems. In contrast, sodium ion batteries (SIBs) are seen as the most promising candidates because of rich resources, low cost and decent gravimetric energy density.4–6 In recent years, layered transition metal oxides, NaxMO2 (M = transition metals),5–15 as cathodes for SIBs exhibit various advantages such as simple structure, good electrochemical performance and ease of synthesis, in which the electrochemical performance of a P2 type oxide is better than that of an O3 type oxide.7–9 In addition, it has been reported that the electrochemical performance of P2-type Mn-based layered oxide is better than that of P2-type Co-based layered oxide, and among Mn-based layered transition metal oxides, Na–Mn–Co–O-based materials have been considered to be suitable SIBs cathode materials due to their stability in air and high theoretical capacity.5 For example, the cathode material P2–Na0.67Co0.5Mn0.5O2 with hierarchical architectures was prepared by sol–gel route and delivered a high discharge capacity of 147 mA h g−1 at 0.1C rate with nearly 100% capacity retention at least 100 cycles at 1C. However, the material is high cost because of the high cobalt content,13 which will restrict its large-scale application. The layered nanosheets P2–Na0.4Mn0.54Co0.46O2 were synthesized by a one-step solid-state reaction method, and exhibited a high reversible capacity of 151 mA h g−1 and a capacity retention of 65% after 65 cycles at a current of 20 mA g−1 in the voltage range of 1.5–4.2 V.14 P2–Na0.67[Ni0.4Co0.2Mn0.4]O2 was obtained by solid-state method and cooling naturally in the furnace, and delivered an initial discharge capacity of 123 mA h g−1 with a retention of 61% at 0.1C in the voltage range of 1.5–4.2 V after 55 cycles.15 P2-type Na0.67Co0.25Mn0.65Cr0.10O2 oxide delivered the maximum discharge capacity of 128.1 mA h g−1 in the potential region of 2.0–4.0 V at 0.12C with the capacity retention of 66.35% after 100 cycles.16 As Bucher and coworkers reported,17 P2-type NaxMnO2 and NaxCo0.1Mn0.9O2 were prepared in two different morphologies of hexagonal flakes and hollow spheres, and the hollow spheres have higher specific capacity and the capacity retention than the flakes for both doped and undoped material, and the Co-doped spheres NaxCo0.1Mn0.9O2 exhibited a the first discharge capacity of 183 mA h g−1 after an initial charge capacity of 55 mA g−1 with the capacity retention of 75% after 100 cycles and 67% at 150 cycles, and a relatively small amount of Co-dopping is beneficial to suppress the structural transformations together with Na+ ordering processes, as well as a positive influence on Na+ transport in the structure. Although the above Na–Mn–Co–O-based materials with low cobalt content show many advantages such as low cost, low toxicity, high safety on overcharge and high specific capacity, these materials also suffer from the large irreversible capacity loss in the initial cycle, severe capacity fading during cycling and poor rate performance like the other P2 layered oxides, resulting from phase transition and severe side reaction in a high cut-off voltage as they directly contact with electrolyte,14,17–19 which hinders their practical applications. In this regard, the significant efforts, including cation substitution10–20 and surface modification4,18,21–24 have been made to overcome the above drawbacks of the P2-type layered oxides.25Surface modification with the inert/active compound has been proven to be an effective approach in improving the cyclic stability and thermal stability of various electrode materials at high cut-off potentials by preventing the direct contact between active particles and electrolyte, and decreasing the side reaction and elemental dissolution during the cycling.2–4,21–35 At present, several kinds of inorganic materials have been used for surface modification on electrode materials, mainly including metal oxides,4,21–28 metal fluorides,28,29 carbon material,18,32 and other materials.33–35 For instance, Na2/3[Ni1/3Mn2/3]O2 was synthesized by solid state reaction, and delivered an initial capacity of 160 mA h g−1 in a voltage range of 2.5–4.3 V at a current density of 0.5C, and Al2O3 surface modified Na2/3[Ni1/3Mn2/3]O2 delivered a similar initial capacity of 160 mA h g−1, but the capacity retention rate increased from 28.0% to 73.2% after 300 cycles.23 Na0.5Ni0.33Mn0.67O2 presented initial discharge capacity around 119 mA h g−1 within 2.20–4.25 V with the final capacity retention was 70.75% until 100th cycle, and the MgO-coated Na0.5Ni0.33Mn0.67O2 delivered an initial capacity increased to 131 mA h g−1 in the voltage range of 2.0–4.5 V, and the increased capacity retention was 96.45% after 70 cycles.4 However, most of the materials used for modification are insulators, possessing less transportation capability for electrons or ions in the modification layer. It was reported that CeO2 could accelerate electron transfer between CeO2 oxide and the supported active material, and supplies a good conductive connection between the active particles and decreases the charge transfer resistance and electrode polarization, and then improves the electrochemical performance of electrode materials.28,36–38 For example, the sample Li4Ti5O12 presented capacity ∼80 mA h g−1 at 10C rate with the capacity retention of only 40% after 50 cycles, the sample Ce and CeO2 modified Li4Ti5O12 with Ti/Ce = 4.85![[thin space (1/6-em)]](https://www.rsc.org/images/entities/char_2009.gif) :
:![[thin space (1/6-em)]](https://www.rsc.org/images/entities/char_2009.gif) 0.15 delivered a capacity of 161 mA h g−1 at same rate with the capacity retention of 100% after 50 cycles.36 At 5C charge–discharge rate, the pristine Li5Cr7Ti6O25 only exhibited an initial charge capacity of ∼94.7 mA h g−1, and the capacity only maintained 87.4 mA h g−1 after 100 cycles. However, Li5Cr7Ti6O25@CeO2 (3 wt%) presented an initial charge capacity of 107.5 mA h g−1, and the capacity also reached 100.5 mA h g−1 even after 100 cycles.37 In addition, compared with the pristine LiNi0.5Mn1.5O4, the cathode material LiNi0.5Mn1.5O4–CeO2 (3 wt%) exhibited outstanding discharge capacity, cycling stability and rate capability.28 D. Arumugam et al. investigated nano-CeO2-coated LiMn2O4 cathode for rechargeable lithium ion batteries, and suggested that surface modification was an effective way to improve the chemical stability of the electrode and their cyclability and rate capability during long-term cycles.39 M. Michalska et al. demonstrated that surface modification with 1 wt% CeO2 improved cycle stability of LiMn2O4, and CeO2 acted as both conductive additive, increasing the electrical conductivity of the material, and as a medium, preventing a material from degradation during cycles, and the increase in cycle life may be due to CeO2 limiting the dissolution of manganese into electrolyte through reduced contact area.40 Some researchers studied that the structures, and cyclic stability and rate performance of CeO2-coated Li[Ni0.5Co0.2Mn0.3]O2 samples, and revealed that the enhanced electrochemical characteristics could be attributed to the decrease of the interfacial polarization and stabilization of the oxide structure by CeO2 coating.41,42 Y. Wu, et al. modified (1 − z) Li[Li1/3Mn2/3]O2 − (z) Li[Mn0.5−yNi0.5−yCo2y]O2 layered solid solutions with 3 wt% Al2O3, CeO2, ZrO2, SiO2, ZnO, respectively, and demonstrated that surface modification may be an effective way to decrease the irreversible capacity and maximize the discharge capacity for the layered oxide cathodes.43 W. Yuan et al. modified the Li-rich layered oxide Li(Li0.17Ni0.2Co0.05Mn0.58)O2 with hexagonal α-NaFeO2 structure by using CeO2 nanocrystallites, and the CeO2-modified layered oxide presented higher discharge capacity, lower charge transfer resistance, and larger initial coulombic efficiency than the pristine oxide.44 However, we have not found the modification of P2 oxide with CeO2.
0.15 delivered a capacity of 161 mA h g−1 at same rate with the capacity retention of 100% after 50 cycles.36 At 5C charge–discharge rate, the pristine Li5Cr7Ti6O25 only exhibited an initial charge capacity of ∼94.7 mA h g−1, and the capacity only maintained 87.4 mA h g−1 after 100 cycles. However, Li5Cr7Ti6O25@CeO2 (3 wt%) presented an initial charge capacity of 107.5 mA h g−1, and the capacity also reached 100.5 mA h g−1 even after 100 cycles.37 In addition, compared with the pristine LiNi0.5Mn1.5O4, the cathode material LiNi0.5Mn1.5O4–CeO2 (3 wt%) exhibited outstanding discharge capacity, cycling stability and rate capability.28 D. Arumugam et al. investigated nano-CeO2-coated LiMn2O4 cathode for rechargeable lithium ion batteries, and suggested that surface modification was an effective way to improve the chemical stability of the electrode and their cyclability and rate capability during long-term cycles.39 M. Michalska et al. demonstrated that surface modification with 1 wt% CeO2 improved cycle stability of LiMn2O4, and CeO2 acted as both conductive additive, increasing the electrical conductivity of the material, and as a medium, preventing a material from degradation during cycles, and the increase in cycle life may be due to CeO2 limiting the dissolution of manganese into electrolyte through reduced contact area.40 Some researchers studied that the structures, and cyclic stability and rate performance of CeO2-coated Li[Ni0.5Co0.2Mn0.3]O2 samples, and revealed that the enhanced electrochemical characteristics could be attributed to the decrease of the interfacial polarization and stabilization of the oxide structure by CeO2 coating.41,42 Y. Wu, et al. modified (1 − z) Li[Li1/3Mn2/3]O2 − (z) Li[Mn0.5−yNi0.5−yCo2y]O2 layered solid solutions with 3 wt% Al2O3, CeO2, ZrO2, SiO2, ZnO, respectively, and demonstrated that surface modification may be an effective way to decrease the irreversible capacity and maximize the discharge capacity for the layered oxide cathodes.43 W. Yuan et al. modified the Li-rich layered oxide Li(Li0.17Ni0.2Co0.05Mn0.58)O2 with hexagonal α-NaFeO2 structure by using CeO2 nanocrystallites, and the CeO2-modified layered oxide presented higher discharge capacity, lower charge transfer resistance, and larger initial coulombic efficiency than the pristine oxide.44 However, we have not found the modification of P2 oxide with CeO2.
Herein, we have synthesized Na0.67Co0.25Mn0.75O2 oxide using a solid-state method, and the oxide was subsequently surface-modified with CeO2 by the same method. Microstructure analyses indicate that the P2-type structure of the pristine oxide has not been changed by CeO2 surface modification, and a small amount of Ce4+ ions have been reduced to Ce3+ ions, and which might have entered the crystal lattice of the P2-oxide during the synthesis. 2.00 wt% CeO2-modified Na0.67Co0.25Mn0.75O2 exhibits a maximum discharge capacity of 135.93 mA h g−1 with the retention of 91.96% and 83.38% after 50 and 100 cycles in a voltage range of 2.0–4.0 V at a current density of 20 mA g−1. Besides, the kinetic characteristics of P2-type oxide cathode have been improved by CeO2 modification.
2 Experimental section
2.1 Material synthesis
The layered oxide Na0.67Co0.25Mn0.75O2 (NCMO) was prepared by simple solid-state method.16 The reagent specifications are anhydrous sodium acetate (Kermel, ≥99.0%), manganese(II) acetate tetrahydrate (Sinopharm, ≥99.0%) and cobalt acetate tetrahydrate (Kermel, ≥99.5%), and ceria (Sigma Aldrich, ≥98%). The mixture of NCMO and appropriate ceria with ethanol as the dispersant was ball milled for 12 hours, the resultant precursor was subsequently calcined at 900 °C for 12 hours in the muffle furnace to obtain NCMO-x wt% CeO2 (x = 0, 1.00, 2.00 and 3.00) composites, in which the weight ratio of CeO2 was 1.00 wt%, 2.00 wt% and 3.00 wt% of the total mass of the sample, respectively.2.2 Structural and material characterization
The structures of the materials were characterized by X-ray diffraction (XRD) (SmartLab) and Raman spectroscopy (HORIBA). The morphologies and elemental distributions were characterized using field-emission scanning electron microscope (FESEM) (S-4800) and transmission electron microscopy (TEM) (JEM-2010) and energy dispersive spectroscopy (EDS). The chemical states of the samples were measured by X-ray photoelectron spectroscopy (XPS) (ESCALAB 250Xi).2.3 Electrochemical characterization
The electrochemical performances of NCMO and NCMO-x wt% CeO2 (x = 0, 1.00, 2.00 and 3.00) cathodes were tested using Swagelok type cells. The working electrode was prepared by mixing 80 wt% of the active material, 10 wt% of acetylene black and 10 wt% of polyvinylidene fluoride (PVDF), and the appropriate amount of N-methyl-2-pyrrolidone (NMP), and grinding to form the slurry. The slurry was subsequently coated on a Al collector and dried at 120 °C for 12 hours in a vacuum oven, the Al foil was cut into a diameter of 1.1 cm discs, the loading of active material is about 2 mg cm−1. Sodium metal and celgard 2400 were used as the negative electrode and separator, respectively. Liquid electrolyte contained 1.0 M NaClO4 dissolved in propylene carbonate (PC) with 3 vol% fluoroethylene carbonate (FEC). The Swagelok type cell was assembled in an argon-filled glove box with the concentrations of moisture and oxygen below 0.1 ppm. The half cells tests were carried out on a multi-channel battery test system (BTS-5V 10 mA) with galvanostatic charge and discharge at various current densities between the voltage windows of 2.0–4.0 V. Cyclic voltammetry (CV) was tested at a scan rate of 0.1 mV s−1, and electrochemical impedance spectroscopy (EIS) measurements were performed with the frequency ranging from 100 kHz to 10 mHz and an amplitude of 5 mV on the CHI660E electrochemical workstation.3 Results and discussion
Fig. 1 presents XPS patterns and the corresponding deconvolution results of Mn 2p, Co 2p and Ce 3d peaks for NCMO-x wt% CeO2 (x = 0, 1.00, 2.00 and 3.00) composites. As shown in Fig. 1a, two characteristic peaks at 642.2 eV and 653.7 eV are associated with Mn 2p3/2 and Mn 2p1/2, respectively, which is assigned to Mn4+ oxidation state.4,9,16 Fig. 1b exhibits two major peaks at the binding energies of 780.5 eV and 795.2 eV, corresponding to Co 2p3/2 and Co 2p1/2, respectively, which implies the presence of a typical Co3+ oxidation state.16,45 The above results confirm that CeO2 surface modification doesn't change the oxidation state of Mn and Co elements in the pristine material. As shown in Fig. 1c, XPS Ce 3d core levels spectra can be deconvolved into eight Gaussian-peaks, corresponding to four pairs of spin–orbit doublets with the spin–orbits splitting of 18.4 eV, respectively. The peaks labeled as U′′′(∼916 eV), U′′(∼907 eV) and U(∼901 eV) originate from 3d3/2, and the peaks marked as V′′′(∼897 eV), V′′(∼889 eV) and V(∼881 eV) arise from 3d5/2, and are characteristics of Ce(IV) final states, while the couple peaks of U′(∼903 eV) and V′(∼884 eV) refer to 3d3/2 and 3d5/2, respectively, and are from Ce(III) final states.38,46 This indicates that Ce3+ and Ce4+ are all coexisted in the CeO2-modified P2–Na0.67Co0.25Mn0.75O2 samples. Unfortunately, we have no condition to test the oxidation state of cerium ions entering the crystal cell. The existence of Ce3+ also implies the generation of more defects in the composites than that in the pristine NCMO material.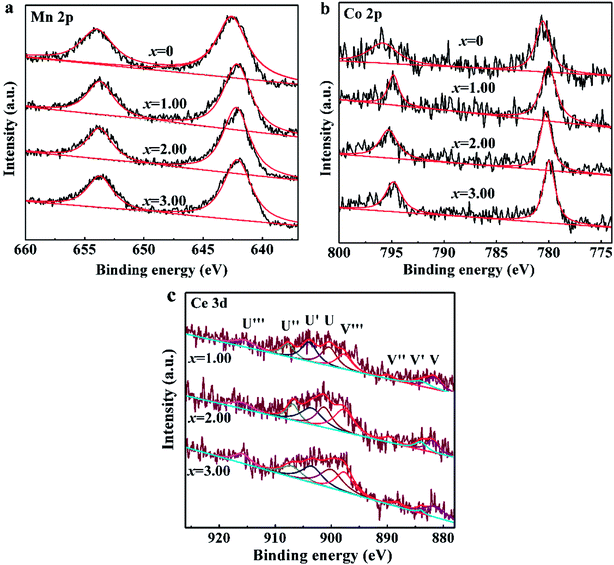 | ||
| Fig. 1 XPS patterns of NCMO-x wt% CeO2 (x = 0, 1.00, 2.00 and 3.00) composites, (a) Mn 2p, (b) Co 2p, (c) Ce 3d. | ||
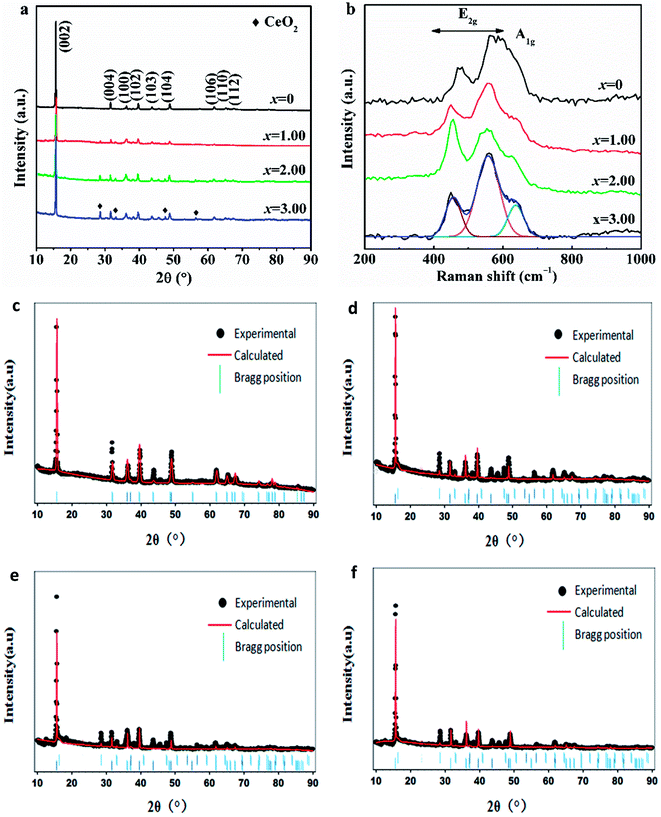
Fig. 2a indicates the XRD patterns of NCMO-x wt% CeO2 (x = 0, 1.00, 2.00 and 3.00) composites. As can be seen, each sample presents the strongest (002) peak of a layered P2-type oxide, and all the main diffraction peaks can be indexed into a hexagonal P63/mmc (P2-type) phase (JCPDS no. 54-0894).9–11 Besides the main P2-type phase, additional diffraction peaks are also observed in the XRD patterns of the CeO2-modified NCMO composites, which attributes to CeO2, and the intensity of the additional peak increases with. the increasing CeO2 amount. The lattice parameters of NCMO and CeO2-modified NCMO composites by the Rietveld refinement are tabulated in Table 1. It presents that the lattice parameters of the main phases for CeO2-modified NCMO composites are larger than that of the pristine NCMO, which confirms that a few Ce ions have entered the composite crystal lattice after surface modification with CeO2 because of Ce ion with a larger size than that of Mn ion. This is consistent with the result from Ce 3d XPS spectra. The similar phenomenon also appeared in some literatures,38,46 for example, Li4Ti5O12 was doped with various dopping level Ce3+ accompanied by the occurrence of CeO2 surface modification.38 The dopping of Ce4+ and the combination with in situ generated CeO2 in Li4Ti5O12 were favorable for improving the lithium insertion/extraction kinetics of Li4Ti5O12.36 It was reported that a few Ce4+ ions entered the crystal lattice of Li5Cr7Ti6O25 and then increased the lattice parameter during CeO2 coating, and Li5Cr7Ti6O25@3wt.%CeO2 electrode showed a better electrochemical activity than that of the pristine Li5Cr7Ti6O25.37 In general, the a-axis expansion will lead to the better stability of P2-type material, and the c-axis expansion will lead to enlarged path and increased rate of Na+ migration in the material, which illustrates that both the stability and dynamics of NCMO cathode would be enhanced by Ce ion dopping during CeO2 surface modification. In addition, it can also be seen that the lengths of a-axis and c-axis for NCMO-2.00 wt% CeO2 material are the largest among the four samples, respectively, which indicates that this composite would exhibit the best cyclability and dynamics as a cathode of SIBs among the four oxides.
| Sample | a (Å) | b (Å) | c (Å) | RP | RWP |
|---|---|---|---|---|---|
| NCMO | 2.848 | 2.848 | 11.166 | 9.743 | 11.342 |
| NCMO-1.00wt% CeO2 | 2.865 | 2.865 | 11.242 | 9.792 | 11.324 |
| NCMO-2.00wt% CeO2 | 2.879 | 2.879 | 11.324 | 9.412 | 11.317 |
| NCMO-3.00wt% CeO2 | 2.866 | 2.866 | 11.271 | 9.691 | 11.237 |
To further study the structural effect of CeO2 surface modification on NCMO sample, Raman spectra have been measured. Fig. 2b exhibits the Raman spectra of NCMO-x wt% CeO2 (x = 0, 1.00, 2.00 and 3.00) composites. It presents that the two peaks between 400 cm−1 and 600 cm−1, corresponding to the active E2g modes due to Na and O vibrations, and a shoulder peak at around 637 cm−1, which can be assigned to A1g mode due to O vibrations.16,47 These peaks further demonstrate that the layered P2-type structure has not been changed after CeO2 surface modification, which is highly matched to the above XRD results.
Fig. 3 shows FESEM images of NCMO-x wt% CeO2 (x = 0, 1.00, 2.00 and 3.00) composites. It is clear that all samples have similar flake shapes, in which the surface of NCMO sample is smooth, and there are some particles in the surface of CeO2-modified NCMO composites. Fig. 4 indicates EDS elementary mapping images of NCMO-x wt% CeO2 (x = 0, 2.00) composites. The elements of Na, Co, Mn, O and Ce are uniformly distributed in the samples. TEM images of NCMO-x wt% CeO2 (x = 0, 1.00, 2.00 and 3.00) composites are shown in Fig. 5. As can be seen, the surface of NCMO sample in the three composites has been successfully modified by CeO2, which can effectively prevent the aggregation between the composites particles. To clarify the effects of the CeO2 surface modification on the kinetic properties of NCMO electrode, the electrochemical impedance spectra of the four samples were performed on fresh cells at the frequency range from 100 kHz to 10 mHz. The Nyquist plots of NCMO-x wt% CeO2 (x = 0, 1.00, 2.00 and 3.00) samples are given in Fig. 6a. The EIS plots are composed of two well-separated semicircles at high and intermediated frequency region and an oblique line in the low-frequency region. In the equivalent circuit shown in the inset of Fig. 6a, the electrolyte resistance (Rs) is mainly related to the high-frequency intercept at the Zreal axis, the SEI film resistance (Rf) originates from the semicircle in the high frequency region, and the charge-transfer resistance (Rct) is related to the second semicircle in the middle frequency, which reflects the intercalation kinetics of the electrodes, and Warburg impedance (W) is connected with the slope in the low-frequency region, reflecting the intra-electrode mass diffusion.15,16 The EIS analysis results of the four samples are listed in Table 2. As shown, the small change in Rs values between 7.1 and 17.2 could have no significant effect on the dynamic characteristics of electrodes. Before increasing CeO2 content up to 2.00 wt%, the Rct values for NCMO-x wt% CeO2 electrodes decrease notably from 1589.0 Ω (x = 0) to 149.2 Ω (x = 2.00), and then increase to 562.7 Ω (x = 3.00) as x further increases. NCMO-2.00 wt% CeO2 composite attains the best conductivity. It is suggested that the appropriate CeO2 surface modification is beneficial for the improvement of the charge transportation between the NCMO electrode and the electrolyte interface, and then enhances conductivity of the active materials during cycling.28 The reasons may be as follows: crystal lattice defects may be induced by Ce ions entering NCMO lattice, which is beneficial to the charge transfer inside NCMO lattice. Besides, CeO2 with a high electrical conductivity enhances the total electrical conductivities of the composite electrodes.36 Compared to Rct change, the values of Rf for the four electrodes have the similar rules, which suggests that the electrolyte decomposition, disadvantageous SEI film, and the Mn3+-ion dissolution during the cycling process can be suppressed by appropriate CeO2 modification.28 This will be beneficial to enhance the cycling stability of the composites. In addition, the sodium ion diffusion coefficients (D) can be calculated from the oblique line in the low-frequency region according to the eqn (1):16,36
| D = R2T2/(2A2n4F4C2σ2) | (1) |
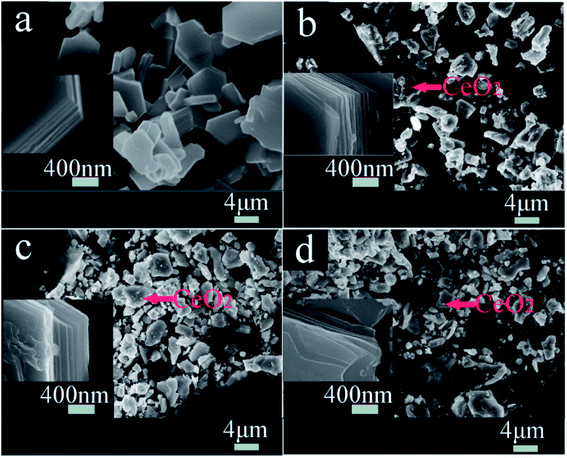 | ||
| Fig. 3 FESEM images of NCMO-x wt% CeO2 (x = 0, 1.00, 2.00 and 3.00) composites, (a) x = 0, (b) x = 1.00, (c) x = 2.00, (d) x = 3.00. | ||
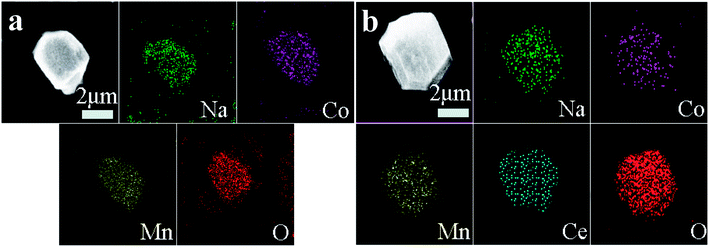 | ||
| Fig. 4 EDS elementary mapping images of NCMO-x wt% CeO2 (x = 0, 2.00) composites, (a) x = 0, (b) x = 2.00. | ||
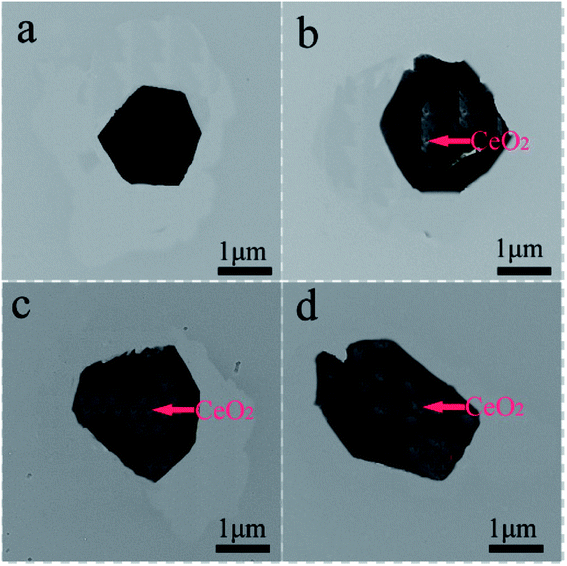 | ||
| Fig. 5 TEM images of NCMO-x wt% CeO2 (x = 0, 1.00, 2.00 and 3.00) composites, (a) x = 0, (b) x = 1.00, (c) x = 2.00, (d) x = 3.00. | ||
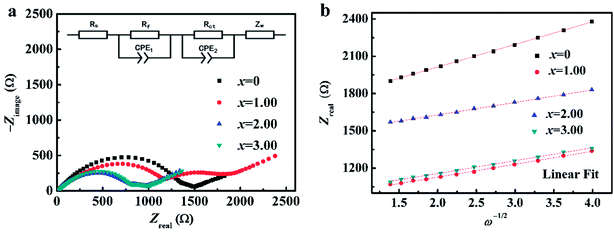 | ||
| Fig. 6 (a) EIS Nyquist plots of NCMO-x wt% CeO2 (x = 0, 1.00, 2.00 and 3.00) composites and the equivalent circuit in inset, and (b) their linear fitting of the Zreal versus ω−1/2. | ||
| Cathode | Impedance parameters (Ω) | Na+ diffusion coefficient (×10−13, cm2 s−1) | ||
|---|---|---|---|---|
| Rs | Rf | Rct | ||
| NCMO | 13.1 | 1484.0 | 1589.0 | 2.68 |
| NCMO-1.00 wt% CeO2 | 11.2 | 1363.0 | 1225.0 | 8.21 |
| NCMO-2.00 wt% CeO2 | 7.1 | 853.7 | 149.2 | 8.77 |
| NCMO-3.0 wt% CeO2 | 17.2 | 902.6 | 562.7 | 8.30 |
Here, R, T, A, n, F and C are fixed values, which corresponds to the gas constant, the absolute temperature, the surface area of the electrode, the number of electrons per reaction, the Faraday constant, and the concentration of Na+ in the material, respectively. Warburg factor σ can be related to Zreal as the eqn (2):16,28
| Zreal = Rs + Rct + σω−1/2 | (2) |
In this equation, ω is the angular frequency, and σ value can be obtained from the slope of the fitting line in the Fig. 6b. The calculated results are also summarized in the Table 2. The apparent Na+ diffusion coefficients in NCMO-x wt% CeO2 (x = 0, 1.00, 2.00 and 3.00) electrodes significantly increase from 2.68 × 10⁻¹³ cm2 s−1 to 8.77 × 10⁻¹³ cm2 s−1 as x increases up to 2.00, and then decrease to 8.30 × 10⁻¹³ cm2 s−1 with further increasing x to 3.00. The above composite electrodes have higher apparent sodium-ion diffusion coefficients than that of the pristine one, indicating that the former has higher electrochemical activity during cycling. These results assuredly indicate that the sodium-ion transfer ability in NCMO electrode can be effectively improved by CeO2 modification.36,37 Apparently, the high Na+ diffusion coefficient for the CeO2 modified NCMO electrode should be attributed to the stable structure and wider track of Na+ migration. Among the four samples, NCMO-2.00 wt% CeO2 has the highest sodium-ion diffusion, which is consistent with the longest length of c-axis. From the above findings, the amount of CeO2 must be properly optimized to improve sodium-ion migration and enhance rate performance. Moreover, NCMO-1.00 wt% CeO2 and NCMO-3.00 wt% CeO2 composites show shorter c-axis than that of the pristine NCMO, whereas the former shows bigger apparent Na+ diffusion coefficients than that of the pristine one. This can be explained by the effect of Ce ions entering into the lattice of NCMO material, which has induced the lattice defects, and then provides more paths to facilitate the sodium ions to diffuse in the composites. However, too much CeO2 modification on the NCMO particle surface may suppress the migration of sodium ions to the interface,37 which is unfavorable for the improvement of the kinetic characteristics.
Fig. 7 shows the galvanostatic charge and discharge curves of NCMO-x wt% CeO2 (x = 0, 1.00, 2.00 and 3.00) cathodes at a current density of 20 mA g−1. It can be seen that all the discharge curves resemble slopping curves. This suggests that the principal mechanism of the charge/discharge process is based on a solid-solution process, which is evidence of the structural stability of the materials. It is evident that all the charge curves show similar shapes, two well-defined regions in the each curve can be observed, an oblique plateau at about 2.4 V, which is attributed to the Mn4+/Mn3+ and (or) Co3+/Co2+ redox couples, and another a visible short-flat voltage at around 3.5 V, corresponding to Co4+/Co3+ redox couples.13,14,16,17 This is in accordance with the redox peaks in the above CV profile. The above phenomenon indicates that the principal mechanism in the sodiation/desodiation process for the material has not been changed by CeO2 surface modification. In addition, surface modification of CeO2 remarkably decreased the initial charge specific capacity because more vacancies have probably been induced by CeO2 modification to provide sufficient active sites for sodium ions insertion in the subsequent discharge process.44 The maximum discharge capacity of NCMO-x wt% CeO2 cathode enhances from 116.14 mA h g−1 to 135.93 mA h g−1 as CeO2 content increases up to 2.00 wt%, and then decreases to 122.88 mA h g−1 with increasing CeO2 level to 3.00 wt%, which indicates that moderate Ce ions dopping and CeO2 modification can enhance the discharge capacity of NCMO at a low rate.28,37 We suggested that Ce ions dopping is more effective than CeO2 modifying for increasing the maximum discharge capacity. The cathodes NCMO-x wt% CeO2 (x = 0, 1.00, 2.00 and 3.00) attain their maximum discharge capacity at 1, 2, 5 and 4 cycles, respectively, which indicates that CeO2-modified NCMO cathodes need a few activation numbers. This may be due to the fact that CeO2 has no electrochemical activity, and electrolyte decomposition and the formation of an SEI (solid-electrolyte interface) layer, causing irreversible capacity loss during the initial cycles, were suppressed on the CeO2-modified NCMO surface.39 As is known to all, the electrode materials synthesized by the solid-state method have a lower homogeneity than that of the materials prepared by a soft chemical method. However, the composites NCMO-x wt% CeO2 cathodes also show high discharge capacities. This indicates that moderate CeO2 modification can enhance the discharge capacity of NCMO material.28,36
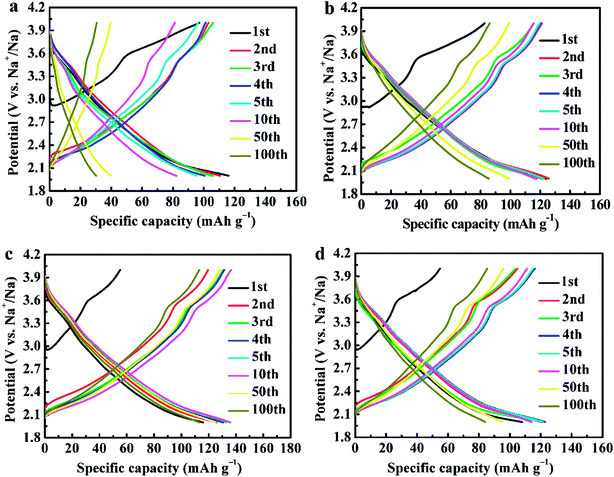 | ||
| Fig. 7 The galvanostatic charge and discharge curves of NCMO-x wt% CeO2 (x = 0, 1.00, 2.00 and 3.00) cathodes, (a) x = 0, (b) x = 1.00, (c) x = 2.00, (d) x = 3.00. | ||
Fig. 8a shows CV curves of NCMO-x wt% CeO2 (x = 0, 1.00, 2.00 and 3.00) electrodes. It reveals that there are the similar overall profiles with multiple peaks within 2.0–4.0 V, which confirms the high similarity of redox reaction mechanism in the process of Na+ intercalation/deintercalation. These peaks can be divided into two groups, the peaks at low voltages (<3.0 V vs. Na+/Na) can be associated with the redox process of Mn4+/Mn3+ and (or) Co3+/Co2+, and the peaks between 3.0 to 4.0 V can be can be attributed to Co4+/Co3+ redox couple.16,17 Obviously, the area of CV curve for the composite NCMO-2.0 wt% CeO2 is the largest, which implies that the composite would have the highest specific capacity among the four samples. This is highly matched to the above charge and discharge curves.
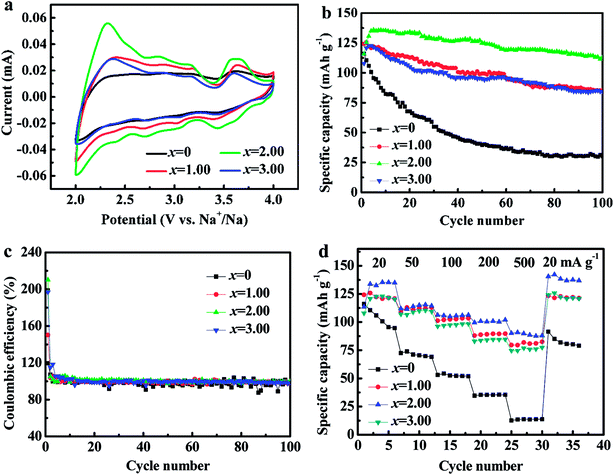 | ||
| Fig. 8 (a) Cyclic voltammogram curves, (b) cycling stability, (c) the coulombic efficiencies, and (d) the rate performance of NCMO-x wt% CeO2 (x = 0, 1.00, 2.00 and 3.00) cathodes. | ||
Fig. 8b and c present the cycling performance and the corresponding coulombic efficiencies of the four cathodes at a current density of 20 mA g−1, respectively. As shown, the capacity retentions of NCMO-x wt% CeO2 (x = 0, 1.00, 2.00 and 3.00) cathodes after 50 cycles are 34.29%, 79.05%, 91.96% and 77.46%, respectively, and after 100 cycles, the retentions of the four cathodes are accordingly 25.96%, 68.03%, 83.30% and 68.36%, respectively, in which NCMO-2.0 wt% CeO2 cathode exhibits the best cyclic stability. The above results confirm that the cycling stability of NCMO cathode can be evidently enhanced by CeO2 surface modification. The reasons for the improvement are as follows: first of all, the a-axis expansion leads to the better cycling stability of NCMO cathode by Ce ions dopping during CeO2 surface modification. Secondly, Mn3+ in NCMO cathode from the charge compensation easily causes Jahn–Taller distortion during cycles,15–19 which may be suppressed by proportionate CeO2 modification. Thirdly, Mn3+ is easy to dissolve into electrolyte during charge and discharge of the NCMO material, which is probably suppressed by optimal CeO2 modification.28,36 Fourthly, as mentioned above, the SEI film resistance for NCMO-x wt% CeO2 (x = 0, 1.00, 2.00 and 3.00) electrodes decreases from 1484.0 Ω (x = 0) to 853.7 Ω (x = 2.00) and then increases to 902.6 Ω (x = 3.00) with increasing CeO2 content, and reaches the lowest values at 2.00 wt% CeO2, which is another evidence for improving the cyclic stability of the pristine NCMO material by CeO2 surface modification. Moreover, the coulombic efficiencies are close to 100% except for the initial cycles for the CeO2-modified NCMO materials, showing good cycling stability. We suggested that CeO2 modifying is more effective than Ce ions dopping for improving cycle stability.
Fig. 8d exhibits that the rate performance of NCMO-x wt% CeO2 (x = 0, 1.00, 2.00 and 3.00) cathodes. As can be seen, the rate performances of CeO2-modified NCMO cathodes significantly outperform that of the pristine NCMO. For example, at a current density of 500 mA g−1, the mean discharge capacity of NCMO-2.00 wt% CeO2 composite is about 7 times as much as that of the pristine oxide. In addition, NCMO-2.00 wt% CeO2 cathode still delivers a high mean discharge capacity of 100.64 mA h g−1 at a current density of 200 mA g−1, and reducing the current density from 500 mA g−1 to 20 mA g−1, the average discharge capacity of the each CeO2-modified NCMO cathode is close to its maximum discharge capacity. These results imply that CeO2 surface modification is conducive to the reversible intercalation and deintercalation of Na+ in NCMO material. This is probably attributed to the protection of CeO2 particles on the surface of NCMO, suppressing the structural damage at high current density,36,48 and the c-axis expansion, leading to enlarged path and increased rate of Na+ migration in the material, and the decrease of the charge-transfer resistance and the increase of the apparent Na+ diffusion coefficients, improving the electrode dynamics during cycling. In addition, it is reported the internal ions adsorption on the CeO2 surface may bring about the space-charge effect,49 increasing the positive ion vacancy concentration at the CeO2 interface, which results in the wonderful electrical contact, and the good transmission efficiency of electrons and Na+ between the NCMO and CeO2, and then obviously enhances the desodiation and sodiation capacity and cycling stability at high current density because of CeO2 modification.37,38 We suggested that Ce ions dopping as important as CeO2 modifying for improving the rate performance.
4 Conclusion
In this work, CeO2-modified Na0.67Co0.25Mn0.75O2 composites were successfully synthesized by the solid-state method. P2-type layered structure and the oxidation states of Mn and Co elements in the pristine Na0.67Co0.25Mn0.75O2 material have not been changed, whereas a few Ce ions might have entered the crystal lattice of the P2 oxide during CeO2 surface modification. 2.00 wt% CeO2-modified Na0.67Co0.25Mn0.75O2 exhibits the best cyclic stability and the kinetic characteristics under the experimental conditions. It is suggested that the appropriate CeO2 modification is a direct and efficient approach to enhance the desodiation and sodiation capacity, the cyclic stability and the kinetic characteristics of the layered oxide cathode for sodium ion battery.Conflicts of interest
There are no conflicts of interest to declare.Acknowledgements
This research did not receive any specific grant from funding agencies in the public, commercial, or not-for-profit sectors.References
- L. Zhou, K. Zhang, Z. Hu, Z. Tao, L. Mai, Y.-M. Kang, S.-L. Chou and J. Chen, Adv. Energy Mater., 2017, 8, 1701415 CrossRef.
- S. Nageswaran, M. Keppeler, S.-J. Kim and M. Srinivasan, J. Power Sources, 2017, 346, 89–96 CrossRef.
- Y. Huang, Y. Huang and X. Hu, Electrochim. Acta, 2017, 231, 294–299 CrossRef.
- H.-V. Ramasamy, K. Kaliyappan, R. Thangavel, V. Aravindan, K. Kang, D.-U. Kim, Y. Park, X. Sun and Y.-S. Lee, J. Mater. Chem. A, 2017, 5, 8408–8415 RSC.
- X. Xiang, K. Zhang and J. Chen, Adv. Mater., 2015, 27, 5343–5364 CrossRef PubMed.
- S. Heng, S. Jaffer and H. Yu, Energy Storage Mater., 2016, 5, 116–131 CrossRef.
- S. Zhang, Y. Liu, N. Zhang, K. Zhao, J. Yang and S. He, J. Power Sources, 2016, 329, 1–7 CrossRef.
- I. Hasa, X. Dou, D. Buchholz, Y. Shao-Horn, J. Hassoun, S. Passerini and B. Scrosati, J. Power Sources, 2016, 310, 26–31 CrossRef.
- R. Luo, F. Wu, M. Xie, Y. Ying, J. Zhou, Y. Huang, Y. Ye, L. Li and R. Chen, J. Power Sources, 2018, 10, 1051–1074 Search PubMed.
- Q. Peng, Y. Liu, Y. Luo, Z. Zhou, Y. Wang, H. Long, P. Lu, J. Chen and G. Yang, Electrochim. Acta, 2016, 215, 550–555 CrossRef.
- P. Manikandan, D. Ramasubramonian and M. Shaijumon, Electrochim. Acta, 2016, 206, 199–206 CrossRef.
- X. Song, X. Zhou, Y. Deng, J. Nan, D. shu, Z. Cai, Y. Huang and X. Zhang, J. Alloys Compd., 2018, 732, 88–94 CrossRef.
- Y. Zhu, X. Qi, X. Chen, X. Zhou, X. Zhang, J. Wei, Y. Hu and Z. Zhou, J. Mater. Chem. A, 2016, 28, 1–3 CrossRef.
- X. Xu, S. Ji, R. Gao and J. Liu, RSC Adv., 2015, 5, 51454–51460 RSC.
- X. Sun, X.-Y. Ji, H.-Y. Xu, C.-Y. Zhang, Y. Shao and Y. Zang, Electrochim. Acta, 2016, 208, 142–147 CrossRef.
- Y. Wang, J. Tang, X. Yang and W. Huang, Inorg. Chem. Front., 2018, 5, 577–584 RSC.
- N. Bucher, S. Hartung, J. Franklin, A. Wise, L. Lim, H.-Y. Chen, J. Weker, M. Toney and M. Srinivasan, Chem. Mater., 2016, 28, 2041–2051 CrossRef.
- V. S. Rangasamy, L. Zhang, J. W. Seo and J.-P. Locquet, Electrochim. Acta, 2017, 237, 29–36 CrossRef.
- K. Hemalatha, M. Jayakumar and A. S. Prakash, Dalton Trans., 2018, 47, 1223–1232 RSC.
- C. Marino, E. Marelli and C. Villevieille, RSC Adv., 2017, 7, 13851–13857 RSC.
- K. Kaliyappan, J. Liu, B. Xiao, A. Lushington, R. Li, T.-K. Sham and X. Sun, Adv. Funct. Mater., 2017, 27, 1701870 CrossRef.
- J. Alvarado, C. Ma, S. Wang, K. Nguyen, M. Kodur and Y. S. Meng, ACS Appl. Mater. Interfaces, 2017, 9, 26518–26530 CrossRef PubMed.
- Y. Liu, X. Fang, A. Zhang, C. Shen, Q. Liu, H. A. Enaya and C. Zhou, Nano Energy, 2016, 27, 27–34 CrossRef.
- X. Meng, J. Mater. Chem. A, 2017, 5, 10127–10149 RSC.
- C. Luo, A. Langrock, X. Fan, Y. Liang and C. Wang, J. Mater. Chem. A, 2017, 5, 18214–18220 RSC.
- J.-Y. Hwang, S.-T. Myung, J. U. Choi, C. S. Yoon, H. Yashiro and Y.-K. Sun, J. Mater. Chem. A, 2017, 5, 23671–23680 RSC.
- J.-Z. Kong, H.-F. Zhai, X. Qian, M. Wang, Q.-Z. Wang, A.-D. Li, H. Li and F. Zhou, J. Alloys Compd., 2017, 694, 848–856 CrossRef.
- T.-F. Yi, X. Han, B. Chen, Y.-R. Zhu and Y. Xie, J. Alloys Compd., 2017, 703, 103–113 CrossRef.
- J. Ding, Z. Lu, M. Wu, C. Liu, H. Ji and G. Yang, Appl. Surf. Sci., 2017, 406, 21–29 CrossRef.
- L. Chen, Y. Yang, Z. Wang, Z. Lin, J. Zhang, Q. Su, Y. Chen, W. Chen, Y. Lin and Z. Huang, J. Alloys Compd., 2017, 711, 462–472 CrossRef.
- J. Hou, J. Song, Y. Niu, C. Cheng, H. He, Y. Li and M. Xu, J. Solid State Electrochem., 2015, 19, 1827–1831 CrossRef.
- K. Park, D. Han, J. K. Shon, S. G. Doo and S. Lee, RSC Adv., 2015, 5, 6340–6344 RSC.
- A. Grenier, H. Liu, K. M. Wiaderek, Z. W. Lebens-Higgins, O. J. Borkiewicz, L. F. J. Piper, P. J. Chupas and K. W. Chapman, Chem. Mater., 2017, 29, 7345–7352 CrossRef.
- H. R. Seo, H. R. Lee, D.-K. Kang, T. Yim and S. H. Oh, J. Ind. Eng. Chem., 2017, 53, 425–428 CrossRef.
- B. Shen, P. Zuo, P. Fan, J. Yang, G. Yin, Y. Ma, X. Cheng, C. Du and Y. Gao, J. Solid State Electrochem., 2017, 21, 1195–1201 CrossRef.
- T.-F. Yi, J.-Z. Wu, M. Li, Y.-R. Zhu, Y. Xie and R.-S. Zhu, RSC Adv., 2015, 5, 37367–37376 RSC.
- J. Mei, T.-F. Yi, X.-Y. Li, Y.-R. Zhu, Y. Xie and C.-F. Zhang, ACS Appl. Mater. Interfaces, 2017, 9, 23662–23671 CrossRef PubMed.
- Q. Zhang, Y. Liu, H. Lu, D. Tang, C. Ouyang and L. Zhang, Electrochim. Acta, 2016, 189, 147–157 CrossRef.
- D. Arumugam and G. P. Kalaignan, Electrochim. Acta, 2010, 55, 8709–8716 CrossRef.
- M. Michalska, B. Hamankiewicz, D. Ziółkowska, M. Krajewski, L. Lipińska, M. Andrzejczuk and A. Czerwiński, Electrochim. Acta, 2014, 136, 286–291 CrossRef.
- K. Liu, G.-L. Yang, Y. Dong, T. Shi and L. Chen, J. Power Sources, 2015, 281, 370–377 CrossRef.
- R. L. Patel, S. A. Palaparty and X. Liang, J. Electrochem. Soc., 2017, 164, A6236–A6243 CrossRef.
- Y. Wu and A. Manthiram, Solid State Ionics, 2009, 180, 50–56 CrossRef.
- W. Yuan, H. Z. Zhang, Q. Liu, G. R. Li and X. P. Gao, Electrochim. Acta, 2014, 135, 199–207 CrossRef.
- Z.-Y. Li, R. Gao, L. Sun, Z. Hu and X. Liu, Electrochim. Acta, 2017, 223, 92–99 CrossRef.
- F. Meng, Z. Fan, C. Zhang, Y. Hu, T. Guan and A. Li, J. Mater. Sci. Technol., 2017, 33, 444–451 CrossRef.
- G. Singh, J. Damo, M. Galceran, S. Perez-Villar and T. Rojo, J. Mater. Chem. A, 2015, 13, 6954–6961 RSC.
- Y. Xu, X. Li, Z. Wang, H. Guo, W. Peng and W. Pan, Electrochim. Acta, 2016, 219, 49–60 CrossRef.
- M. M. E. Jacob, S. Rajendran, R. Gangadharan, M. S. Michael and S. R. S. Prabaharan, Solid State Ionics, 1996, 86, 595–602 CrossRef.
| This journal is © The Royal Society of Chemistry 2018 |

