 Open Access Article
Development of high damping acrylic rubber/sliding graft copolymer composites†
Junjun Wangb,
Wencai Wang *ab,
Xiaoyan Gengb,
Toshio Nishic,
Xiuying Zhao*ab and
Liqun Zhang
 ab
ab
aKey Laboratory of Beijing City on Preparation and Processing of Novel Polymer Materials, Beijing University of Chemical Technology, Beijing 100029, P. R. China. E-mail: wangw@mail.buct.edu.cn; zhaoxy@mail.buct.edu.cn; Fax: +86-10-64456158; Tel: +86-10-64443413
bBeijing Engineering Research Center of Advanced Elastomer, Beijing, P. R. China
cInternational Department, Tokyo Institute of Technology, 2-12-1 Ookayama, Meguro-ku, Tokyo 152-8552, Japan
First published on 24th October 2018
Abstract
Aiming at fabricating high damping rubber composites, the acrylic rubber ACM was incorporated with sliding graft copolymer (SGC) materials. SGC is a novel supramolecular material with sliding crosslink junctions, and it acts as a high damping phase in ACM/SGC composites. Fourier transform infrared spectroscopy reveals the presence of two types of hydrogen bonds in ACM/SGC composites. Micro-structure analysis shows a clear sea-island phase structure. SGC particles disperse fairly uniformly in the ACM matrix. A wide interphase region exists between these two phases, indicating the good blend compatibility between ACM and SGC. The damping performance of ACM/SGC composites under dynamic shear strain and frequency condition significantly improved with the increase in SGC content. Specifically, the loss factor (tan![[thin space (1/6-em)]](https://www.rsc.org/images/entities/char_2009.gif) δ) value of ACM/SGC (100/40) composite increased by 120% compared with that of neat ACM, according to the RPA results. The significantly improved damping property can be ascribed to the interfacial hydrogen bonds and the pulley effect of SGC molecules.
δ) value of ACM/SGC (100/40) composite increased by 120% compared with that of neat ACM, according to the RPA results. The significantly improved damping property can be ascribed to the interfacial hydrogen bonds and the pulley effect of SGC molecules.
1 Introduction
Damping material can absorb vibrations and noise by converting mechanical energy into heat, which is highly desirable for many applications, such as seismic isolation of buildings and transportation.1 In addition, for seismic isolation application, damping properties in the frequency range of 0.5–7 Hz for large amplitudes (up to 200%) is most important. Polymer materials, such as rubber, are the most commonly used damping materials because of their excellent vibration absorption capability, which can be attributed to the unique viscoelastic properties of polymers.2 However, the damping performance of polymer materials is mainly affected by its glass transition behavior. In general, the effective damping (loss factor, tan![[thin space (1/6-em)]](https://www.rsc.org/images/entities/char_2009.gif) δ > 0.3) temperature range of a homo-polymer is approximately 20–30 °C near its glass transition temperature (Tg), but this range is unsuitable for most practical applications.3,4 Moreover, the tan
δ > 0.3) temperature range of a homo-polymer is approximately 20–30 °C near its glass transition temperature (Tg), but this range is unsuitable for most practical applications.3,4 Moreover, the tan![[thin space (1/6-em)]](https://www.rsc.org/images/entities/char_2009.gif) δ value of pristine polymer materials is usually insufficient.
δ value of pristine polymer materials is usually insufficient.
Many methods, such as polymer blends,5–7 copolymers,8 and interpenetrating polymer networks (IPNs),1,9 have been used for damping modification to improve the damping capabilities of polymer materials. Zhao et al. investigated the morphology and damping performance of natural rubber (NR)/nitrile rubber (NBR)/epoxidized natural rubber (ENR) ternary rubber blends. The effective damping temperature range of this ternary blends became broader than that of pristine NR, and damping performance of rubber blends at around room temperature range was effectively improved.10 Chern et al. examined the damping performance of IPNs of polyurethane-modified epoxy and polyurethane and found that the damping ability was enhanced by the formation of IPN structure.9 However, these modifications usually lead to a decrease in tan![[thin space (1/6-em)]](https://www.rsc.org/images/entities/char_2009.gif) δ or a reduction in mechanical properties. As new damping composites, polymer/small organic molecular hybrids have been widely explored.11–18 Wu prepared high damping polymer composites by introducing hindered phenol AO-80 to binary hybrids of chlorinated polyethylene and acrylic rubber (ACM).19 Zhao et al. prepared high damping rubber composites by adding hindered phenol AO-80 to a NBR matrix.20 Consequently, the strength and damping performance of rubber composites were enhanced. However, these hybrid materials suffer from the instability of damping properties. This is because these organic phenol molecules tend to diffuse to the surface of rubber composites if the affinity between rubber molecules and phenol molecules is weak.21 Moreover, the damping property of rubber materials in dynamic shear strain and frequency ranges has been rarely investigated in these studies, although this property is essential for some applications, such as seismic isolation of buildings.
δ or a reduction in mechanical properties. As new damping composites, polymer/small organic molecular hybrids have been widely explored.11–18 Wu prepared high damping polymer composites by introducing hindered phenol AO-80 to binary hybrids of chlorinated polyethylene and acrylic rubber (ACM).19 Zhao et al. prepared high damping rubber composites by adding hindered phenol AO-80 to a NBR matrix.20 Consequently, the strength and damping performance of rubber composites were enhanced. However, these hybrid materials suffer from the instability of damping properties. This is because these organic phenol molecules tend to diffuse to the surface of rubber composites if the affinity between rubber molecules and phenol molecules is weak.21 Moreover, the damping property of rubber materials in dynamic shear strain and frequency ranges has been rarely investigated in these studies, although this property is essential for some applications, such as seismic isolation of buildings.
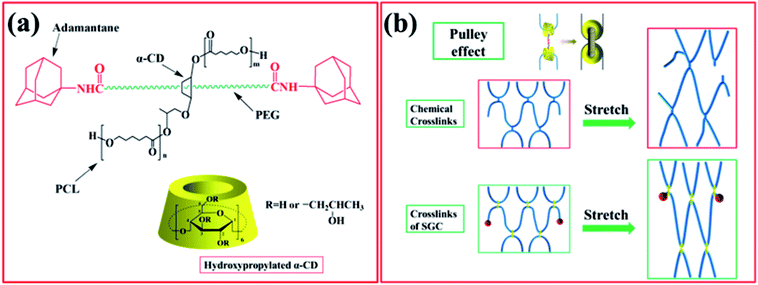
As a novel type of polyrotaxane (PR) derivative, sliding graft copolymer (SGC) has been widely investigated because of its specific properties.22 SGC molecules contain a polyethylene glycol (PEG) backbone, onto which numerous α-cyclodextrins (α-CD) rings are threaded, and the end of the main chains is capped with bulky adamantine groups. The ring components of SGC are grafted by polycaprolactone (PCL) chains.23–29 The grafting reaction is achieved through the ring-open polymerization of ε-caprolactone, initiated by hydroxyl groups (–OH) of the hydroxypropylated α-CDs. SGC network is obtained by cross-linking the terminals of PCL chains with hexamethylene diisocyanate (HMDI).30–33 The preparation schematic of SGC is illustrated in Fig. 1. One of the key features of SGC materials is that the crosslink junctions of these polymer chains are topologically interlocked. Unlike traditional chemical or physical cross-links, these figure-of-eight cross-links are not fixed and can pass along the backbone chains freely, similar to a pulley, to equalize the tension of threading polymer chains. Thus, this feature is also called pulley effect [Fig. 2(b)].34 The pulley effect feature of SGC materials has been confirmed through some characterization methods, such as X-ray scattering, small-angle quasi-elastic light scattering, and small-angle neutron scattering.34,35 SGC materials exhibit some unique properties, such as small stress relaxation,36,37 low compression set, and large tan![[thin space (1/6-em)]](https://www.rsc.org/images/entities/char_2009.gif) δ in a wide frequency range because of the pulley effect.38 This novel SGC material has been applied to scratch-resistant coatings,39 but few studies have focused on its application in damping materials.
δ in a wide frequency range because of the pulley effect.38 This novel SGC material has been applied to scratch-resistant coatings,39 but few studies have focused on its application in damping materials.
Previously, our group introduced SGC to NR matrix as a high damping phase to prepare damping materials.38 However, ENR was used as a compatibilizer because of the poor affinity between SGC and NR molecules, thus complicating the manufacturing process. Thus, in our present study, we introduced SGC to the ACM rubber matrix to prepare high damping rubber composites. The obtained results suggest that SGC exhibits a good dispersion in ACM rubber and can form hydrogen bonds with the rubber matrix. The ACM/SGC composites have a significantly improved damping performance under dynamic shear strain and frequency condition. In this contribution, the microstructures and damping performance were systematically investigated and the relationship between properties with the unique structures has been revealed.
2 Experimental
2.1 Materials
Acrylic rubber (ACM, AR-801, TOPHE Industry Co., Ltd., Japan), used as a matrix in this study, was obtained through the polymerization of ethyl acrylate and composed of active chlorine as cure site groups. Its chemical structure and vulcanization mechanism are illustrated in Fig. 3. A sliding graft copolymer (SGC) with a molecular weight of 6![[thin space (1/6-em)]](https://www.rsc.org/images/entities/char_2009.gif) 00
00![[thin space (1/6-em)]](https://www.rsc.org/images/entities/char_2009.gif) 000 (Tianjin Weirui Supramolecular Materials Technology Co., Ltd., China) was also utilized. The received SGC material contains crosslink agent (HMDI). Other compounding ingredients (Sinopharm Chemical Reagent Co., Ltd., China) were used without further purification.
000 (Tianjin Weirui Supramolecular Materials Technology Co., Ltd., China) was also utilized. The received SGC material contains crosslink agent (HMDI). Other compounding ingredients (Sinopharm Chemical Reagent Co., Ltd., China) were used without further purification.
2.2 Preparation of ACM/SGC composites
The formulation used to prepare the ACM/SGC composites is shown in Table 1.The as-received SGC material was crosslinked in an oven at 170 °C for 3 h. During this process, the terminals of the PCL side chains were cross-linked by hexamethylene diisocyanate.
The ACM rubber was plasticated on a two-roll mill at room temperature and compounded with other ingredients except sulfur. The crosslinked SGC was mixed into the ACM blends on a two-roll mill at 120 °C, and then cooled to room temperature. Sulfur was mixed with the ACM/SGC blends at room temperature, and the blends were vulcanized by compression molding at 180 °C and 15 MPa. The ACM/SGC composites are denoted as ACM/SGC (100/n) in the subsequent discussion, where n indicates phr of SGC.
2.3 Characterization methods
A transmission electron microscope (TEM, The Tecnai G220 S-TWIN, FEI, Ltd., USA) was employed to observe the micro-morphology of ACM/SGC composites. All of the specimens were sectioned to ultra-thin thickness with a glass knife on an ultramicrotome (Leica EM UC7, Germany). An atomic force microscope (AFM Multi Mode 8 Bruker, Germany) was employed to analyze the surface morphology of the composites in Peak Force Quantitative Nano Mechanics (QNM) mode, and the samples were polished using a cryo-ultramicrotome (Leica EM UC7, Germany).Differential scanning calorimetry (DSC) measurements were performed using a DSC 204F1 calorimeter (Mettler-Toledo). The specimens were heated from −80 °C to 160 °C at a heating rate of 10 °C min−1 in a nitrogen atmosphere. Fourier transform infrared spectroscopy (FTIR) measurements were performed on a Bruker Tensor 27 FTIR spectrometer. The FTIR spectra of ACM/SGC composites in the wavenumber range from 400 cm−1 to 4000 cm−1 were acquired from film specimens with a thickness of about 2 mm in an attenuated total reflection (ATR) mode. Temperature-dependent FTIR measurements were performed using an FTIR spectrometer connected with heating equipment in a transmission mode. Samples were heated from 30 °C to 170 °C at a rate of 10 °C min−1.
The damping performance of the ACM/SGC composites was determined using a rubber process analyzer (RPA 2000, Alpha Technologies, USA). Dynamic shear strain sweep was conducted by varying the possible shear strain ranges from 0.1% to 200% at a constant frequency of 1 Hz at 30 °C. Dynamic frequency sweep was performed from 0.5 Hz to 7 Hz at a constant shear strain of 100% at 30 °C. Dynamic mechanical measurements were conducted on a dynamic mechanical thermal analyzer (DMTA, VA3000, 01dB Co., Ltd., France). Temperature sweep was performed at a frequency of 10 Hz, a tensile strain of 0.3%, and a heating rate of 3 °C min−1.
3 Results and discussion
3.1 Intermolecular interactions and microstructure characterizations of ACM/SGC composites
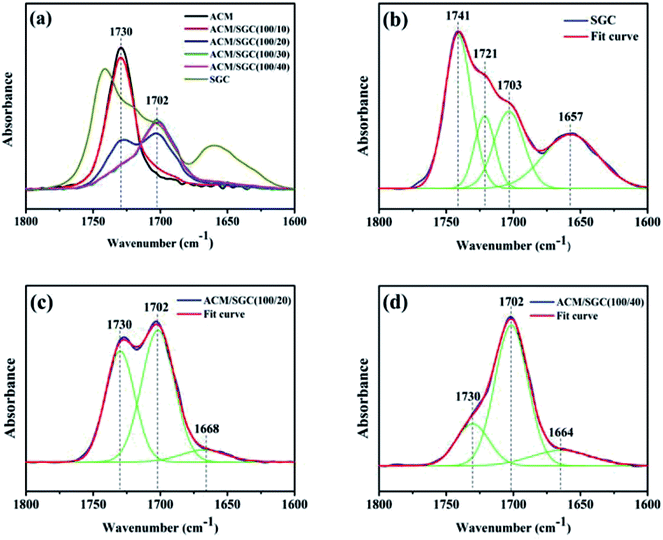
Hydrogen bonding is a type of electrostatic attraction between an electron-deficient hydrogen atom and a highly electronegative atom. This interaction has been proved to be capable to improve the damping performance of rubber composites.17,20 FTIR is an effective tool to investigate hydrogen bond interactions among functional groups. Fig. 4 shows the FTIR spectra of ACM/SGC composites.Fig. 4(a) shows the infrared spectra of the ACM/SGC composites and pristine SGC in the stretching vibration region of carbonyl group (C![[double bond, length as m-dash]](https://www.rsc.org/images/entities/char_e001.gif) O). In the FTIR curve of SGC, there are two distinct broad peaks: the peak around 1700–1750 cm−1 and the peak around 1657 cm−1. And the broad peak around 1700–1750 cm−1 contains one main peak and two shoulder peaks. In order to investigate these broad peaks in detail, peak-fitting analysis was conducted. Fig. 4(b) shows the peak-fitting results of infrared spectrum of SGC. The peak at around 1741 cm−1 corresponds to the stretching vibration of free C
O). In the FTIR curve of SGC, there are two distinct broad peaks: the peak around 1700–1750 cm−1 and the peak around 1657 cm−1. And the broad peak around 1700–1750 cm−1 contains one main peak and two shoulder peaks. In order to investigate these broad peaks in detail, peak-fitting analysis was conducted. Fig. 4(b) shows the peak-fitting results of infrared spectrum of SGC. The peak at around 1741 cm−1 corresponds to the stretching vibration of free C![[double bond, length as m-dash]](https://www.rsc.org/images/entities/char_e001.gif) O groups on the PCL side chain of SGC molecules, and the peak around 1721 cm−1 is attributed to the stretching vibration of carbamate carbonyl40 (the crosslink junctions of SGC contain carbamate groups). The peak at around 1657 cm−1 corresponds to the stretching vibration of amide carbonyl41,42 (which exists on the terminals of PEG main chains). The peak at around 1703 cm−1 is attributed to the hydrogen-bonded C
O groups on the PCL side chain of SGC molecules, and the peak around 1721 cm−1 is attributed to the stretching vibration of carbamate carbonyl40 (the crosslink junctions of SGC contain carbamate groups). The peak at around 1657 cm−1 corresponds to the stretching vibration of amide carbonyl41,42 (which exists on the terminals of PEG main chains). The peak at around 1703 cm−1 is attributed to the hydrogen-bonded C![[double bond, length as m-dash]](https://www.rsc.org/images/entities/char_e001.gif) O groups. The hydrogen bonds are formed between the C
O groups. The hydrogen bonds are formed between the C![[double bond, length as m-dash]](https://www.rsc.org/images/entities/char_e001.gif) O groups on the PCL and the hydroxyl groups (OH) in SGC molecules. Compared with the free C
O groups on the PCL and the hydroxyl groups (OH) in SGC molecules. Compared with the free C![[double bond, length as m-dash]](https://www.rsc.org/images/entities/char_e001.gif) O groups, the peak position of hydrogen-bonded C
O groups, the peak position of hydrogen-bonded C![[double bond, length as m-dash]](https://www.rsc.org/images/entities/char_e001.gif) O groups shifts from 1741 cm−1 to 1703 cm−1, which is called “red shift”. Because some OH groups on α-CDs were not grafted by PCL chains, they can still participate in the formation of hydrogen bonds. Hence, the OH groups participating in the formation of hydrogen bonds could come from the α-CDs or the terminal of PCL chains.
O groups shifts from 1741 cm−1 to 1703 cm−1, which is called “red shift”. Because some OH groups on α-CDs were not grafted by PCL chains, they can still participate in the formation of hydrogen bonds. Hence, the OH groups participating in the formation of hydrogen bonds could come from the α-CDs or the terminal of PCL chains.
As shown in Fig. 4(a), there is one single peak at around 1730 cm−1 in the FTIR curve of ACM, which corresponds to the stretching vibration of free C![[double bond, length as m-dash]](https://www.rsc.org/images/entities/char_e001.gif) O groups on the ACM side chains. After the addition of SGC, there emerged a shoulder peak at around 1702 cm−1 in the curves of ACM/SGC composites. As there are no other peaks, such as those at 1741 cm−1 and 1721 cm−1, emerging in the fitted curves of ACM/SGC spectra, the peak at 1702 cm−1 should not come from SGC itself. In fact, the peak at 1702 cm−1 corresponds to the hydrogen-bonded C
O groups on the ACM side chains. After the addition of SGC, there emerged a shoulder peak at around 1702 cm−1 in the curves of ACM/SGC composites. As there are no other peaks, such as those at 1741 cm−1 and 1721 cm−1, emerging in the fitted curves of ACM/SGC spectra, the peak at 1702 cm−1 should not come from SGC itself. In fact, the peak at 1702 cm−1 corresponds to the hydrogen-bonded C![[double bond, length as m-dash]](https://www.rsc.org/images/entities/char_e001.gif) O groups.43 Hydrogen bonds are formed between the OH groups of SGC and the C
O groups.43 Hydrogen bonds are formed between the OH groups of SGC and the C![[double bond, length as m-dash]](https://www.rsc.org/images/entities/char_e001.gif) O groups of ACM, leading to the shift in peak position from 1730 cm−1 to 1702 cm−1. Fig. 4(c) and (d) illustrate the peak-fitting results of the infrared spectrum of ACM/SGC (100/20) and ACM/SGC (100/40), respectively. As SGC content increases, the peak intensity of the hydrogen-bonded C
O groups of ACM, leading to the shift in peak position from 1730 cm−1 to 1702 cm−1. Fig. 4(c) and (d) illustrate the peak-fitting results of the infrared spectrum of ACM/SGC (100/20) and ACM/SGC (100/40), respectively. As SGC content increases, the peak intensity of the hydrogen-bonded C![[double bond, length as m-dash]](https://www.rsc.org/images/entities/char_e001.gif) O (1702 cm−1) increases, while that of the free C
O (1702 cm−1) increases, while that of the free C![[double bond, length as m-dash]](https://www.rsc.org/images/entities/char_e001.gif) O (1730 cm−1) decreases. This phenomenon reveals that the number of hydrogen bonds increases as SGC content increases.
O (1730 cm−1) decreases. This phenomenon reveals that the number of hydrogen bonds increases as SGC content increases.
In summary, two types of hydrogen bonds are found in ACM/SGC composites: (1) hydrogen bonds between the OH groups of SGC and the C![[double bond, length as m-dash]](https://www.rsc.org/images/entities/char_e001.gif) O groups of PCL chains and (2) hydrogen bonds between the OH groups of SGC and the C
O groups of PCL chains and (2) hydrogen bonds between the OH groups of SGC and the C![[double bond, length as m-dash]](https://www.rsc.org/images/entities/char_e001.gif) O groups of ACM molecules.
O groups of ACM molecules.
Hydrogen bonds will gradually weaken as the temperature increases, or even dissociate at high temperature. In order to further prove the existence of hydrogen bonds in ACM/SGC composites, FTIR measurements at different temperatures were conducted. Fig. 5 shows the FTIR spectra of ACM/SGC (100/40) composites in the hydroxyl stretching vibration region at different temperatures. There are two distinct peaks observed at around 3200–3500 cm−1. The peak at around 3383 cm−1 can be attributed to the hydrogen-bonded OH groups, and the peak at around 3440 cm−1 can correspond to the free OH groups. As the temperature increases, the peak intensity of hydrogen-bonded OH groups decreases gradually, and the peak position shifts from 3383 cm−1 to 3400 cm−1, which is called the “blue shift”. Moreover, the peak intensity of free OH groups increases gradually, and the peak position shows no distinct change. These results can be attributed to the dissociation of hydrogen bonds. As the temperature increases, hydrogen-bonded OH groups dissociate and more free OH groups emerge. FTIR measurements under different temperatures prove the existence of hydrogen bonds successfully.
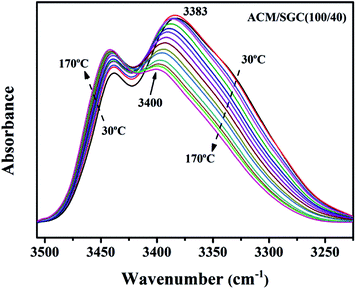 | ||
| Fig. 5 The in situ diffuse reflectance FTIR spectra of ACM/SGC (100/40) composites under different temperatures (from 30 °C to 170 °C with a temperature interval of 10 °C). | ||
Fig. 6 shows the TEM images of ACM/SGC composites. Fig. 6(a) is the TEM image of pristine ACM rubber. Only a few dark particles are observed in the picture, which correspond to the compounding ingredients in the vulcanization system. In the other pictures, ACM/SGC composites present a distinct sea-island phase structure. The bright particles represent SGC phase and the dark phase corresponds to ACM rubber matrix. The SGC phase is uniformly dispersed in the ACM rubber matrix, and the average particle size of SGC is less than 1 μm. This dual-phase morphology indicates that ACM and SGC are not fully miscible. Furthermore, the particle size of SGC is very small, which indicates the good blend compatibility between these two phases. However, the particle size of some SGC particles in ACM/SGC (100/40) composite (Fig. 6(d)) is larger than that of the others. This phenomenon can be attributed to the aggregation of SGC particles with the increase in SGC content. In addition, FTIR results confirmed the existence of hydrogen bond interactions between ACM and SGC, which would facilitate the homogeneous dispersion of SGC in ACM matrix. However, the interphase interaction region cannot be clearly distinguished in these TEM images. The PCL side chains of SGC can slide freely along the main chains because of the “pulley effect” and diffuse into the rubber matrix to form entanglement with ACM molecular chains. Therefore, a wide interphase interaction region is expected to form between the ACM and SGC phases. This structure can be further verified by the AFM results.
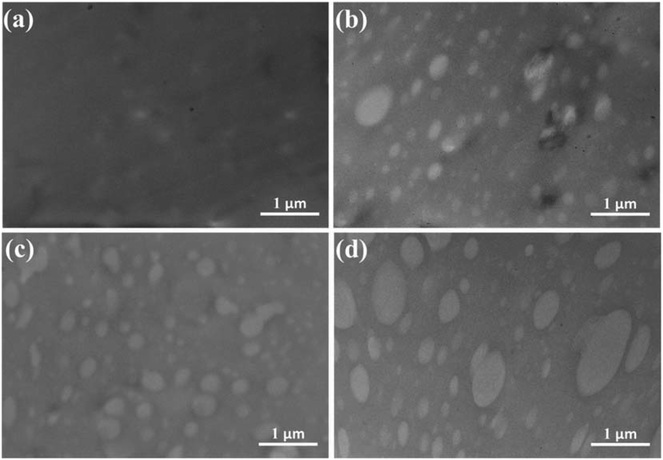 | ||
| Fig. 6 TEM images of ACM/SGC composites. (a) ACM; (b) ACM/SGC (100/10); (c) ACM/SGC (100/20); (d) ACM/SGC (100/40). | ||
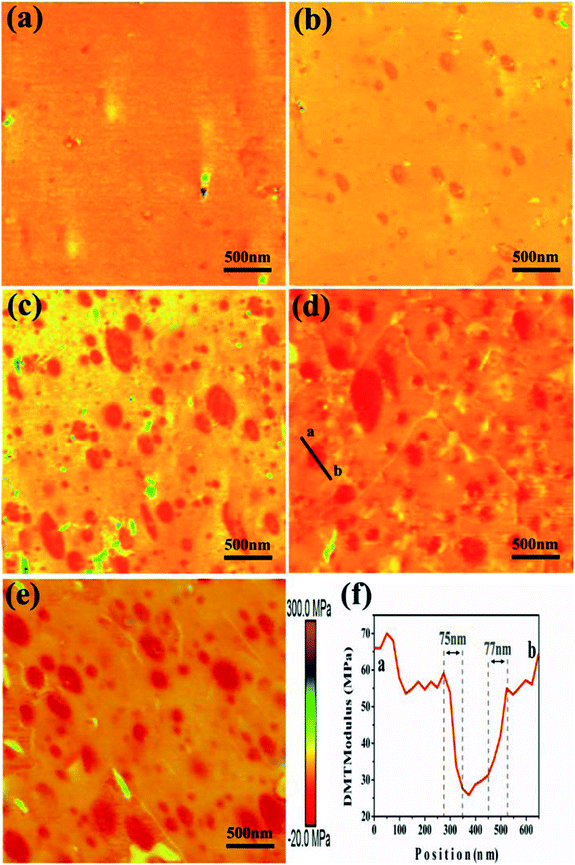
Fig. 7 illustrates a series of AFM Young's modulus maps of the polished surface of ACM/SGC composites. The color scale bar (from red to purple) corresponds to an increase in the AFM modulus from low to high values. Fig. 7(a) presents the AFM modulus map of ACM rubber. Only a few high-modulus particles, such as the green and purple colored particles, are dispersed in the rubber matrix. These particles correspond to the compounding ingredients, such as sodium stearate, which are aggregated on the polished surface of the ACM rubber sample. These high-modulus particles can also be observed in the other AFM images. Fig. 7(b)–(e) show the AFM modulus maps of ACM/SGC composites. Some red particles with the lowest modulus values, which correspond to SGC phase, are homogeneously dispersed in the ACM rubber matrix to form a sea-island phase structure. As the SGC contents increase, the particle size of SGC phase increases but remains less than 500 nm. The curve in Fig. 7(f) indicates the variation of the rubber modulus along the black line in Fig. 7(d). As is shown in Fig. 7(f), the modulus of the ACM rubber matrix and the SGC particle are around 55–60 and 30 MPa, respectively. The region between these two phases is the interphase interaction region, whose width is almost half the diameter of the selected SGC particle. According to the TEM results, this finding can be attributed to the formation of the entanglement between PCL side chains of SGC molecules and ACM molecular chains. Therefore, a wide interphase interaction region exists between ACM and SGC phases, indicating the good blend compatibility between these two phases.
Fig. 8 shows the DSC curves of ACM/SGC composites. Although the micro-morphology analysis reveals that the ACM/SGC composites form a phase separation structure, their Tg stacks together because of the good blend compatibility between these two phases. As a result, one distinct Tg is found in the DSC curves of ACM/SGC composites, and the glass transition region of these composites becomes much wider than that of pristine ACM. In Fig. 8, curve (a) represents the DSC curve of pristine ACM rubber, and Tg of ACM is about −15.0 °C. Curve (f) corresponds to the DSC curve of the cross-linked SGC material, and Tg of SGC is about −24.7 °C. This result suggests that the segments of SGC molecules possess higher mobility than those of ACM molecules. As a result, Tg of ACM/SGC composites shifts slightly to a lower temperature region as the SGC contents increase, compared with that of pristine ACM.
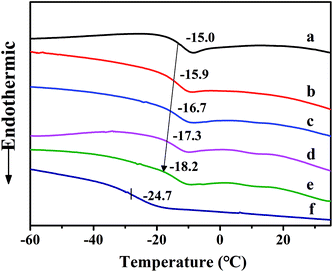 | ||
| Fig. 8 DSC curves of ACM/SGC composites. (a) ACM; (b) ACM/SGC (100/10); (c) ACM/SGC (100/20); (d) ACM/SGC (100/30); (e) ACM/SGC (100/40); (f) SGC. | ||
3.2 Damping properties of ACM/SGC composites
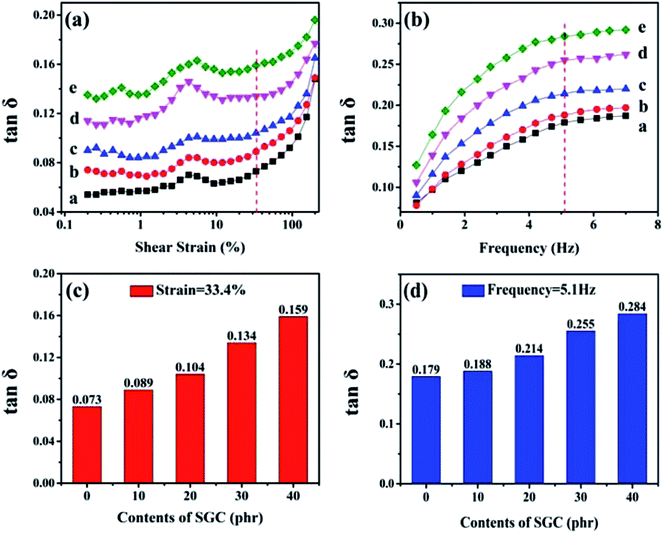
RPA measurements were conducted to investigate the damping performance of ACM/SGC composites at dynamic shear condition. Dynamic strain sweep was conducted by varying the possible shear strain ranges from 0.1% to 200% at a constant frequency of 1 Hz at 30 °C. Dynamic frequency sweep was carried out from 0.5 Hz to 7 Hz at a constant shear strain of 100% at 30 °C. Fig. 9(a) shows the variation of tan![[thin space (1/6-em)]](https://www.rsc.org/images/entities/char_2009.gif) δ with dynamic shear strain sweep. The tan
δ with dynamic shear strain sweep. The tan![[thin space (1/6-em)]](https://www.rsc.org/images/entities/char_2009.gif) δ values of ACM/SGC composites increase significantly with the increase in SGC content. Specifically, Fig. 9(c) shows the tan
δ values of ACM/SGC composites increase significantly with the increase in SGC content. Specifically, Fig. 9(c) shows the tan![[thin space (1/6-em)]](https://www.rsc.org/images/entities/char_2009.gif) δ values of rubber composites at the same strain (33.4%). The tan
δ values of rubber composites at the same strain (33.4%). The tan![[thin space (1/6-em)]](https://www.rsc.org/images/entities/char_2009.gif) δ value of pristine ACM rubber is about 0.073 and that of ACM/SGC (100/40) is about 0.159. The tan
δ value of pristine ACM rubber is about 0.073 and that of ACM/SGC (100/40) is about 0.159. The tan![[thin space (1/6-em)]](https://www.rsc.org/images/entities/char_2009.gif) δ value of ACM/SGC (100/40) is about 1.2 times higher than that of pristine ACM.
δ value of ACM/SGC (100/40) is about 1.2 times higher than that of pristine ACM.
Fig. 9(b) illustrates the variation of tan![[thin space (1/6-em)]](https://www.rsc.org/images/entities/char_2009.gif) δ with dynamic frequency sweep. Similarly, tan
δ with dynamic frequency sweep. Similarly, tan![[thin space (1/6-em)]](https://www.rsc.org/images/entities/char_2009.gif) δ values of ACM/SGC composites significantly increase with the increase in SGC content. For example, Fig. 9(d) shows the tan
δ values of ACM/SGC composites significantly increase with the increase in SGC content. For example, Fig. 9(d) shows the tan![[thin space (1/6-em)]](https://www.rsc.org/images/entities/char_2009.gif) δ values of rubber composites at the same frequency (5.1 Hz). Pristine ACM rubber and ACM/SGC (100/40) composite yield tan
δ values of rubber composites at the same frequency (5.1 Hz). Pristine ACM rubber and ACM/SGC (100/40) composite yield tan![[thin space (1/6-em)]](https://www.rsc.org/images/entities/char_2009.gif) δ of about 0.179 and 0.284, respectively; thus, the value of the latter is about 1.6 times as high as that of the former. Overall, these results indicate the significantly improved damping property of ACM/SGC composites.
δ of about 0.179 and 0.284, respectively; thus, the value of the latter is about 1.6 times as high as that of the former. Overall, these results indicate the significantly improved damping property of ACM/SGC composites.
For seismic isolation rubber bearings, tan![[thin space (1/6-em)]](https://www.rsc.org/images/entities/char_2009.gif) δ values higher than 0.1 (equivalent damping ratio of 10%) in the 0.2–5 Hz frequency range and 10–200% strain range are required, according to the ISO standard.44 As can be concluded from the RPA results, after adding 20 phr SGC, the damping property of rubber composites under strain sweep meets the requirements. The damping property of all the ACM/SGC composites under frequency sweep meets the requirements.
δ values higher than 0.1 (equivalent damping ratio of 10%) in the 0.2–5 Hz frequency range and 10–200% strain range are required, according to the ISO standard.44 As can be concluded from the RPA results, after adding 20 phr SGC, the damping property of rubber composites under strain sweep meets the requirements. The damping property of all the ACM/SGC composites under frequency sweep meets the requirements.
As mentioned previously, the PCL side chains and crosslink junctions of SGC materials can slide freely along the backbone chains because of the pulley effect. During this sliding process, the internal friction among SGC molecular chains increases, resulting in improved energy dissipation and high tan![[thin space (1/6-em)]](https://www.rsc.org/images/entities/char_2009.gif) δ value. Hence, SGC acts as a high damping phase in rubber composites. Moreover, as proved in AFM results, there is a wide interfacial region between ACM and SGC phases because of the interfacial hydrogen bonds and molecular chain entanglement. During deformation, the interfacial hydrogen bonds will continuously rupture and re-associate, and the chain entanglement will increase the internal friction. As a result, these behaviors consume a lot of energy. Hence, the damping property of the ACM/SGC composites is significantly improved.
δ value. Hence, SGC acts as a high damping phase in rubber composites. Moreover, as proved in AFM results, there is a wide interfacial region between ACM and SGC phases because of the interfacial hydrogen bonds and molecular chain entanglement. During deformation, the interfacial hydrogen bonds will continuously rupture and re-associate, and the chain entanglement will increase the internal friction. As a result, these behaviors consume a lot of energy. Hence, the damping property of the ACM/SGC composites is significantly improved.
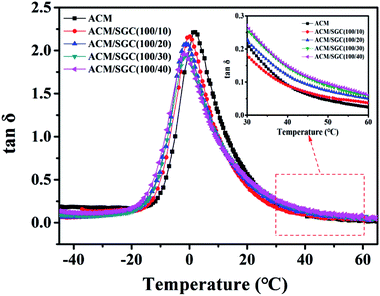
The damping property of ACM/SGC composites with the variation of temperature under tensile deformation was tested by DMA measurements. The results are illustrated in Fig. 10. Only one tan![[thin space (1/6-em)]](https://www.rsc.org/images/entities/char_2009.gif) δ peak is observed in DMA curves for ACM/SGC composites, which indicates the good blend compatibility between ACM and SGC. The maximum tan
δ peak is observed in DMA curves for ACM/SGC composites, which indicates the good blend compatibility between ACM and SGC. The maximum tan![[thin space (1/6-em)]](https://www.rsc.org/images/entities/char_2009.gif) δ values of the composites slightly decrease compared with that of pristine ACM rubber, but is still higher than 2.0. Moreover, the tan
δ values of the composites slightly decrease compared with that of pristine ACM rubber, but is still higher than 2.0. Moreover, the tan![[thin space (1/6-em)]](https://www.rsc.org/images/entities/char_2009.gif) δ value of the ACM/SGC composites above room temperature is significantly improved. This improvement of damping performance above room temperature is exactly needed for seismic isolation application.
δ value of the ACM/SGC composites above room temperature is significantly improved. This improvement of damping performance above room temperature is exactly needed for seismic isolation application.
Furthermore, Table S1† lists the improvement in tan![[thin space (1/6-em)]](https://www.rsc.org/images/entities/char_2009.gif) δ of different rubber damping materials reported in other literature reports. It can be concluded that ACM/SGC composites prepared in this study possess significantly improved tan
δ of different rubber damping materials reported in other literature reports. It can be concluded that ACM/SGC composites prepared in this study possess significantly improved tan![[thin space (1/6-em)]](https://www.rsc.org/images/entities/char_2009.gif) δ compared with that of other materials listed in the table.
δ compared with that of other materials listed in the table.
4 Conclusion
ACM/SGC composites with significantly improved damping performance were successfully prepared in the present study. Two types of hydrogen bonds are found in ACM/SGC composites. The ACM/SGC composites exhibit a clear sea-island phase structure. SGC phase is homogeneously dispersed in the rubber matrix and form a wide interphase interaction region with the ACM phase. Damping performance of ACM/SGC composites is significantly improved as the SGC contents increase. The tan![[thin space (1/6-em)]](https://www.rsc.org/images/entities/char_2009.gif) δ value of ACM/SGC (100/40) composite is about 1.2 times higher than that of pristine ACM according to the RPA results. The increase in damping property can be attributed to the pulley effect of SGC and the interfacial hydrogen bonds.
δ value of ACM/SGC (100/40) composite is about 1.2 times higher than that of pristine ACM according to the RPA results. The increase in damping property can be attributed to the pulley effect of SGC and the interfacial hydrogen bonds.
Conflicts of interest
The authors declare no competing financial interests.Acknowledgements
This study was supported by the National Natural Science Foundation of China (Grant number 51320105012, 51673013). The authors appreciate Dr Xuecheng Liu of Tianjin Weirui Supra-Molecular Materials Technology Co., Ltd. for the supply of SGC material.References
- T. Wang, S. Chen, Q. Wang and X. Pei, Mater. Des., 2010, 31, 3810–3815 CrossRef CAS.
- Q. Liu, M. Li, Y. Gu, S. Wang, Y. Zhang, Q. Li, L. Gao and Z. Zhang, Carbon, 2015, 86, 46–53 CrossRef CAS.
- C. Qin, W. Cai, J. Cai, D. Tang, J. Zhang and M. Qin, Mater. Chem. Phys., 2004, 85, 402–409 CrossRef CAS.
- X. Shi, Q. Li and A. Zheng, Polym. Test., 2014, 35, 87–91 CrossRef CAS.
- J. Wu, C. Li, Y. Wu, M. Leu and Y. Tsai, Compos. Sci. Technol., 2010, 70, 1258–1264 CrossRef CAS.
- L. Qu, G. Huang, J. Wu and Z. Tang, J. Mater. Sci., 2007, 42, 7256–7262 CrossRef CAS.
- C. Wu, C. Wei, W. Guo and C. Wu, J. Appl. Polym. Sci., 2008, 109, 2065–2070 CrossRef CAS.
- M. M. Mok, J. Kim and J. M. Torkelson, J. Polym. Sci., Part B: Polym. Phys., 2008, 46, 48–58 CrossRef CAS.
- Y. C. Chern, S. M. Tseng and K. H. Hsieh, J. Appl. Polym. Sci., 1999, 74, 328–335 CrossRef CAS.
- X. Zhao, K. Niu, Y. Xu, Z. Peng, L. Jia, D. Hui and L. Zhang, Composites, Part B, 2016, 107, 106–112 CrossRef CAS.
- C. Wu, S. Akiyama, T. Mabuchi and K.-h. Nitta, Polym. J., 2001, 33, 792–798 CrossRef CAS.
- C. Wu, T.-A. Yamagishi, Y. Nakamoto, S. Ishida, K.-H. Nitta and S. Kubota, J. Polym. Sci., Part B: Polym. Phys., 2000, 38, 2285–2295 CrossRef CAS.
- P. Xiang, X. Zhao, D. Xiao, Y. Lu and L. Zhang, J. Appl. Polym. Sci., 2008, 109, 106–114 CrossRef CAS.
- D. Xiao, X. Zhao, Y. Feng, P. Xiang, L. Zhang and W. Wang, J. Appl. Polym. Sci., 2010, 116, 2143–2150 CAS.
- X. Zhao, D. Xiao, S. Wu, Y. Feng, L. Zhang and W. Wang, J. Appl. Polym. Sci., 2011, 120, 906–913 CrossRef CAS.
- M. Song, X. Zhao, Y. Li, S. Hu, L. Zhang and S. Wu, RSC Adv., 2014, 4, 6719 RSC.
- X. Zhao, G. Zhang, F. Lu, L. Zhang and S. Wu, RSC Adv., 2016, 6, 85994–86005 RSC.
- D. Yang, X. Zhao, T. Chan, L. Zhang and S. Wu, J. Mater. Sci., 2016, 51, 5760–5774 CrossRef CAS.
- C. Wu, J. Appl. Polym. Sci., 2000, 80, 2468–2473 CrossRef.
- X. Zhao, P. Xiang, M. Tian, H. Fong, R. Jin and L. Zhang, Polymer, 2007, 48, 6056–6063 CrossRef CAS.
- Y. Gao, X. Wang, M. Liu, X. Xi, X. Zhang and D. Jia, Mater. Des., 2014, 58, 316–323 CrossRef CAS.
- J. Araki, The 15th International Conference on Biomedical Engineering. Springer, Cham, 2014, 43, pp. 20–23 Search PubMed.
- V. Nagarajan, A. K. Mohanty and M. Misra, ACS Sustainable Chem. Eng., 2016, 4, 2899–2916 CrossRef CAS.
- M. K. Thakur, R. K. Gupta and V. K. Thakur, Carbohydr. Polym., 2014, 111, 849–855 CrossRef CAS PubMed.
- V. K. Thakur, M. K. Thakur and R. K. Gupta, Int. J. Biol. Macromol., 2013, 61, 121–126 CrossRef CAS PubMed.
- V. K. Thakur, M. K. Thakur and R. K. Gupta, Int. J. Biol. Macromol., 2013, 62, 44–51 CrossRef CAS PubMed.
- V. K. Thakur, M. K. Thakur and R. K. Gupta, Carbohydr. Polym., 2013, 97, 18–25 CrossRef CAS PubMed.
- V. K. Thakur, M. K. Thakur and R. K. Gupta, Carbohydr. Polym., 2013, 98, 820–828 CrossRef CAS PubMed.
- V. K. Thakur, M. K. Thakur and R. K. Gupta, Carbohydr. Polym., 2014, 104, 87–93 CrossRef CAS PubMed.
- X. Li, H. Kang, J. Shen, L. Zhang, T. Nishi, K. Ito, C. Zhao and P. Coates, Polymer, 2014, 55, 4313–4323 CrossRef CAS.
- D. Yang, F. Ge, M. Tian, N. Ning, L. Zhang, C. Zhao, K. Ito, T. Nishi, H. Wang and Y. Luan, J. Mater. Chem. A, 2015, 3, 9468–9479 RSC.
- X. Li, H. Kang, J. Shen, L. Zhang, T. Nishi and K. Ito, Chin. J. Polym. Sci., 2015, 33, 433–443 CrossRef CAS.
- J. Araki, T. Kataoka and K. Ito, Soft Matter, 2008, 4, 245–249 RSC.
- K. Ito, Polym. J., 2007, 39, 489–499 CrossRef CAS.
- J. Araki and K. Ito, Soft Matter, 2007, 3, 1456 RSC.
- N. Murata, A. Konda, K. Urayama, T. Takigawa, M. Kidowaki and K. Ito, Macromolecules, 2009, 42, 8485–8491 CrossRef CAS.
- Y. Bitoh, N. Akuzawa, K. Urayama, T. Takigawa, M. Kidowaki and K. Ito, Macromolecules, 2011, 44, 8661–8667 CrossRef CAS.
- W. Wang, D. Zhao, J. Yang, T. Nishi, K. Ito, X. Zhao and L. Zhang, Sci. Rep., 2016, 6, 22810 CrossRef PubMed.
- Y. Noda, Y. Hayashi and K. Ito, J. Appl. Polym. Sci., 2013, 131, 9 Search PubMed.
- P. A. Edwards, G. Striemer and D. C. Webster, Prog. Org. Coat., 2006, 57, 128–139 CrossRef CAS.
- K. J. Howe, K. P. Ishida and M. M. Clark, Desalination, 2002, 147, 251–255 CrossRef CAS.
- M. Zeng, Z. Fang and C. Xu, J. Membr. Sci., 2004, 230, 175–181 CrossRef CAS.
- J. Wang, M. K. Cheung and Y. Mi, Polymer, 2002, 43, 1357–1364 CrossRef CAS.
- T. C./Sc. ISO 22762-1:2005 - Elastomeric seismic-protection isolators -- Part 1: Test methods.
Footnote |
| † Electronic supplementary information (ESI) available. See DOI: 10.1039/c8ra04644a |
| This journal is © The Royal Society of Chemistry 2018 |


