 Open Access Article
A novel microwave-assisted hydrothermal route for the synthesis of ZnxTPA/γ-Al2O3 for conversion of carbohydrates into 5-hydroxymethylfurfural
G. Parameswaram and
Sounak Roy *
*
Department of Chemistry, Birla Institute of Technology and Science (BITS) Pilani, Hyderabad Campus, Jawahar Nagar, Shameerpet Mandal, Hyderabad 500078, Telangana, India. E-mail: sounak.roy@hyderabad.bits-pilani.ac.in
First published on 9th August 2018
Abstract
Energy-efficient and sustainable processes for the production of 5-hydroxymethylfurfural (HMF) from carbohydrates are in high demand. Bivalent ion-exchanged microwave-synthesized ZnxTPA/γ-Al2O3 was employed for the direct conversion of carbohydrates into HMF. The as-synthesized samples were structurally characterized by FTIR and Raman spectroscopy, UV-Vis diffused reflectance spectroscopy, and X-ray diffraction. Thermal characterization was performed by TG-DTA. The surface morphology was analysed by FE-SEM, and surface area analysis was performed. The surface acidities of the as-synthesized catalysts were elucidated by pyridine FTIR spectra and NH3-TPD. The catalytic performance was thoroughly studied as a function of Zn2+ doping, reaction temperature, catalysts loading, and effect of solvents. Microwave-synthesized Zn0.5TPA/γ-Al2O3 exhibited excellent catalytic fructose dehydration, with 88% HMF yield at 120 °C for 2 h. The surface Brønsted acidity was found to be crucial for optimum catalytic activity.
1. Introduction
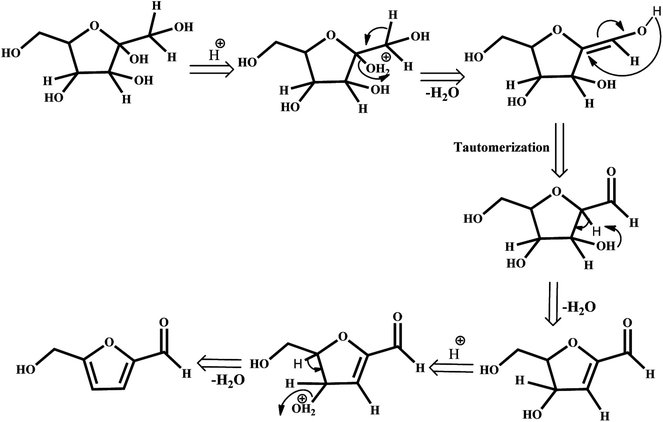
The depletion of finite and non-renewable primary feedstocks of fossil fuels coupled with anthropogenic CO2 emission has stimulated research on biomass refining to meet the energy demands of the rapidly increasing global population. Instead of petroleum refining, biomass refining, which is an environmentally benign nonpetroleum technology, valorizes lignocellulosic biomass to obtain an array of value-added products, such as fuels, power, and chemicals. Among these chemicals, 5-hydroxymethylfurfural (HMF) is identified by the U.S. Department of Energy as a versatile intermediate and one of the most important bio-based compounds for the production of value-added chemicals.1–3 HMF is referred to in the literature as a “sleeping giant” as it can be transformed into useful products, such as pharmaceuticals,4 fuels5–8 and polymers.9–11 Therefore, a plethora of literature is concentrating on the catalytic production of HMF by dehydration of C6 sugars in the presence of various mineral acids,12 organic acids,13 and ionic liquids.14,15 The highest yields can be obtained when fructose is used as the substrate as it has been proven thermodynamically that the C–2-OH group is easily protonated, resulting in stabilization of the furanic ring and thereby facilitating the dehydration that leads to the formation of HMF.16,17 The mechanistic pathways can involve acyclic or cyclic intermediates.18 The possible fructose dehydration mechanism may be initiated by the protonation of the most basic hydroxyl group of the molecule, which is directly attached to the ring in the alpha position to the oxygen. The protonated form undergoes spontaneous dehydration and generates the cyclic intermediate enol, 2,5-anhydro-d-mannose, formed in the tautomerization step. The loss of water leads to the formation of HMF (Scheme 1). Therefore, catalysts for this process should have strong Brønsted acid sites.Catalytic dehydration of C6 sugars to HMF is being studied by homogeneous and heterogeneous Brønsted acid catalysts. However, heterogeneous acid catalysts have become increasingly attractive due to their environmentally benign nature, in addition to their ease of separation and recycling.19–21 The most studied heterogeneous catalysts for HMF production are ion-exchange resins,22 zeolites23–25 and phosphates of transition metals (such as Nb, Zr, V, Cu, and Ti).26–30 In this context, heteropolyacids (HPAs), which are Keggin-type super acids with well-defined structures and specific Brønsted acidities, have attracted wide attention.31–36 Due to their structural characteristics and heteroatoms, it is possible to modify their acid–base properties by changing their chemical compositions, abilities to accept and release electrons, and high proton mobilities. However, HPAs generally have weak thermal stability, high solubility in polar solvents and low specific surface areas (<10 m2 g−1). Therefore, there is room for considerable improvement of HPAs towards the catalytic conversion of C6 sugars to HMF.
In this study, we have synthesized Zn2+ salts of 12-tungstophosphoric acid (TPA) supported on high surface area Al2O3 by a microwave-assisted hydrothermal method. Zinc was selected as the exchanging agent as (i) it is a Lewis acid and (ii) zinc chloride has been proved to be a useful catalyst for HMF synthesis from carbohydrates.37,38 As the introduction of Lewis acid ions in heteropolyacid molecules assists the Brønsted sites with the opportunity to design unique protons,39 the introduction of zinc to the 12-tungstophosphoric anion was expected to create a synergistic effect to obtain double acid sites with high strengths. Investigative studies exist on monovalent salts of HPA; however, there are hardly any studies on bivalent salts of HPA towards catalytic formation of HMF. To the best of our knowledge, there is also no other report on this particular novel synthesis of ZnxTPA/γ-Al2O3. The catalysts were found to provide excellent yields of HMF from fructose in dimethyl sulfoxide (DMSO) solvent. The reaction conditions were optimized, and the recyclability of the catalysts was carefully examined. The roles of the surface–structural properties of the catalysts and their influence on the dehydration of fructose have been studied in the present study.
2. Experimental section
2.1 Chemicals and catalyst preparation
All the chemicals used in this study were of analytical grade. TPA, fructose (99%), DMSO and HMF were obtained from Sigma-Aldrich, whereas zinc nitrate hexahydrate and Al2O3 were obtained from SD Fine chemicals. The catalysts ZnxTPA/γ-Al2O3 (where x is the number of Zn atoms in H3PW12O40) were synthesized using a microwave-assisted hydrothermal method, which is rapid, green, energy efficient, and an attractive choice to promote reactions by dielectric heating. Also, the microwave dielectric heating route enhances the yield and material purity and narrows the size distribution. Zn-exchanged TPA catalysts were prepared with varying Zn contents. In a typical procedure, the required amount of TPA was dissolved in distilled water. The calculated amount of aqueous Zn(NO3)2·6H2O solution was added dropwise to this mixture, which was then transferred to microwave-transparent G30 vial, stirred for 10 min, and subjected to heating at 120 °C for 2 h in a microwave system (Anton Parr, Monowave 300, GmbH, Europe). Microwave radiation with a power of 850 W was used to prepare all the materials. After the microwave treatment, the solid product was dried at 60 °C overnight in a hot air oven to obtain the ZnxTPA catalyst (x = 0.5 to 1.5). For the synthesis of ZnxTPA/γ-Al2O3, the required quantity of ZnxTPA was dissolved in a minimum amount of water, and this solution was added dropwise to the calculated amount of γ-Al2O3 with constant stirring. After 10 min of stirring, this solution was transferred to the G30 microwave vial. The reaming process was the same as mentioned above. The γ-Al2O3-supported ZnxTPA was obtained as a white powder with a yield of >90%.2.2 Physico-chemical characterization
The structural characterization was performed by recording FTIR and Raman spectra as well as X-ray diffractograms. The microwave-prepared ZnxTPA/γ-Al2O3 catalysts were mixed with KBr, and FTIR spectra were collected in transmission mode using a JASCO FTIR-4200 instrument. Raman spectra were measured using a UniRAM 3300 Raman microscope with an incident laser wavelength of 532 nm. The X-ray powder diffraction (XRD) patterns of the as-synthesized catalysts were recorded on a Rigaku Miniflex diffractometer using CuKα radiation (1.5418 Å) operated at 40 kV and 30 mA. The UV-Vis spectra of the as-synthesized materials were also recorded in a JASCO V-670 UV-visible spectrophotometer to elucidate their Keggin-type structures. The spectra were recorded against a boric acid background. The thermal characterization was performed by thermogravimetric analysis (TGA, TA-60WS Instruments). The surface morphologies and compositions of the powders were determined using field emission scanning electron microscopy (FE-SEM by FEI, Apreo Model). For surface area and pore size distribution estimation, N2 physisorption isotherms were measured at 77 K with a Microtrac BEL Corp mini-II surface area analyzer. The elemental concentrations of Zn and W in the as-prepared catalysts were monitored by energy-dispersive X-ray fluorescence (ED-XRF, Epsilon 1; PANalytical).The surface acidities were probed by FTIR spectra of pyridine adsorption over ZnxTPA/γ-Al2O3 and NH3 TPD. Pyridine was dropped on KBr pellets of ZnxTPA/γ-Al2O3, which were dried in a hot air oven; the FTIR spectra were recorded using the JASCO FTIR-4200 with a resolution of 4 cm−1 at room temperature. The NH3-TPD of the ZnxTPA/γ-Al2O3 samples was carried out in a BELCAT II instrument (Japan) in order to understand their surface acidities. About 50 mg of powdered sample was taken inside a quartz U tube and then, pre-treatment was conducted in He flow at 300 °C for 1 h prior to NH3 adsorption at 70 °C. The NH3 adsorption was continued for 45 min and then, the sample was flushed with He for 1 h at 100 °C to remove physically adsorbed NH3 from the catalyst surface. The desorption profile was recorded at a heating rate of 10 °C min−1 from 100 °C to 800 °C, and the desorbed NH3 was monitored with a thermal conductivity detector.
2.3 Catalytic activity tests on the fructose dehydration reaction and product analysis
Fructose dehydration reactions were carried out in a 15 mL pressure tube in a thermostatically controlled oil bath. In a typical process, 120 mg of fructose was dissolved in 2 mL of DMSO solvent and different loadings of catalyst (in the range between 1 and 25 mg) were added to this reactant mixture. The resulting mixture was charged into a pressure tube, which was placed in an oil bath at five different temperatures between 80 °C and 160 °C. The reactions were carried out for 30 to 150 min and upon completion of the reactions, the resulting mixtures were decanted into volumetric flasks using a known amount of water as a diluter. The solution was shaken well, and the upper layer was filtered through 0.45 μm Nylon syringe filters for product monitoring.All reactions were monitored by liquid chromatography system (Shimadzu HPLC, Shimadzu, Japan) with a solvent delivery system of two pumps (Model LC20AD, Prominence Liquid Chromatograph, Shimadzu, Japan), an auto injector (Model SIL-20A HT, Prominence Auto Sampler, Shimadzu, Japan), and a photo diode array (PDA) UV detector (Model SPD-M20A, Prominence Diode Array Detector, Shimadzu, Japan). Data collection and integration were accomplished using LC Solutions software, version 1.25. Chromatographic separation was performed on a Thermo Scientific C18 column (dimensions: 150 mm × 4.6 mm, 5 μm) maintained at 30 °C. The mobile phase was a mixture of methanol and water (20/80 v/v). Analyses were carried out under isocratic conditions at a flow rate set at 0.8 mL min−1, and the detection wavelength was 280.0 nm. The HPLC system was stabilized for 1.5 h at a 1 mL min−1 flow rate through baseline monitoring prior to actual analysis. An injection volume of 20 μL was optimized for the final method. Fructose was quantified using an external standard at 25 °C using a Shimadzu HPLC apparatus equipped with a Shimpack GIST NH2 column (dimensions: 250 mm × 4.6 mm, 5 μm) maintained at 40 °C, a Shimadzu LC-20AD pump, and a Shimadzu RID-10A detector. The mobile phase was a mixture of acetonitrile and water (75/25 v/v). The flow rate was set at 0.8 mL min−1. The RID-10A detector was stabilized for 2 h at a flow rate of 1 mL min−1. The reaction mixture was diluted with a known volume of Milli-Q water before analysis to avoid overloading of the column. All experiments were performed three times, and the average values were reported; the standard deviations of the triplicates were <2.0%.
3. Results and discussion
3.1 Structural and surface morphological characterization
The FTIR spectra of all the as-synthesized catalysts are plotted in Fig. 1. The supported TPA catalysts showed four major bands in the fingerprint zone of 1100 to 500 cm−1, confirming the presence of the Keggin-type structure of PW12O403−. The characteristic bands detected at 1083, 986, 894, and 804 cm−1 were attributed to P–Oa (here, Oa – is an oxygen bound to 3 W atoms and 1 P), W–Ot (t is the terminal oxygen), W–Oc–W (here, Oc – is the corner sharing bridging oxygen atom), and W–Oe–W (here, Oe – is an edge-sharing bridging oxygen atom), respectively.32,39 The existence of these characteristic bands for ZnxTPA/γ-Al2O3 indicates that the primary Keggin structure remained unaffected even after modification with Zn ions to TPA protons.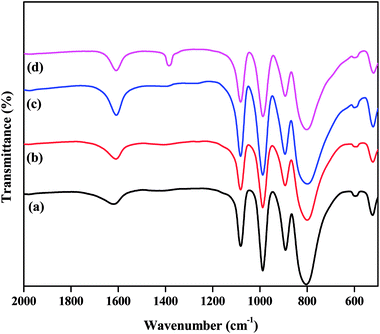 | ||
| Fig. 1 FTIR spectra of the catalysts: (a) TPA/γ-Al2O3, (b) Zn0.5TPA/γ-Al2O3, (c) Zn1TPA/γ-Al2O3, and (d) Zn1.5TPA/γ-Al2O3. | ||
The structural integrity of the Keggin unit was also investigated by Raman spectroscopy. Fig. 2 presents the Raman spectra of the TPA/γ-Al2O3 and ZnxTPA/γ-Al2O3 catalysts. PW12O403− is composed of a framework of distorted octahedral WO6 units. The characteristic Raman signal of the supported TPA observed at 985 cm−1 is ascribed to the symmetric stretching vibration of the double-bonded tungsten-terminal oxygen νs (W![[double bond, length as m-dash]](https://www.rsc.org/images/entities/char_e001.gif) Ot) species, along with its shoulder near 960 cm−1.40,41 The additional signal at 895 cm−1 is due to the stretching vibrations of the bridging W–O–W species of the extended polytungstate framework surrounding the central P atom. The Zn ion-exchanged TPA-supported γ-Al2O3 catalysts also exhibited all the characteristic bands associated with the Keggin ion, confirming the retention of the primary Keggin structure of heteropoly tungstate. It must be noted, however, that with increasing number of replaced protons, there was a gradual decrease in the intensity of the characteristic peaks without changing the peak position. No peak related to ZnO was observed.
Ot) species, along with its shoulder near 960 cm−1.40,41 The additional signal at 895 cm−1 is due to the stretching vibrations of the bridging W–O–W species of the extended polytungstate framework surrounding the central P atom. The Zn ion-exchanged TPA-supported γ-Al2O3 catalysts also exhibited all the characteristic bands associated with the Keggin ion, confirming the retention of the primary Keggin structure of heteropoly tungstate. It must be noted, however, that with increasing number of replaced protons, there was a gradual decrease in the intensity of the characteristic peaks without changing the peak position. No peak related to ZnO was observed.
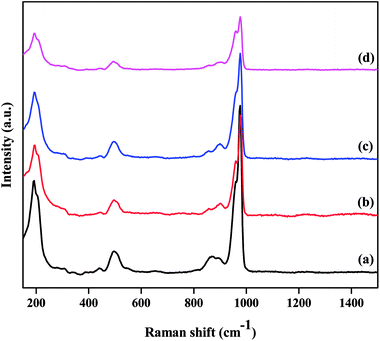 | ||
| Fig. 2 Laser Raman spectra of the as-prepared catalysts: (a) TPA/γ-Al2O3, (b) Zn0.5TPA/γ-Al2O3, (c) Zn1TPA/γ-Al2O3, and (d) Zn1.5TPA/γ-Al2O3. | ||
The XRD patterns of the ZnxTPA/γ-Al2O3 catalysts along with TPA/γ-Al2O3 are shown in Fig. 3. The 2θ values of 10.4°, 17.93°, 23.13°, 25.42°, 29.49°, and 37.74° confirm that TPA/γ-Al2O3 crystallizes in the primitive cubic space group of Pn3m [JCPDS # 50-1857]. However, in the case of the ZnxTPA/γ-Al2O3 catalysts, the highest intensity peaks of (110) and (222) decreased drastically and additional broad peaks formed, indicating that the Zn acid salts of TPA are two-phase mixtures consisting of neutral ZnxTPA and TPA.41,42 The crystallite sizes of the catalysts were determined by applying the Debye–Scherrer formula,  where D is the crystallite size, λ is the wavelength of the X-ray radiation, β is the line width and θ is the angle of diffraction to the main diffraction peaks (TPA: 2θ = 10.4°; ZnxTPA: 2θ = 9.02°). The crystallite sizes of TPA/γ-Al2O3, Zn0.5TPA/γ-Al2O3, Zn1TPA/γ-Al2O3, and Zn1.5TPA/γ-Al2O3 were found to be roughly 36, 24.6, 40.9, and 27.4 nm, respectively.
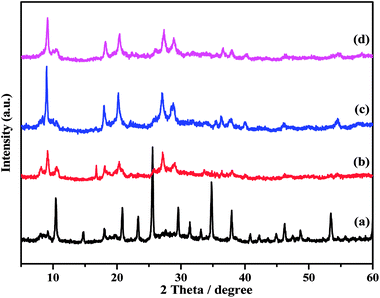 | ||
| Fig. 3 XRD patterns of the catalysts: (a) TPA/γ-Al2O3, (b) Zn0.5TPA/γ-Al2O3, (c) Zn1TPA/γ-Al2O3, and (d) Zn1.5TPA/γ-Al2O3. | ||
UV-Vis diffuse reflectance absorption spectra of the catalysts were obtained in order to obtain information about the chemical natures and coordination states of the microwave-assisted hydrothermally synthesized catalysts; the spectra are plotted in Fig. 4. All the as-prepared samples showed two absorption bands, one band at about 260 nm and a second band at 334 nm. The primary peak can be assigned to the oxygen metal charge transfer of tungstophosphate anion [PW12O403−].43,44 The next broad band at about 334 nm indicates the formation of some small clusters of bulk WO3, demonstrating the presence of octahedral coordination in the extra framework.45 TPA/γ-Al2O3 showed a lower intensity band compared to that of the ZnxTPA/γ-Al2O3 catalysts. The peak intensity increased with increasing Zn content. These results corroborate the data extracted from the FTIR spectroscopy, laser Raman spectroscopy, and XRD analyses, which also showed the presence of both Keggin-type polytungstate species and WO3 crystallites.
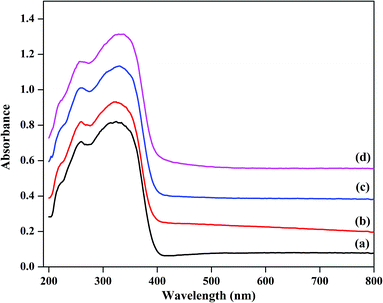 | ||
| Fig. 4 Diffuse reflectance UV-Vis absorption spectra of (a) TPA/γ-Al2O3, (b)Zn0.5TPA/γ-Al2O3, (c) Zn1TPA/γ-Al2O3, and (d) Zn1.5TPA/γ-Al2O3. | ||
The thermal stabilities of TPA/γ-Al2O3 and ZnxTPA/γ-Al2O3 were evaluated by TGA and DTA (Fig. 5). The graphs show typical TG/DTA patterns for Keggin-type heteropolyacids. For these materials, the initial major weight loss is related to the elimination of adsorbed water molecules. These molecules are responsible for the crystallization of heteropolyanions into a hydrate. The second weight loss may be due to the evolution of CO2 and decomposition of oxycarbonate to afford the stable catalyst. The final weight loss may be the decomposition of the heteropolyanion, with crystallization of oxides. The DTA curves show the corresponding endothermic peaks, and an exothermic peak was observed at 560 °C.
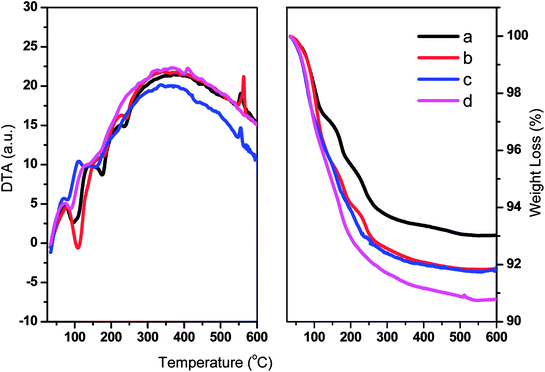 | ||
| Fig. 5 DTA (left panel) and TGA (right panel) of (a) TPA/γ-Al2O3, (b) Zn0.5TPA/γ-Al2O3, (c) Zn1TPA/γ-Al2O3, and (d) Zn1.5TPA/γ-Al2O3. | ||
As catalysis is primarily a surface phenomenon, the surface characteristics and surface morphologies of the as-prepared catalysts were thoroughly studied by surface area analyses, FE-SEM, and surface acidity analyses. The Langmuir surface areas, pore volumes, and pore diameters are tabulated in Table 1. With increasing Zn2+ incorporation, the surface areas and the average pore volumes gradually decreased. However, the mean pore diameter increased steadily.
| Entry | Catalyst | Surface area (m2 g−1) | Pore volume (cm3 g−1) | Pore diameter (nm) |
|---|---|---|---|---|
| 1 | Al2O3 | 173 | 0.593 | 13.76 |
| 2 | TPA/γ-Al2O3 | 8.68 | 0.0163 | 7.55 |
| 3 | Zn0.5TPA/γ-Al2O3 | 2.08 | 0.0051 | 9.88 |
| 4 | Zn1TPA/γ-Al2O3 | 1.6 | 0.0058 | 14.46 |
| 5 | Zn1.5TPA/γ-Al2O3 | 0.76 | 0.0027 | 14.36 |
The FE-SEM micrographs of the as-synthesized fresh Zn0.5TPA/γ-Al2O3 catalyst (top panel) and that exhausted after a catalytic cycle (bottom panel) are shown in Fig. 6 as an example. The freshly prepared Zn0.5TPA/γ-Al2O3 shows a small platelet-shape morphology with cracks and kinks. Also, few sub-micrometre particles were observed on top of the platelet-like morphologies. However, after one catalytic cycle, the platelets tended to agglomerate, forming a smoother surface with Zn0.5TPA/γ-Al2O3. Also, the sub-micrometre particles were no longer observed. The EDAX spectral analysis confirmed the expected Zn contents in the fresh and exhausted catalysts. The EDAX analysis of the ZnxTPA/γ-Al2O3 catalysts (x = 0.5 to 1.5) showed atomic Zn percentages of 1.39, 2.71, and 4.52 for Zn0.5TPA/γ-Al2O3, Zn1TPA/γ-Al2O3 and Zn1.5TPA/γ-Al2O3, respectively. These results are in good agreement with the ED-XRF data shown in Table 2. Apparently, Zn0.5TPA/γ-Al2O3 showed W = 95.38%, P = 1.96%, and Zn = 1.71% with a W![[thin space (1/6-em)]](https://www.rsc.org/images/entities/char_2009.gif) :
:![[thin space (1/6-em)]](https://www.rsc.org/images/entities/char_2009.gif) P
P![[thin space (1/6-em)]](https://www.rsc.org/images/entities/char_2009.gif) :
:![[thin space (1/6-em)]](https://www.rsc.org/images/entities/char_2009.gif) Zn atomic ratio of 12
Zn atomic ratio of 12![[thin space (1/6-em)]](https://www.rsc.org/images/entities/char_2009.gif) :
:![[thin space (1/6-em)]](https://www.rsc.org/images/entities/char_2009.gif) 1
1![[thin space (1/6-em)]](https://www.rsc.org/images/entities/char_2009.gif) :
:![[thin space (1/6-em)]](https://www.rsc.org/images/entities/char_2009.gif) 0.5, corresponding to the molecular formula of Zn0.5PW12O40.
0.5, corresponding to the molecular formula of Zn0.5PW12O40.
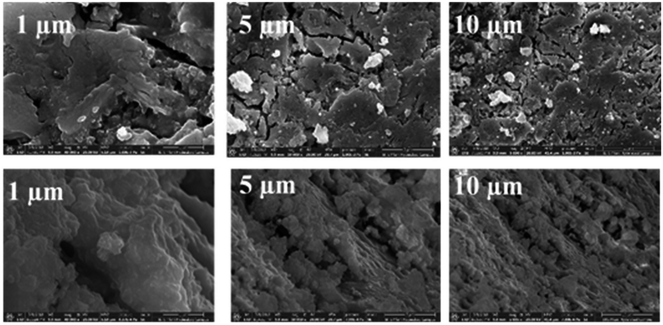 | ||
| Fig. 6 FE-SEM images of Zn0.5TPA/γ-Al2O3 (the top panel represents the freshly synthesized catalyst, and the bottom panel represents the exhausted catalyst). | ||
| S. no | Catalyst | Atomic (%) | |||
|---|---|---|---|---|---|
| Al | P | W | Zn | ||
| 1 | TPA/γ-Al2O3 | 0.40 | 1.93 | 97.65 | 0 |
| 2 | Zn0.5TPA/γ-Al2O3 | 0.96 | 1.96 | 95.38 | 1.71 |
| 3 | Zn1TPA/γ-Al2O3 | 0.95 | 1.98 | 94.21 | 2.86 |
| 4 | Zn1.5TPA/γ-Al2O3 | 0.95 | 1.85 | 92.57 | 4.63 |
The acidity of a catalyst is expected to play a key role in determining its catalytic performance. FTIR spectra of pyridine-adsorbed catalysts can be used to investigate the presence of Brønsted and Lewis acidic sites in super acid catalysts. The pyridine-adsorbed FTIR spectra of the TPA/γ-Al2O3 and Zn0.5TPA/γ-Al2O3 catalysts are shown in Fig. 7. It can be indicated that the main bands at 1400–1600 cm−1 are ascribed to the stretching vibrations of M–N (metal with nitrogen) and N–H (pyridinium ion). The band at 1536 cm−1 corresponds to pyridine adsorbed on Brønsted acidic sites. The other band located at 1482 cm−1 originates from a combination of pyridine bonded to both Brønsted and Lewis acidic sites.39 The next major band connected to Lewis acidic sites was clearly observed at 1441 cm−1 for the present catalysts. The intensity of the bands originating from Lewis and Brønsted acid sites increased significantly from pristine TPA/γ-Al2O3 to Zn0.5TPA/γ-Al2O3. However, with further increase in the Zn molar ratio, the bands did not increase. It can be concluded that the partial exchange of protons with Zn2+ introduces more Lewis acid sites into the catalyst and also enhances the Brønsted acid strength due to the mobility of residual protons in the secondary structure of heteropoly acid.46,47
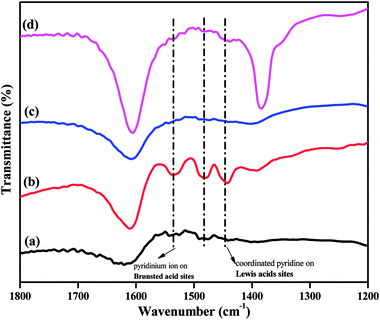 | ||
| Fig. 7 Pyridine-adsorbed FTIR spectra of the as-prepared catalysts: (a) TPA/γ-Al2O3, (b) Zn0.5TPA/γ-Al2O3, (c) Zn1TPA/γ-Al2O3, and (d) Zn1.5TPA/γ-Al2O3. | ||
While the FTIR spectra of the pyridine-adsorbed catalysts show differences in their acidic sites, NH3-TPD studies semi-quantitatively determine the strengths and densities of the acid sites. The acid strengths of the pristine and Zn2+-exchanged supported TPA catalysts were studied through NH3-TPD, and the obtained results are plotted in Fig. 8. The TPD profile of pristine TPA/γ-Al2O3 shows a broad desorption peak at 100 °C to 250 °C, a small peak at 300 °C, and a sharp peak at 550 °C, indicating three different weak, moderate and strong acid sites.48 The ZnxTPA/γ-Al2O3 materials show minor differences in their TPD profiles. The weak acid sites desorbing at 100 °C to 250 °C steadily increase with the Zn2+ concentration; this may be associated with the Lewis acidic sites induced by the existence of Zn2+ in heteropolytungstate. However, the strong sites at higher temperatures initially increase up to Zn0.5 content and then decrease with increasing Zn2+. The strong acid sites may be associated with the Brønsted sites, as has been reported previously.49,50 It should be noted that Zn0.5TPA/γ-Al2O3 also shows stronger FTIR spectrum originating from Lewis and Brønsted acid sites compared to that of TPA/γ-Al2O3. A detailed observation of the TPD profiles shows that in the case of the TPA/γ-Al2O3 catalyst, there are two desorption peaks at 511 °C and 561 °C. However, with Zn2+ incorporation, the high temperature desorption peak gradually shifts to lower temperatures, indicating that with Zn contents higher than 0.5, the strong acidic sites are decreased.51 The total acidities arising from the three different sites were calculated and are plotted in Table 3. The Zn content of 0.5 shows the highest acidity value of 0.948 mmol g−1 among all the as-synthesized catalysts. The highest acidity for Zn0.5TPA/γ-Al2O3 may be due to the formation of monolayer coverage of Zn0.5TPA/γ-Al2O3. Haider et al. also observed a similar pattern of higher acidity with partially replaced protons, which they attributed to the mobility of residual protons in the secondary structure of the heteropoly acid.52
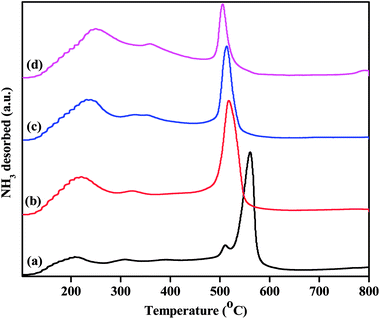 | ||
| Fig. 8 NH3-TPD profiles of the as-prepared catalysts: (a) TPA/γ-Al2O3, (b) Zn0.5TPA/γ-Al2O3, (c) Zn1TPA/γ-Al2O3 and (d) Zn1.5TPA/γ-Al2O3. | ||
| Entry | Catalyst | Acidity (mmol g−1) | Total acidity | ||
|---|---|---|---|---|---|
| Weak | Moderate | Strong | |||
| 1 | TPA/γ-Al2O3 | 0.131 | 0.025 | 0.440 | 0.596 |
| 2 | Zn0.5TPA/γ-Al2O3 | 0.354 | 0.0154 | 0.579 | 0.948 |
| 3 | Zn1TPA/γ-Al2O3 | 0.361 | 0.041 | 0.403 | 0.805 |
| 4 | Zn1.5TPA/γ-Al2O3 | 0.485 | 0.024 | 0.248 | 0.757 |
3.2 Catalytic activity
The initial performance of all the as-synthesized catalysts was studied at 120 °C for 2 h in 2 mL of DMSO as the reaction solvent. The fructose conversion results over TPA/γ-Al2O3 and ZnxTPA/γ-Al2O3 are shown in Table 4. The HMF yield was very poor in the absence of any catalyst and over γ-Al2O3. The pristine TPA also showed only 76% fructose conversion. The Zn0.5TPA/γ-Al2O3 catalyst showed the best performance, with 88% HMF yield and 99% fructose conversion compared to TPA/γ-Al2O3 and the other higher Zn content catalysts. However, pristine TPA/γ-Al2O3 showed 99% fructose conversion and only 74% HMF yield. The highest activity of Zn0.5TPA/γ-Al2O3 can be directly correlated with the results of the structural analysis and the surface acidity studies. The detailed structural analysis confirmed the retention of Keggin-type heteropolyacid units even upon Zn2+ incorporation in pristine TPA. Because pristine TPA is soluble in the reaction mixture, Zn2+ incorporation provides heterogeneity to the Keggin-type structure. Moreover, a certain amount of Zn2+ incorporation also enhances the Brønsted acidity of the catalyst. The NH3-TPD profiles showed that the surface-bound Lewis acid sites linearly increased with higher Zn2+ content. Interestingly, the HMF yield did not follow a similar trend. We may conclude that these Lewis acid sites probably do not play a key role in the fructose dehydration mechanism. On the contrary, the ‘strong acid sites’ originating from the Brønsted sites and the total acidity were highest in Zn0.5TPA/γ-Al2O3, and these acid sites may have primarily determined the HMF yield. Similar findings of Brønsted acid sites selectively forming HMF have also been reported elsewhere.53 We have also conducted catalytic conversion of glucose to HMF over Zn0.5TPA/γ-Al2O3 using DMSO solvent. The glucose conversion over the Zn0.5TPA/γ-Al2O3 catalyst was 80%; however, the HMF yield was as low as 0.8%.| Entry | Catalyst | Fructose conversion (%) | HMF yield (%) |
|---|---|---|---|
| a Reaction conditions: fructose, 120 mg; DMSO, 2 mL; acid catalyst, 15 mg; reaction temperature, 120 °C; time, 2 h. | |||
| 1 | No catalyst | 81 | 2 |
| 2 | TPA | 76 | 70 |
| 3 | γ-Al2O3 | 10 | 5 |
| 4 | Zn0.5TPA | 94 | 73 |
| 5 | TPA/γ-Al2O3 | 99 | 74 |
| 6 | Zn0.5TPA/γ-Al2O3 | 99 | 88 |
| 7 | Zn1TPA/γ-Al2O3 | 99 | 83 |
| 8 | Zn1.5TPA/γ-Al2O3 | 99 | 25 |
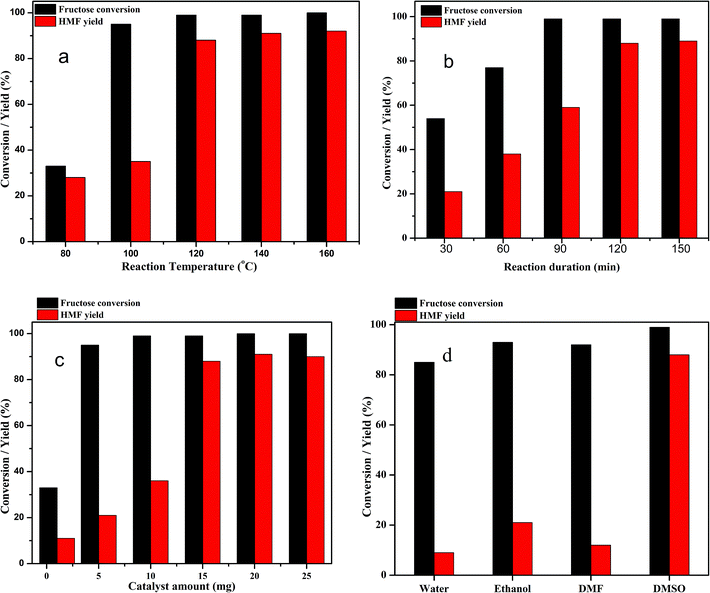
The dehydration of fructose to HMF in DMSO solvent using the Zn0.5TPA/γ-Al2O3 acid catalyst can be influenced by several reaction parameters, including the reaction temperature, reaction time, catalyst weight, and nature of solvents. Therefore, further investigation was carried out to elucidate the optimum conditions of the reaction. To determine the influence of reaction temperature on the conversion of fructose to HMF, the experiments were carried out at different reaction temperatures ranging from 80 °C to 160 °C over Zn0.5TPA/γ-Al2O3 while keeping the other parameters fixed; the results are given in Fig. 9a. It can be seen that the reaction temperature had a large effect on the dehydration of fructose to HMF. At a lower temperature of 80 °C, the fructose conversion and the HMF yield were found to be the lowest. When the reaction was carried out at 100 °C, although the conversion of fructose was high, the HMF yield was as low as ∼35%. A drastic increase in the HMF yield from 35% to 88% was observed with increasing reaction temperature from 100 °C to 120 °C. However, further increasing the reaction temperature to 140 °C and 160 °C did not show any appreciable increase in the HMF yield or fructose conversion. From the economic and HMF yield points of view, 120 °C was selected as the reaction temperature of fructose dehydration reaction. Similar results were also observed in the literature.32,54 The dehydration of fructose to HMF over Zn0.5TPA/γ-Al2O3 was also studied as a function of reaction time while keeping the reaction temperature at 120 °C and the catalyst loading constant; the results are plotted in Fig. 9b. The reaction duration was varied from 30 min to 150 min. With the reaction duration of 30 min, the fructose conversion was 54% and the HMF yield was found to be only 21%. The fructose conversion increased to 77% with 37% HMF yield when the reaction was carried out for 60 min. The fructose conversion and the HMF yield increased further as the reaction time was extended to 90 min and 120 min and then remained relatively stable with further increase of the reaction time to 150 min. Thus, the optimum reaction time for the dehydration of fructose to HMF over Zn0.5TPA/γ-Al2O3 was found to be 120 min at 120 °C. The performance of the Zn0.5TPA/γ-Al2O3 catalysts was also examined with variation of the catalyst loading. Experiments with different catalyst quantities from 1 to 25 mg were conducted at 120 °C for 120 min, and the results are given in Fig. 9c. With only 1 mg of catalyst, the fructose conversion was 33%, with 11% HMF yield. With catalyst loadings of 5 and 10 mg, both the fructose conversion and product yield increased gradually. With a further increase in catalyst amount from 10 to 15 mg, 99% fructose conversion was achieved with increasing HMF yield from 35% to 88%. Further increases in catalyst loading of 20 and 25 mg resulted in slight increases in HMF yield with complete conversion of fructose. The effects of solvents other than DMSO were also studied thoroughly over our supported catalyst. For the comparison of solvents, water, ethanol and DMF were used along with DMSO. The results are plotted in Fig. 9d. Among the solvents, water showed the poorest fructose conversion and HMF yield. For ethanol and DMSO, the fructose conversion was comparable; however, ethanol showed a better HMF yield than DMF. The solvent DMSO showed the best activity. Therefore, the optimum reaction conditions for the dehydration of fructose to HMF in DMSO using Zn0.5TPA/γ-Al2O3 were found to be 120 °C for 2 h of reaction duration with a catalyst loading of 20 mg.
3.3 Reusability of the catalyst
One of the major advantages of solid catalysts is their reusability; because of its high solubility, TPA suffers from reusability issues. Thus, the primary goal of modifying TPA was the ease of recovering the catalyst for consecutive reaction cycles. At the end of the first cycle of reaction, Zn0.5TPA/γ-Al2O3 was separated from the reaction mixture by centrifugation and washed with water and ethanol to remove any adsorbed reaction ingredients from the catalyst surface. The stability of the catalyst was tested by recycling the catalyst six times while keeping the reaction conditions the same. There was almost no loss of catalytic activity until the fourth cycle, and the conversion efficiency reached ∼60% at the end of the sixth cycle (Fig. 10). It is noteworthy that the catalyst exhibited reusability without any further pre-treatment.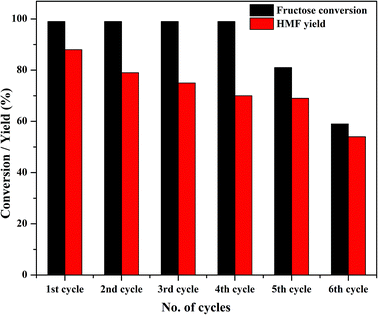 | ||
| Fig. 10 Catalyst activity in four reaction cycles. Reaction conditions: fructose (120 mg), DMSO (2 mL), catalyst (15 mg), temperature (120 °C), time (120 min). | ||
3.4 Comparison of ZnxTPA/γ-Al2O3 catalyst with reported solid acid catalysts
The microwave-synthesized Zn0.5TPA/γ-Al2O3 catalyst was compared with other reported acid catalysts, and the results are tabulated in Table 5. Shimizu et al. reported a wide variety of materials for use in the fructose dehydration reaction, such as FePW12O40, Cs2.5H0.5PW12O40, Amberlyst-15, H–Y zeolite, and Nafion. The commercial H–Y zeolite was reported for complete fructose conversion with 76% HMF yield. The Fe-exchanged tungstophosphoric acid catalyst showed 100% fructose conversion with only 49% HMF yield. However, the Cs-exchanged heteropoly acid catalyst showed similar fructose conversion with 91% HMF yield, but in a continuous water evacuation mode.55 Recently, H1Zr2PW12O40 was reported to produce 85% HMF at a reaction temperature of 140 °C.56 Dutta et al. studied fructose dehydration using microwave-assisted heating with DMSO solvent and TiO2 as the catalyst; they reported an HMF yield of 54%.57 A Sn–W oxide catalyst showed 99% fructose dehydration with 70% HMF yield.58 Shi et al. reported 78% HMF yield with a BEA-ZSM catalyst.59 Apparently, the Zn0.5TPA/γ-Al2O3 catalyst presented here shows superiority compared to the other reported catalysts, with 88% HMF yield.| Entry | Catalyst | Temperature (°C) | Time | Fructose conversion (%) | HMF yield (%) | Ref. |
|---|---|---|---|---|---|---|
| a Heating by microwave irradiation. | ||||||
| 1 | FePW12O40 | 120 | 2 h | 100 | 49 | 55 |
| 2 | TiO2 | 140a | 10 min | — | 54 | 57 |
| 3 | Amberlyst-15 | 120 | 2 h | 100 | 76 | 55 |
| 4 | Sn–W | 80 | 12 h | 99 | 70 | 58 |
| 5 | H–Y zeolite | 120 | 2 h | 100 | 76 | 55 |
| 6 | BEA-ZSM | 120 | 2 h | — | 78 | 59 |
| 7 | Nafion | 120 | 2 h | 100 | 75 | 55 |
| 8 | Zn0.5TPA/γ-Al2O3 | 120 | 2 h | 99 | 88 | Present work |
4. Conclusions
Zn2+ salts of TPA supported on high surface area Al2O3 were synthesized by a novel synthesis route involving a microwave-assisted hydrothermal method. The primary goal was to enhance the surface acidity of pristine TPA while enhancing its thermal stability and decreasing its solubility. The structural and morphological investigations have shown that upon Zn incorporation, the Keggin ion structure is retained; however, the surface area decreased marginally. Among the Zn salts of TPA, Zn0.5TPA/γ-Al2O3 showed the highest acidity by NH3-TPD and pyridine-adsorbed FTIR analyses. The catalytic activity of Zn0.5TPA/γ-Al2O3 was found to be the best among the studied catalysts for conversion of fructose to HMF with 88% yield. Its catalytic performance was compared with the available literature, and it was found to be a promising material for acid catalysis. The fructose dehydration mechanism was found to be in direct correlation with the surface-bound Brønsted acid sites of the materials, and the Lewis acid sites played almost no role in the mechanism. The reaction conditions were optimized by varying the temperature, reaction duration, catalysts loading, and solvents.Conflicts of interest
There are no conflicts of interest to declare.Acknowledgements
G. Parameswaram thanks Science and Engineering Research Board (SERB) and DST, New Delhi, India for financial support in the form of a National Post-Doctoral Fellowship (N-PDF) (SERB/F/8312/20l7-2018, SERB/F/9111/20l7-2018). The authors also thank Mr Aniket Balapure for the FE-SEM images and BITS Pilani, Hyderabad campus for providing research facilities.References
- J. J. Bozell and G. R. Petersen, Green Chem., 2010, 12, 539–554 RSC.
- S. P. Teong, G. Yi and Y. Zhang, Green Chem., 2014, 16, 2015–2026 RSC.
- I. Agirrezabal-Telleria, I. Gandarias and P. L. Arias, Catal. Today, 2014, 234, 42–58 CrossRef.
- P. Gupta, S. K. Singh, A. Pathak and B. Kundu, Tetrahedron, 2002, 58, 10469–10474 CrossRef.
- R. M. West, Z. Y. Liu, M. Peter and J. A. Dumesic, ChemSusChem, 2008, 1, 417–424 CrossRef PubMed.
- J. B. Binder and R. T. Raines, J. Am. Chem. Soc., 2009, 131, 1979–1985 CrossRef PubMed.
- X. Zhou and T. B. Rauchfuss, ChemSusChem, 2013, 6, 383–388 CrossRef PubMed.
- C. M. Cai, T. Zhang, R. Kumar and C. E. Wyman, J. Chem. Technol. Biotechnol., 2014, 89, 2–10 CrossRef.
- S. Siankevich, G. Savoglidis, Z. Fei, G. Laurenczy, D. T. L. Alexander, N. Yan and P. J. Dyson, J. Catal., 2014, 315, 67–74 CrossRef.
- S. Dutta, S. De and B. Saha, ChemPlusChem, 2012, 77, 259–272 CrossRef.
- J. Nie, J. Xie and H. Liu, J. Catal., 2013, 301, 83–91 CrossRef.
- M. Bicker, J. Hirth and H. Vogel, Green Chem., 2003, 5, 280–284 RSC.
- F. S. Asghari and H. Yoshida, Ind. Eng. Chem. Res., 2006, 45, 2163–2173 CrossRef.
- S. Siankevich, Z. Fei, R. Scopelliti, G. Laurenczy, S. Katsyuba, N. Yan and P. J. Dyson, ChemSusChem, 2014, 7, 1647–1654 CrossRef PubMed.
- M. E. Zakrzewska, E. Bogel-Łukasik and R. Bogel-Łukasik, Chem. Rev., 2010, 111, 397–417 CrossRef PubMed.
- S. Caratzoulas and G. Vlachos, Carbohydr. Res., 2011, 346, 664–672 CrossRef PubMed.
- G. Yang, E. Pidko and E. Hensen, J. Catal., 2012, 295, 122–132 CrossRef.
- C. Antonetti, M. Melloni, D. Licursi, S. Fulignati, E. Ribechini, S. Rivas, J. C. Parajo, F. Cavani and A. M. Raspolli Galletti, Appl. Catal., B, 2017, 206, 364–377 CrossRef.
- H. Wang, Q. Kong, Y. Wang, T. Deng, C. Chen, X. Hou and Y. Zhu, ChemCatChem, 2014, 6, 728–732 CrossRef.
- J. Chen, K. Li, L. Chen, R. Liu, X. Huang and D. Ye, Green Chem., 2014, 16, 2490–2499 RSC.
- C. Tian, X. Zhu, S. H. Chai, Z. Wu, A. Binder, S. Brown, L. Li, H. Luo, Y. Guo and S. Dai, ChemSusChem, 2014, 7, 1703–1709 CrossRef PubMed.
- X. Qi, M. Watanabe, T. M. Aida and R. L. Smith Jr, Green Chem., 2008, 10, 799–805 RSC.
- J. S. Kruger, V. Nikolakis and D. G. Vlachos, Appl. Catal., A, 2014, 469, 116–123 CrossRef.
- V. Rac, V. Rakic, D. Stosic, O. Otman and A. Auroux, Microporous Mesoporous Mater., 2014, 194, 126–134 CrossRef.
- T. D. Swift, H. Nguyen, Z. Erdman, J. S. Kruger, V. Nikolakis and D. G. Vlachos, J. Catal., 2016, 333, 149–161 CrossRef.
- F. S. Asghari and H. Yoshida, Carbohydr. Res., 2006, 341, 2379–2387 CrossRef PubMed.
- F. Benvenuti, C. Carlini, P. Patrono, A. M. Raspolli Galletti, G. Sbrana, M. A. Massucci and P. Galli, Appl. Catal., A, 2000, 193, 147–153 CrossRef.
- C. Carlini, M. N. Giuttari, A. M. Raspolli Galletti, G. Sbrana, T. Armaroli and G. Busca, Appl. Catal., A, 1999, 183, 295–302 CrossRef.
- P. Carniti, A. Gervasini, S. Biella and A. Auroux, Catal. Today, 2006, 118, 373–378 CrossRef.
- P. Khemthong, P. Daorattanachai, N. Laosiripojana and K. Faungnawakij, Catal. Commun., 2012, 29, 96–100 CrossRef.
- G. Lv, L. Deng, B. Lu, J. Li, X. Hou and Y. Yang, J. Cleaner Prod., 2017, 142, 2244–2251 CrossRef.
- C. Fan, H. Guan, H. Zhang, J. Wang, S. Wang and X. Wang, Biomass Bioenergy, 2011, 35, 2659–2665 CrossRef.
- F. Lai, J. Luo, D. Jiang, T. Su and F. Zhang, J. Chem. Technol. Biotechnol., 2018, 93, 557–568 CrossRef.
- Y. Song, X. Wang, Y. Qu, C. Huang, Y. Li and B. Chen, Catalysts, 2016, 6, 49–60 CrossRef.
- Y. Qu, C. Huang, J. Zhang and B. Chen, Bioresour. Technol., 2012, 106, 170–172 CrossRef PubMed.
- Y. Qiao, N. Theyssen and Z. Hou, Recyclable Catalysis, 2015, 2, 36–60 CrossRef PubMed.
- Y. R. Zhang, N. Li, M. F. Li and Y. M. Fan, RSC Adv., 2016, 6, 21347–21351 RSC.
- Y. Zhang, Y. Song, C. Chen, M. Li, Z. Zhang and Y. Fan, BioResources, 2017, 12, 7807–7818 Search PubMed.
- J. Li, X. Wang, W. Zhu and F. Cao, ChemSusChem, 2009, 2, 177–183 CrossRef PubMed.
- C. R. Kumar, K. Jagadeeswaraiah, P. S. S. Prasad and N. Lingaiah, ChemCatChem, 2012, 4, 1360–1367 CrossRef.
- I. D. Holclajtner-Antunovic, A. Popa, D. V. Bajuk-Bogdanovic, S. Mentus, B. M. Nedic Vasiljevic and S. M. Uskokovic-Markovic, Inorg. Chim. Acta, 2013, 407, 197–203 CrossRef.
- H. Eom, D. Lee, S. Kim, S. Chung, Y. G. Hur and K. H. Lee, Fuel, 2014, 126, 263–270 CrossRef.
- B. Nikunj and P. Anjali, J. Mol. Catal. A: Chem., 2005, 238, 223–228 CrossRef.
- K. M. Parida, S. Rana, S. Mallick and D. Rath, J. Colloid Interface Sci., 2010, 350, 132–139 CrossRef PubMed.
- J. Hu, Y. Wang, L. F. Chen, R. Richards, W. M. Yang, Z. C. Liu and W. Xu, Microporous Mesoporous Mater., 2006, 93(1–3), 158–163 CrossRef.
- C. Liu, J. Sun, H. M. Brown, O. G. Marin-Flores, J. Timothy Bays, A. M. Karim and Y. Wang, Catal. Today, 2016, 269, 103–109 CrossRef.
- P. Lauriol-Garbey, G. Postole, S. Loridant, A. Auroux, V. Belliere-Baca, P. Rey and J. M. M. Millet, Appl. Catal., B, 2011, 106, 94–102 Search PubMed.
- L. Shen, H. Yin, A. Wang, Y. Feng, Y. Shen, Z. Wu and T. Jiang, Chem. Eng. J., 2012, 180, 277–283 CrossRef.
- O. A. Abdelrahman, K. P. Vinter, L. Ren, D. Xu, R. J. Gorte, M. Tsapatsis and P. J. Dauenhauer, Catal. Sci. Technol., 2017, 7(17), 3831–3841 RSC.
- M. V. Juskelis, J. P. Slanga, T. G. Roberi and A. W. Peters, J. Catal., 1992, 138, 391–394 CrossRef.
- G. Raveendra, A. Rajasekhar, M. Srinivas, P. S. Sai Prasad and N. Lingaiah, Appl. Catal., A, 2016, 520, 105–113 CrossRef.
- M. H. Haider, N. F. Dummer, D. Zhang, P. Miedziak, T. E. Davies, S. H. Taylor, D. J. Willock, D. W. Knight, D. Chadwick and G. J. Hutchings, J. Catal., 2012, 286, 206–213 CrossRef.
- H. Li, S. Yang, A. Riisager, A. Pandey, R. S. Sangwan, S. Saravanamurugan and R. Luque, Green Chem., 2016, 18, 5701–5735 RSC.
- G. Raveendra, M. Srinivas, P. S. S. Prasad and N. Lingaiah, International Journal of Advances in Engineering Sciences and Applied Mathematics, 2013, 5, 232–238 CrossRef.
- K. I. Shimizu, R. Uozumi and A. Satsuma, Catal. Commun., 2009, 10, 1849–1853 CrossRef.
- L. M. Nagesh, S. N. Prashant, V. P. Kiran and V. B. Vijay, ChemistrySelect, 2018, 3, 832–836 CrossRef.
- S. Dutta, S. De, A. K. Patrab, M. Sasidharanc, A. Bhaumikb and B. Sahaa, Appl. Catal., A, 2011, 409, 133–139 CrossRef.
- K. Yamaguchi, T. Sakurada, Y. Ogasawara and N. Mizuno, Chem. Lett., 2011, 40, 542–543 CrossRef.
- Y. Shi, X. Li, J. Hu, J. Lu, Y. Ma, Y. Zhang and Y. Tang, J. Mater. Chem., 2011, 21, 16223–16230 RSC.
| This journal is © The Royal Society of Chemistry 2018 |

