DOI:
10.1039/C8RA06287K
(Paper)
RSC Adv., 2018,
8, 37976-37992
K6P2W18O62 encapsulated into magnetic Fe3O4/MIL-101 (Cr) metal–organic framework: a novel magnetically recoverable nanoporous adsorbent for ultrafast treatment of aqueous organic pollutants solutions†
Received
25th July 2018
, Accepted 30th October 2018
First published on 12th November 2018
Abstract
In this study, a Wells–Dawson type K6P2W18O62 polyoxometalate was encapsulated into the magnetic Fe3O4/MIL-101 (Cr) metal–organic framework and applied as a new magnetically recoverable ternary adsorbent to remove organic dyes from aqueous solutions. The as-prepared ternary magnetically recyclable hybrid (denoted as P2W18O62@Fe3O4/MIL-101 (Cr)) was characterized by FT-IR spectroscopy, powder X-ray diffraction (XRD), Raman spectroscopy, EDX, SEM, BET surface area, and magnetic measurements. The results showed the successful encapsulation of K6P2W18O62 (∼26.5 wt%) into the magnetic Fe3O4/MIL-101 (Cr) framework. The magnetic hybrid had a high specific surface area of 934.89 m2 g−1. The adsorption efficiency of this nanohybrid for the removal of methylene blue (MB), rhodamine B (RhB), and methyl orange (MO) from aqueous solutions was evaluated. The magnetic nanohybrid demonstrated the fast and selective adsorption of cationic dyes from mixed dye solutions. The adsorption rate and capacity of P2W18O62@Fe3O4/MIL-101 (Cr) were increased as compared with MIL-101 (Cr), P2W18O62, and Fe3O4/MIL-101 samples due to the increased electrostatic attraction. The effects of parameters such as the adsorbent dosage, temperature, dye concentration, and pH were investigated on the adsorption process. The adsorption kinetics was analyzed by the Freundlich, Langmuir, and Temkin isotherm models and pseudo-second-order and pseudo-first-order kinetics models, with the Langmuir isotherm and pseudo-second-order kinetic model found to be suitable to describe the equilibrium data. Also, the thermodynamic results of the nanohybrid indicated that the adsorption was an endothermic and spontaneous process. After the adsorption reaction, the magnetic nanohybrid could be easily separated and reused without any change in structure. Based on the results of this study, the nanohybrid was an efficient adsorbent for eliminating cationic dyes.
1 Introduction
With rapid industrial development, water pollution is becoming more and more serious, resulting in the shortage of drinkable water supplies.1,2 Organic dyes are colored organic compounds widely used in the synthesis, textile, cosmetic, leather, printing, paper, food, and other industries.3 So far, more than 10![[thin space (1/6-em)]](https://www.rsc.org/images/entities/char_2009.gif) 000 different types of organic dyes have been produced all over the world. It is estimated that about 10% to 15% of the dyes are discharged to the environment from washing operations and an incomplete exhaustion of coloring materials during the dyeing process, which consequently pose a significant threat to the environment and human health because of their toxicity, potential mutagenicity, and even carcinogenicity without reasonably processing.4,5 Moreover, the discharge of such dyes without treatment into rivers is usually easily noticed since dyes are highly visible and commonly harmful to aquatic life. As a result, the removal of dye pollutants is important for water safety and human health protection. The non-biodegradable nature of dyes and their stability toward light and oxidizing agents complicate the selection of a suitable method for their removal.6,7 Several methods, such as electrochemical,8,9 physical,10 biological,11 adsorption, membrane-based separation, and oxidative degradation,12 have been used for dye removal from dye wastewater. Among the existing elimination techniques, adsorption has been recognized as one of the most competitive technologies for the removal of dyes due to the suitable choice of adsorbent, excellent elimination performance, simplicity of design, lower energy consumption, and ability to treat dyes in a more concentrated form.13,14
000 different types of organic dyes have been produced all over the world. It is estimated that about 10% to 15% of the dyes are discharged to the environment from washing operations and an incomplete exhaustion of coloring materials during the dyeing process, which consequently pose a significant threat to the environment and human health because of their toxicity, potential mutagenicity, and even carcinogenicity without reasonably processing.4,5 Moreover, the discharge of such dyes without treatment into rivers is usually easily noticed since dyes are highly visible and commonly harmful to aquatic life. As a result, the removal of dye pollutants is important for water safety and human health protection. The non-biodegradable nature of dyes and their stability toward light and oxidizing agents complicate the selection of a suitable method for their removal.6,7 Several methods, such as electrochemical,8,9 physical,10 biological,11 adsorption, membrane-based separation, and oxidative degradation,12 have been used for dye removal from dye wastewater. Among the existing elimination techniques, adsorption has been recognized as one of the most competitive technologies for the removal of dyes due to the suitable choice of adsorbent, excellent elimination performance, simplicity of design, lower energy consumption, and ability to treat dyes in a more concentrated form.13,14
In recent years, polyoxometalates (POMs), as an outstanding class of anionic metal oxide clusters, have attracted great attention due to their earth-abundant source, rich topology and versatility, controllable shape and size, oxo-enriched surfaces, and high electronegativity, which facilitate their use in various applications in many fields, such as catalysis, optics, magnetism, biological medicine, and dye adsorption.15–18 These properties make them suitable to be used in adsorption and separation of cationic dyes because they can exert a stronger electrostatic attraction to cationic dyes than anionic dyes.19 However, there are some disadvantages for the use of POMs as adsorbents: (i) their relatively small surface area seriously obstructs accessibility to the active sites and (ii) their excellent solubility in aqueous solution determines that they cannot be reused and recycled in the process of wastewater treatment.20 Hence, these difficulties in collection and recycling currently impede their further application. Therefore, to resolve this problem and also to maintain the polyoxometalate, magnetic adsorbents have attracted our attention and magnetic MOFs have been used to anchor POMs to create hybrid heterogeneous materials.21 MOFs are a new class of nanoporous materials consisting of metal ions or clusters coordinated to organic ligands, and they have attracted considerable attention in the adsorption and removal of organic pollutants due to their ultrahigh surface areas, ultrahigh porosity, and tunable pore size.22–24 Among the thousands of MOFs that have been introduced so far, one of the most prominent materials is MIL-101 (Cr).25 MIL-101 (Cr) has been utilized as an adsorbent due to it having certain attractive features, such as large pore size, ultrahigh surface area, excellent chemical stability, and low cost.26,27 However, magnetic separation technology has attracted more attention for wastewater treatment regarding the secondary pollutants, due to their superparamagnetic properties, which means they can be easily separated by an external magnetic field and recycled. Accordingly, in recent year researchers have mainly focused on magnetic materials due to their operational ease of use and low cost, including Fe3O4/NH2-MIL-101 (Fe), used for phosphate removal from aqueous solution,28 magnetic MIL-100 (Fe) for rhodamine B adsorption,29 Fe3O4/MIL-101 (Cr) as a catalyst for the oxidation of benzyl alcohol,30 and Fe3O4/Cu3(BTC)2 for methylene blue removal.31
In this work, a new magnetic ternary hybrid nanocomposite, namely P2W18O62@Fe3O4/MIL-101 (Cr), was prepared by a simple one-step solvothermal method. The adsorption of MB, MO, and RhB organic dyes onto P2W18O62@Fe3O4/MIL-101 (Cr) and the effects of the adsorbent dosage, initial dye concentration, contact time, initial solution pH, and temperature on the adsorption process system were systematically explored. The composite exhibited a high adsorption rate and selective adsorption ability for cationic dyes, like MB and RhB, compared to that of the isolated MIL-101 framework. Moreover, the adsorption isotherm, kinetic, adsorption mechanism, and thermodynamic parameters of dyes on the composite were thoroughly analyzed.
2 Experimental
2.1. Materials and methods
Chromium(III) nitrate (Cr(NO3)3·9H2O, 99%), terephthalic acid (TPA, 98%), sodium tungstate (Na2WO4·2H2O, 99%), iron(III) chloride anhydrous (FeCl3, 99%), iron(II) chloride tetrahydrate (FeCl2·4H2O, 99%), phosphoric acid (H3PO4, 85%), and sodium hydroxide (NaOH, 98%) were provided from Sigma-Aldrich. All the solvents were purchased from Aldrich and Merck companies. Potassium chloride (KCl, 98%), hydrochloric acid (HCl, 35%), methylene blue (MB, C16H18ClN3S, 99%), methyl orange (MO, C14H14N3NaO3S, 99%), and rhodamine B (RhB, C28H31ClN2O3, 99%) were purchased from Merck company.
2.2. Synthesis of MIL-101 (Cr)
MIL-101 (Cr) was fabricated by a hydrothermal method. The detailed procedure for the fabrication of MIL-101 (Cr) is as follows: Cr(NO3)3·9H2O (2.4 g) and terephthalic acid (H2BDC, 0.98 g) were added to 29 mL distilled water and the mixture was stirred for 20 min at room temperature. The suspension was transferred into a 50 mL Teflon-lined autoclave and then heated for 24 h at 200 °C. Then, it was slowly cooled at room temperature and the green raw product obtained was washed with DMF at 60 °C for 3 h and was washed with ethanol at 70 °C for 2.5 h. Finally, the green solid was separated by centrifugation and then dried at room temperature.
2.3. Synthesis of P2W18O62@MIL-101 (Cr)
The K6P2W18O62 was prepared according to a literature procedure.32 The P2W18O62@MIL-101 (Cr) nanohybrid was fabricated as follows: A mixture of Cr (NO3)3·9H2O (2.0 g, 5 mmol), H2BDC (0.83 g, 5 mmol), K6P2W18O62 (2.0 g, 0.7 mmol) in 20 mL of distilled water was dispersed by sonication for 15 min, resulting in a dark blue-colored solution at pH 2.58. The mixture was transferred to a 50 mL Teflon-lined autoclave and then heated at 200 °C for 18 h. Then, it was cooled at room temperature, the obtained green powder was separated by centrifugation at 5000 rpm for 15 min and washed five times with deionized water, ethanol, acetone, before being dried at room temperature.
2.4. Synthesis of Fe3O4/MIL-101 (Cr)
The magnetic nanohybrid was fabricated by dissolving 0.5 g of MIL-101 (Cr) into 100 mL deionized water, forming a suspension, and then 1 mmol of FeCl2·4H2O and 2 mmol FeCl3 were added to this suspension. Then, the suspension was stirred for 1 h under N2, followed by the addition of NH3 solution (15 mL) to form a black suspension. The resulting black solid was filtered off and washed with double distilled water repeatedly until the pH became neutral. After drying in air, the nanohybrid was designated as Fe3O4/MIL-101 (Cr). The Fe content (20 wt%) in the composite was calculated from ICP-AES technique.
2.5. Synthesis of P2W18O62@Fe3O4/MIL-101 (Cr)
The magnetic P2W18O62@Fe3O4/MIL-101 (Cr) nanohybrid was synthesized as follows: 0.5 g of the as-prepared black Fe3O4/MIL-101 (Cr) powder and 0.5 g of K6P2W18O62 were dissolved in 20 mL of distilled water. Afterward, the mixture was stirred for 8 h at room temperature and then transferred to a 50 mL Teflon-lined autoclave and heated at 200 °C for 20 h. The product was washed with distilled water and then cooled slowly at room temperature. The precipitate was separated from the aqueous solution by a magnet. The ICP-AES analysis results indicated that the loading amount of P2W18 in the as-prepared P2W18/MIL-101 nanocomposite was estimated to be 26.5%.
2.6. Characterization methods
The FT-IR spectrum was recorded using a Shimadzu-8400S (Japan) spectrometer in the wavenumber range 400–4000 cm−1. Powder X-ray diffraction (PXRD) patterns were recorded using a Philips X-Pert diffractometer (Philips 8440) at 40 kV between 2.0 and 60.0 (2θ) with V-filtered Cr Kα radiation (λ = 2.289 °A). UV-vis spectra were performed on a Cary 100 Conc Varian Spectrophotometer. BET measurements were carried out using N2 as the adsorbing gas and a surface area analyzer (Micrometrics PHS-1020, Japan). The sample in the nitrogen atmosphere was slowly heated to 200 °C for 4 h. The morphological attributes of the pure and modified magnetic nanohybrid were obtained using a scanning electron microscopy system (SEM, MIRA3 TESCAN) coupled with energy-dispersive X-ray analysis (EDX). The magnetic (VSM) measurements were performed investigated using a vibrating magnetometer MDKFD (Daneshpajooh Co., Kashan, Iran) with a maximum magnetic field of 10 kOe. Raman spectra were obtained using a Raman microscope (Senterra 2009, Germany) with 785 and 514 nm lines.
2.7. Adsorption tests
The aqueous stock solutions (250 mg L−1) of MB, RhB, and MO powders were prepared by dissolving solid MB, MO, and RhB in deionized water. Then, the dye solutions of MB, MO, and RhB were provided with consecutive dilutions using distilled water. The concentration of MB, MO, and RhB were investigated using the UV-vis spectrophotometer at 664, 463, and 553 nm, respectively. The calibration curves at the concentration range of 150–200 mg L−1 for MB and 100–150 mg L−1 for RhB were acquired from the adsorption of the standard solutions. To obtain the favorable adsorption conditions, different types of parameters, such as initial dye concentration, adsorbent dosage, and adjustment of pH, and the effect of temperature, were studied. In order to study the effect of the initial concentration, 30 mg of the magnetic adsorbent was exactly weighed and poured into 30 mL of RhB, MB, and MO dye solution with a concentration range from 25 to 250 mg L−1. The study of the effect of pH on the adsorption process was performed and the initial pH of the RhB and MB solutions was adjusted in the range of 2–10 by adding NaOH or HCl solutions, respectively. The pH of the solution for MB and RhB was adjusted to 6. The mixture was poured into an Erlenmeyer flask and stirred at 25 °C for 20 min at a speed of 300 rpm and then the magnetic adsorbent was separated by a magnet. Subsequently, the equilibrium concentration was investigated for MB and RhB using the UV-vis spectrophotometer. Additionally, the magnetic nanohybrid was transferred into mixtures of MO&MB, MO&RhB, RhB&MB, and MB&RhB&MO (v/v 1/1, 30 mL, 25 mg L−1) for investigating the selective adsorption. Then, for the next adsorption, the adsorbent was dried and reused. According to the following eqn (1), the equilibrium adsorption capacity qe (mg g−1) could be computed.| |
 | (1) |
The elimination efficiency of the dyes by the nanohybrid was computed using eqn (2):
| |
 | (2) |
where
C0 and
Ct (mgL
−1) are the initial and
t time of dye concentrations (mg L
−1), respectively. Also, in the adsorption process,
V was used as the dye volume (L) and
m as the mass of the P
2W
18O
62@Fe
3O
4/MIL-101 (Cr).
33
The sorption kinetic experiments were performed in the same system with 30 mL of MB solution (150, 175, 200 mg L−1) at pH 6 and 30 mL of RhB solution (100, 125, 150 mg L−1) at pH 6 upon the addition of 30 mg of P2W18O62@Fe3O4/MIL-101 (Cr), respectively. At a specified time interval, the remaining concentrations of the dyes were measured using the UV-Vis spectrophotometer.
The adsorption isotherms of MB and RhB on P2W18O62@Fe3O4/MIL-101 (Cr) were investigated under optimized conditions. The concentrations of the dye varied from 25 to 200 mg L−1 with 30 mg of magnetic nanohybrid. To obtain the thermodynamic parameters of the sorption process, dyes adsorption at different temperatures (25–75 °C) was investigated without any change in the other conditions.
2.8. Desorption studies
The magnetic nanohybrid was separated from the dye solution via a magnet after each adsorption experiment and washed three times with 50 mL of the mixed water–ethanol (1![[thin space (1/6-em)]](https://www.rsc.org/images/entities/char_2009.gif) :
:![[thin space (1/6-em)]](https://www.rsc.org/images/entities/char_2009.gif) 1, v/v) solvent containing 0.1 mol L−1 of NaCl at room temperature. Then, the regenerated adsorbent was dried at room temperature and reused for the next adsorption experiment.
1, v/v) solvent containing 0.1 mol L−1 of NaCl at room temperature. Then, the regenerated adsorbent was dried at room temperature and reused for the next adsorption experiment.
3 Results and discussion
3.1. FT-IR analysis
To confirm the presence of P2W18O62 and Fe3O4 within the pores and the structure of MIL-101 (Cr), the magnetic nanohybrid P2W18O62@Fe3O4/MIL-101 was characterized by the FT-IR spectra. As shown in Fig. 1(a), the strong vibrational band of MIL-101 (Cr) around 1394 cm−1 was related to the (O–C–O)˙− groups from the dicarboxylate in the framework.34,35 The vibrational band around 1519 cm−1 indicated C![[double bond, length as m-dash]](https://www.rsc.org/images/entities/char_e001.gif) C bonds and the band around 1631 cm−1 was related to the aromatic group.36 In Fig. 1(b), the characteristic bands of Dawson heteropolyanion are displayed at 1091 (the stretching frequency of P–O of the central PO4 tetrahedron), 960 (W
C bonds and the band around 1631 cm−1 was related to the aromatic group.36 In Fig. 1(b), the characteristic bands of Dawson heteropolyanion are displayed at 1091 (the stretching frequency of P–O of the central PO4 tetrahedron), 960 (W![[double bond, length as m-dash]](https://www.rsc.org/images/entities/char_e001.gif) O terminal bands), and 912 and 775 cm−1 (W–O–W “inter” and “intra” W–O–W bridges), respectively.37,38 As shown in Fig. 1(c), the band appearing at 570 cm−1 is attributed to the vibrational band of the Fe–O of Fe3O4. Also, in Fig. 1(f), after forming the P2W18@Fe3O4/MIL-101 (Cr) nanohybrid, the characteristic peaks related to MIL-101 (Cr) are almost the same. Additionally, four P2W18 peaks and Fe3O4 related bands are well retained in the P2W18@Fe3O4/MIL-101 (Cr) sample. However, these are slightly shifted peaks compared with the pure Dawson-type P2W18 and Fe3O4. These shifts imply that interactions exist between the Dawson-type anion and Fe3O4 with MIL-101 (Cr).
O terminal bands), and 912 and 775 cm−1 (W–O–W “inter” and “intra” W–O–W bridges), respectively.37,38 As shown in Fig. 1(c), the band appearing at 570 cm−1 is attributed to the vibrational band of the Fe–O of Fe3O4. Also, in Fig. 1(f), after forming the P2W18@Fe3O4/MIL-101 (Cr) nanohybrid, the characteristic peaks related to MIL-101 (Cr) are almost the same. Additionally, four P2W18 peaks and Fe3O4 related bands are well retained in the P2W18@Fe3O4/MIL-101 (Cr) sample. However, these are slightly shifted peaks compared with the pure Dawson-type P2W18 and Fe3O4. These shifts imply that interactions exist between the Dawson-type anion and Fe3O4 with MIL-101 (Cr).
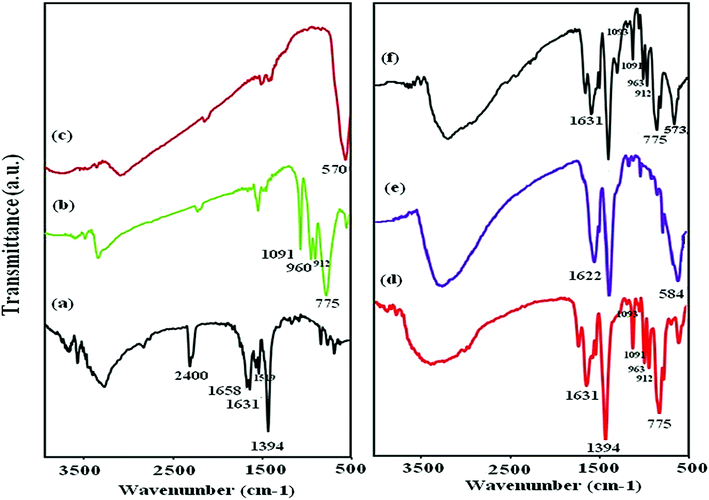 |
| | Fig. 1 FT-IR spectra of (a) MIL-101 (Cr), (b) P2W18O62, (c) Fe3O4 (d) P2W18O62@MIL-101 (Cr), (e) Fe3O4/MIL-101 (Cr), and (f) P2W18O62@Fe3O4/MIL-101 (Cr). | |
3.2. XRD analysis
XRD analysis was used to confirm the formation of P2W18O62@Fe3O4/MIL-101 (Cr). The XRD pattern of MIL-101 (Cr), P2W18O62, Fe3O4, P2W18O62@MIL-101 (Cr), Fe3O4/MIL-101 (Cr), and P2W18O62@Fe3O4/MIL-101 (Cr) are shown in Fig. 2(a)–(f). All of the diffraction peaks are in agreement with the standard literature amounts and no other phases or impurity peaks were detected in these XRD patterns.39,40 Only the widths and diffraction peak intensities demonstrated some changes, confirming the successful synthesis and the purity of MIL-101 (Cr). The XRD patterns of the various samples are indicated in Fig. 2, which show almost no difference among the pure MIL-101 (Cr) with the hybrids. Consequently, the XRD patterns of MIL-101 (Cr), P2W18O62@MIL-101 (Cr), and P2W18O62@Fe3O4/MIL-101 (Cr) mainly resemble each other, which indicated that the crystalline structure MIL-101 (Cr) was preserved after various loadings by Fe3O4 and P2W18 O62. Therefore, the low intensities of the diffraction peaks of P2W18O62 in the nanohybrid were probably due to the uniform distribution of the P2W18O62 within the MIL-101 (Cr) porous structure.41 Also, the low intensity of Fe3O4 in the XRD pattern of Fe3O4/MIL-101 was probably due to the low amount of Fe3O4 in the hybrid. Moreover, the XRD pattern together with FT-IR spectra demonstrated that the introduction of P2W18O62 and Fe3O4 within the 3D structure of the MIL-101 (Cr) did not lead to the destruction/collapse of the framework. Hence, a number of changes in the XRD reflection severities was seen in contrast with the MIL-101 (Cr) framework, which could be related to the strong interaction among P2W18O62, Fe3O4, and the MIL-101 (Cr) surface.42
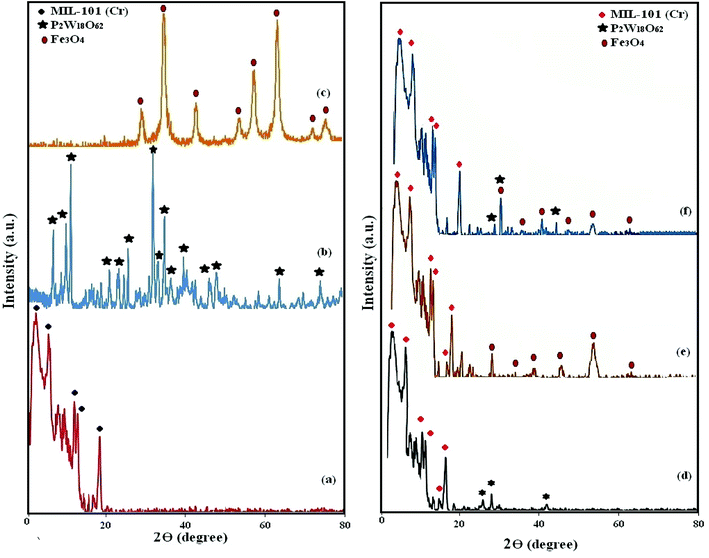 |
| | Fig. 2 XRD patterns of (a) MIL-101 (Cr), (b) P2W18O62, (c) Fe3O4, (d) P2W18O62@MIL-101 (Cr), (e) Fe3O4/MIL-101 (Cr), and (f) P2W18O62@Fe3O4/MIL-101 (Cr). | |
3.3. Raman analysis
Raman spectroscopy was used to confirm the structural phase of MIL-101 (Cr), P2W18O62, P2W18O62@MIL-101 (Cr), and P2W18O62@Fe3O4/MIL-101 (Cr) nanomaterials. As shown in Fig. 3(a), the vibrational bands of MIL-101 (Cr) appeared at 1618, 1461, 1149, and 873 cm−1, indicating aromatic and dicarboxylate groups in H2BDC.43 The Raman spectrum of P2W18O62 in Fig. 3(b) shows characteristic bands at 993 cm−1 (P–O), 919 and 854 cm−1 (W–Ob/c–W; Ob/c = bridging oxygens), and 967 cm−1 (W = Ot; Ot = terminal oxygen).39 As shown in Fig. 3(c), the terminal W![[double bond, length as m-dash]](https://www.rsc.org/images/entities/char_e001.gif) O stretch is shifted to lower frequency upon coupling with MIL-101 (Cr), which may be due to chemical interaction between P2W18O62 and MIL-101 (Cr).44 The FT-Raman spectrum of the magnetic nanohybrid in Fig. 3(d) shows three bands of Fe3O4 at 200, 680, and 757 cm−1 and two bands of the P2W18O62, besides the characteristic bands of MIL-101 (Cr). Then, Raman spectroscopy confirmed the coexistence of P2W18O62, Fe3O4, and MIL-101 (Cr) in the hybrid nanomaterial.45
O stretch is shifted to lower frequency upon coupling with MIL-101 (Cr), which may be due to chemical interaction between P2W18O62 and MIL-101 (Cr).44 The FT-Raman spectrum of the magnetic nanohybrid in Fig. 3(d) shows three bands of Fe3O4 at 200, 680, and 757 cm−1 and two bands of the P2W18O62, besides the characteristic bands of MIL-101 (Cr). Then, Raman spectroscopy confirmed the coexistence of P2W18O62, Fe3O4, and MIL-101 (Cr) in the hybrid nanomaterial.45
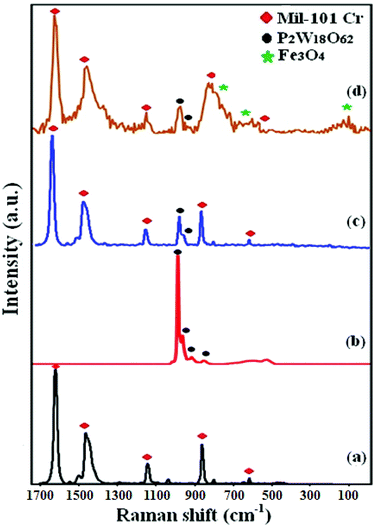 |
| | Fig. 3 Raman spectra of (a) MIL-101 (Cr), (b) P2W18O62, (c) P2W18O62@MIL-101 (Cr), (d) P2W18O62@Fe3O4/MIL-101 (Cr). | |
3.4. SEM analysis
The morphology and microstructure of the MIL-101 (Cr), P2W18O62@MIL-101 (Cr), Fe3O4/MIL-101 (Cr), and magnetic nanohybrid samples were clarified by FE-SEM observations as shown in Fig. 4. Fig. 4(a) and (b) exhibit the FE-SEM images of the pristine MIL-101 (Cr) particles. They show that the MIL-101 (Cr) particles were regular polyhedral (mainly octahedral) in shape with a relatively narrow size distribution. The sizes of these octahedral crystals were in the submicrometer range (0.4–1.0 μm). The SEM images of the binary P2W18O62@MIL-101 (Cr) and Fe3O4/MIL-101 (Cr) samples in Fig. 4(c)–(f) show that their shape and morphology were similar with the pristine MIL-101 (Cr) but the observation of polyhedrons was difficult. From Fig. 2(g) and (h), we can easily see that the morphology of the ternary P2W18O62@Fe3O4/MIL-101 (Cr) sample was quite different compared to that of the pristine MIL-101 (Cr). The SEM images of P2W18O62@Fe3O4/MIL-101 (Cr) do not display clear polyhedral morphologies. However, the XRD, FT-IR, and Raman results confirmed that the framework of MIL-101 (Cr) did not degrade or collapse after the incorporation of P2W18O62 and Fe3O4 phases, although its morphology was changed.
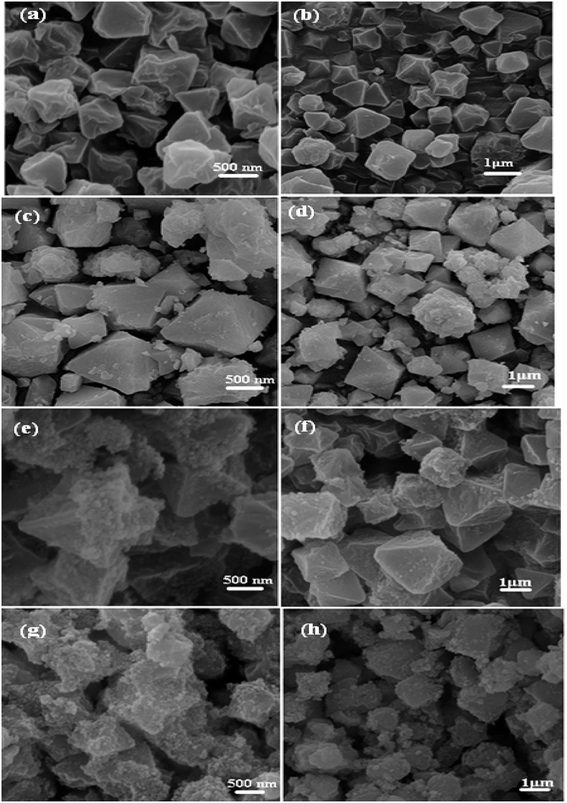 |
| | Fig. 4 SEM images of (a and b) MIL-101 (Cr), (c and d) P2W18O62@MIL-101 (Cr), (e and f) Fe3O4/MIL-101 (Cr), and (g and h) P2W18O62@Fe3O4/MIL-101 (Cr). | |
3.5. Energy dispersive spectroscopy (EDX)
Energy dispersive X-ray (EDX) analysis was used to confirm the composition of the as-prepared nanohybrid. As observed in Fig. 5(a), the EDX elemental spectrum of the ternary nanohybrid sample exhibits elemental peaks corresponding to K6P2W18O62 (K, P, O, and W), Fe3O4 (Fe, O), and MIL-101 (Cr) (C, O, and Cr), with no other impure peaks observed, indicating that the composite sample was composed of P2W18O62, Fe3O4, and MIL-101 (Cr). Fig. 5(b) shows a SEM image of the nanohybrid with the corresponding EDX elemental mappings. From the maps, it can be seen that the C, O, Cr, Fe, K, P, and W elements are uniformly distributed over the image, confirming the homogeneity of the sample. The EDX mappings results show that the shape of the product was similar to that observed by FESEM.
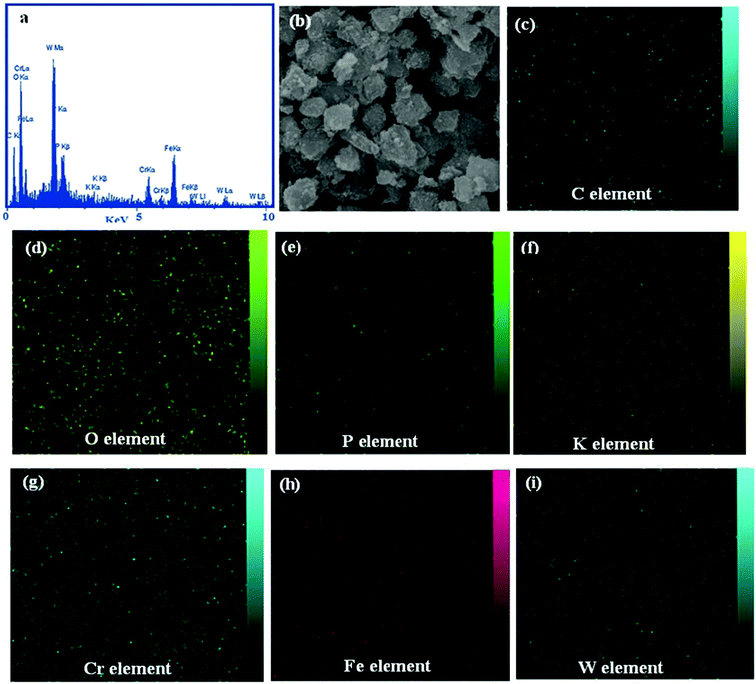 |
| | Fig. 5 (a) EDX spectrum, and (b)–(i) a representative SEM image of the P2W18O62@Fe3O4/MIL-101 (Cr) magnetic nanohybrid with corresponding EDX elemental mappings. | |
3.6. BET specific surface areas analysis
N2 adsorption/desorption measurements were performed to investigate the specific surface area and the pore size distribution of the samples. The N2 adsorption–desorption isotherms and pore size distributions of MIL-101, P2W18O62@MIL-101 (Cr), and P2W18O62@Fe3O4/MIL-101 (Cr) are shown in Fig. 6(a). On the basis of the IUPAC classification, the N2 adsorption–desorption isotherms of the three samples reveal mixed type I/IV isotherms with an H2-type hysteresis loop, which is characteristic of solids with microporous windows and mesoporous cages.35,46 The textural properties of these materials, including the BET surface area (SBET), the Langmuir surface area (SLan), microporous volume (Vmi), mesoporous volume (Vme), and total pore volume (Vtotal), are summarized in Table 1. Compared with the pristine MIL-101, the encapsulated samples demonstrated a significant decrease in surface area, pore volume, and pore diameter owing to the insertion of heteropolyanions into the cages of the MOF. The pores of P2W18O62@Fe3O4/MIL-101 (Cr) were further occupied by the heteropolyanions, which resulted in a further decrease in pore volume and surface area. The Barrett–Joyner–Halenda (BJH) pore-size distributions in Fig. 6(b) also confirmed the mesoporous cages of MIL-101 and reflected the volume changes during the encapsulation process. These findings confirm that the heteropolyanion had been encapsulated within the channels of MIL-101 (Cr) rather than outside the surfaces.
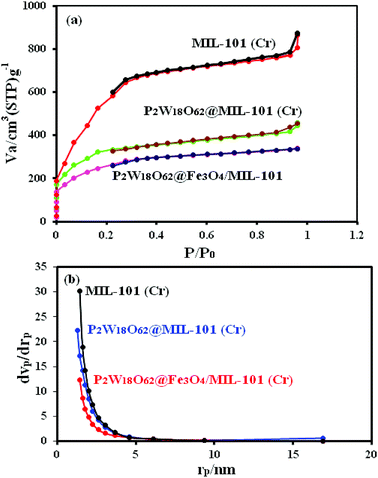 |
| | Fig. 6 (a) Nitrogen adsorption–desorption isotherm and (b) pore-size distributions of MIL-101 (Cr), P2W18O62@MIL-101 (Cr), and P2W18O62@ Fe3O4/MIL-101 (Cr) nanohybrid. | |
Table 1 Textural parameters of the samplesa
| Sample |
SBET (m2 g−1) |
SLan (m2 g−1) |
Vtotl (cm3 g−1) |
Vmi |
Vme |
Dtotal (nm) |
| SBET: BET surface area, SLan: Langmuir surface area, Vtotal: total pore volume, Vmi: micropore volume calculated using t-plot method, Vme: mesopore volume calculated using BJH method, D: average pore diameter. |
| MIL-101 Cr |
2692.403 |
3455 |
2.481 |
0.045 |
2.436 |
0.768 |
| P2W18 O62@MIL-101 |
1167.413 |
1671 |
1.108 |
0.029 |
1.079 |
0.504 |
| P2W18O62@ Fe3O4/MIL-101 |
934.892 |
1365 |
1.231 |
0.017 |
1.214 |
0.48 |
3.7. Vibrating sample magnetometer (VSM) properties
The magnetic properties of the pure Fe3O4, Fe3O4/MIL-101 (Cr), and P2W18O62@Fe3O4/MIL-101 (Cr) samples were investigated by VSM at room temperature, and the magnetic hysteresis loops are depicted in Fig. 7. It is clear that all the samples were superparamagnetic materials, as their magnetic hysteresis loops passed through the origin of the coordinates. The saturation magnetizations (Ms) values of the pure Fe3O4, Fe3O4/MIL-101 (Cr), and P2W18O62@Fe3O4/MIL101 (Cr) nanohybrids were 72, 35, and 25 emu g−1, respectively. The Ms of the magnetic P2W18O62@Fe3O4/MIL101 (Cr) composite decreased by approximately 70% compared with that of pure Fe3O4, which can be attributed to the less magnetic source component (Fe3O4) per gram in the composite sample. However, the saturation magnetization of the composite could satisfy the requirements of easy separation in the suspension solution by using an extra magnet after the reaction, as shown in the inset of Fig. 7. Thus, the P2W18O62@Fe3O4/MIL101 (Cr) nanohybrid could be easily separated using a magnetic separation process after being used for the removal of dye pollutants from aqueous solutions.
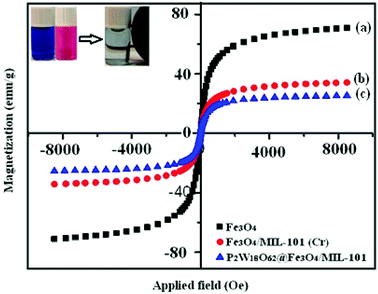 |
| | Fig. 7 Magnetic hysteresis loop of (a) Fe3O4, (b) Fe3O4/MIL-101 (Cr), and (c) P2W18O62@Fe3O4/MIL-101 (Cr) at room temperature. The inset shows the behavior of the nanohybrid under an external magnetic field. | |
3.8. Dye adsorption studies
In this work, to evaluate the adsorption capability of the P2W18O62@Fe3O4/MIL-101 (Cr) nanohybrid for the removal of dyes from contaminated waters, three organic dyes (MB, RhB, MO) with different charges and sizes for the experiments were used. Their adsorption was specified using the characteristic UV-Vis adsorption band. These bands decreased gradually with adsorption time, indicating the decrease of the dye amount in the solution. UV-Vis spectra of dyes adsorption by the P2W18O62@Fe3O4/MIL-101 (Cr) are shown in Fig. 8(a) and (b). The results demonstrate that the adsorption peaks of MB and RhB at 664 and 553 nm were completely disappeared within 0.5 and 4 min, respectively, with an adsorption efficiency of 100%. The adsorption of MO from aqueous solution by the magnetic nanohybrid appeared after 40 min with a removal efficiency of 60%. The results show that the nanohybrid was a poor adsorbent for removing anionic MO dye from aqueous solutions. This was due to the presence of highly electronegative POM, which largely improved the adsorption ability of the porous material MIL-101 (Cr), which together with a large number of negative charges may have a stronger force with the positive charges of the dyes. Thus, the magnetic nanohybrid demonstrated excellent adsorption performance with respect to the cationic MB and RhB dyes. The MO dye, due to the negative charges of its molecules, interacted with the POM loaded on the nanohybrid, leading to the reduced adsorption of MO molecules on the surface of the nanohybrid.
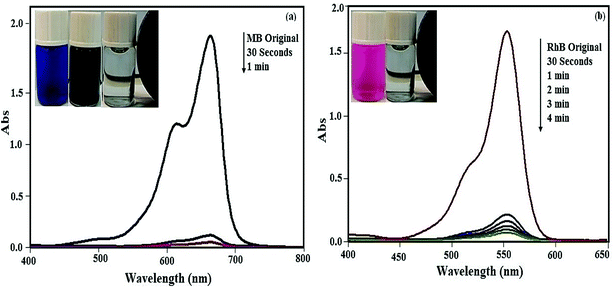 |
| | Fig. 8 UV-Vis spectral changes of dyes aqueous solutions with P2W18O62@Fe3O4/MIL-101 (Cr) at different time intervals: (a) MB dye, (b) RhB dye. [Dye] = 25 mg L−1, adsorbent: 30 mg at 25 °C. | |
3.8.1. Effect of some important parameters on dye adsorption. The initial pH of dye solution can impress the adsorption on the surface of the adsorbent.48,49 The compounds of P2W18O62, Fe3O4, and MIL-101 (Cr) were stable under ordinary conditions, but the metals chromium, tungsten, and iron ion are easily hydrolyzed in highly alkaline aqueous solutions.4 Therefore, the adsorption investigations toward MB and RhB were performed at pH 2–10. First, 30 mg of the absorbent was added to 30 mL of dye solution for determining the adsorption capacity at various pH values. The solution pH was adjusted with HCl or NaOH. Subsequently, the mixture was stirred for 17 min and the residual concentration of the dye was characterized using a UV-vis spectrophotometer. These results showed that the magnetic nanohybrid was stable in the aqueous solution of the organic dyes. As shown in Fig. 9(a), the nanohybrid had a similar adsorption rate for the MB and RhB in the solutions with various pH amounts. In fact, it can be stated that this nanohybrid is applicable in a wide pH range.
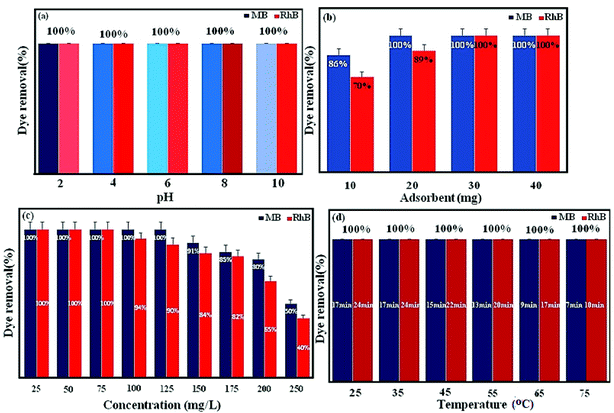 |
| | Fig. 9 Effect of (a) pH, (b) adsorbent dosage, (c) dye concentration, and (d) different temperatures on the removal of MB and RhB dyes. | |
The initial dosage of adsorbent in the adsorption process plays an important role as the adsorbent dosage for wastewater treatment is important. The influence of the adsorbent dosage was assessed at a mass ranging from 10 to 40 mg, while other conditions were kept unchanged, such as 30 mL of dye solution (100 mg L−1) with a pH value of 6 for MB and 30 mL of dye solution (50 mg L−1) with a pH value of 6 for RhB. As shown in Fig. 9(b), the removal became more and more efficient upon increasing the adsorption from 10 to 30 mg and then was hardly influenced by further increasing the amount of the adsorbent to 40 mg. This profile showed that 30 mg adsorbent would provide a high enough surface area and more available adsorption sites. This can be related to the splitting effect of the flux (concentration gradient) between the adsorbate and adsorbent. Consequently, the suitable adsorbent dosage was held at 30 mg.
The effect of the initial dye concentration was studied on dye removal. Experiments were carried out in various dye concentrations (25, 50, 75, 100, 125, 150, 175, 200, and 250 mgL−1) under the conditions of 30 mgL−1 for MB and RhB, pH 6, and 30 mL dye solution. As shown in Fig. 9(c), with the increase in the initial dye concentration, the elimination of dye was reduced. This can be attributed by the fact that the active sites on the adsorbent for dye removal decrease when the dye concentration increased. For further detail, some of the results for the nanohybrids based on POMs, Fe3O4, and MIL-101 (Cr) for the removal of dye pollutants are summarized in Table 2. Comparing the obtained results here with the mentioned nanohybrids in Table 2 demonstrates the excellent removal efficiency of magnetic nanohybrid.
Table 2 Comparison of the adsorption capacities of MB and RhB onto some typical adsorbents
| Adsorbent |
Adsorbate |
Maximum adsorption capacity (mg g−1) |
Ref. |
| Graphene oxide/beta zeolite |
Rhodamine B |
64.47 |
22 |
| Zeolite |
Rhodamine B |
13.22 |
51 |
| Reduced GO/ZnO |
Rhodamine B |
32.6 |
52 |
| Beta |
Rhodamine B |
27.97 |
22 |
| GB-1 |
Rhodamine B |
39.26 |
22 |
| GB-2 |
Rhodamine B |
48.47 |
22 |
| GO-zeolite |
Rhodamine B |
55.56 |
53 |
| Activated carbon |
Rhodamine B |
28.49 |
54 |
| MRGO-4 composite |
Rhodamine B |
13.15 |
33 |
| Zeolite |
Methylene blue |
21.74 |
51 |
| GO |
Methylene blue |
199.2 |
55 |
| Fe3O4/MIL-100 (Fe) |
Methylene blue |
49 |
56 |
| MOF-235 |
Methylene blue |
187 |
57 |
| MIL-53(Al)–NH2 |
Methylene blue |
167 |
58 |
| Cu-BTC |
Methylene blue |
4.4 |
59 |
| MIL-101 (Cr) |
Methylene blue |
22 |
60 |
| P2W18O62@Fe3O4/MIL-101 (Cr) |
Methylene blue |
200 |
Present study |
| P2W18O62@Fe3O4/MIL-101 (Cr) |
Rhodamine B |
164 |
Present study |
The adsorption investigations were carried out at various temperatures (25 °C, 35 °C, 45 °C, 55 °C, 65 °C, and 75 °C) and the results are shown in Fig. 9(d). The temperature increasing raises the adsorption rate and shows that the adsorption is an endothermic and spontaneous process. This can lead to an increment in dye mobility with the increment in temperature.7 An increasing number of molecules may also obtain enough energy to undergo an interaction with active sites at the surface. Moreover, increasing the temperature can create a swelling effect in the internal structure of the P2W18O62@Fe3O4/MIL-101 (Cr), enabling bulky dye molecule to infiltrate further.50
The effect of the loading amount of P2W18O62 in the P2W18O62@Fe3O4/MIL-101 (Cr) adsorbent on the adsorption process is illustrated in Fig. 10. With the increase in the loading amount of P2W18O62 from 15 to 26.5 wt%, the dye adsorption efficiency increased from 85% (for MB) and 80% (for RhB) to 100%, but with further increasing the P2W18O62 loading to 35 and 45 wt%, the adsorption efficiency is then reduced. This may be due to the decrease in active sites resulting from the higher loading amount of P2W18O62 in the cavities of MIL 101 (Cr), which inhibit the further adsorption of dye molecules. Based on the results, a P2W18O62 loading of 26.5 wt% was chosen as the optimal amount.
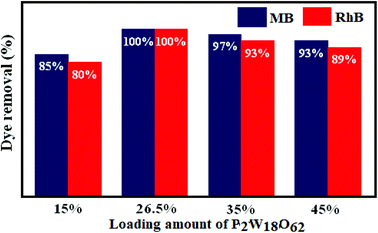 |
| | Fig. 10 Effects of different loading amounts of P2W18O62 in MIL-101 (Cr) on the removal of MB and RhB dyes. | |
To indicate the effect of anionic P2W18O62 in the magnetic nanohybrid, a series of control experiments on P2W18O62@Fe3O4/MIL-101 (Cr), P2W18O62@MIL-101 (Cr), MIL-101 (Cr), Fe3O4, Fe3O4/MIL-101 (Cr), and pure P2W18O62 were performed for the removal of the MB and RhB dyes. As shown in Fig. 11, the UV-Vis time-dependent adsorption spectra were investigated for the adsorption ability of P2W18O62@ Fe3O4/MIL-101 (Cr), P2W18O62@MIL-101 (Cr), MIL-101, Fe3O4, Fe3O4/MIL-101 (Cr), and P2W18O62. The removal efficiency of these materials toward MB and RhB dyes was 25–100% and 22–100% after long adsorption times of 1–70 min and 4–70 min, respectively. Apparently, the removal efficiencies of bare materials are much lower than those of the hybrid nanomaterial for cationic MB and RhB dyes. So, there is still merit in exploring the magnetic nanohybrid as an efficient adsorbent toward cationic MB and RhB dyes.
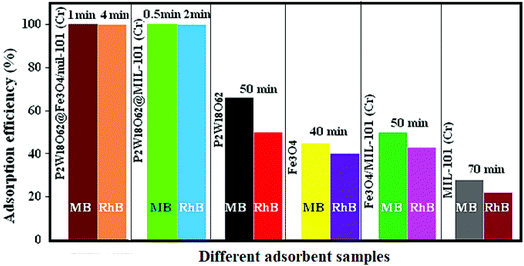 |
| | Fig. 11 Adsorption efficiency of MB and RhB dyes in the presence of different adsorbent samples. | |
3.8.2. Selective adsorption ability of the nanohybrid for the mixed organic dyes. As shown in Fig. 12, to confirm that the nanohybrid had the capability to separate MB, RhB, and MO dye molecules, a mixture of the dyes solution was selected to specify the selective adsorption capacity of the solid nanohybrid. As can be seen in the figure, the adsorption peaks of MB and RhB all disappeared quickly, just leaving the characteristic adsorption peaks of MO, indicating that the nanohybrid could selectively capture cationic MB and RhB dyes when exposed to the corresponding binary and triple mixture. This finding confirmed that the nanohybrid also possessed a selective adsorption ability toward the cationic dyes in wastewater.
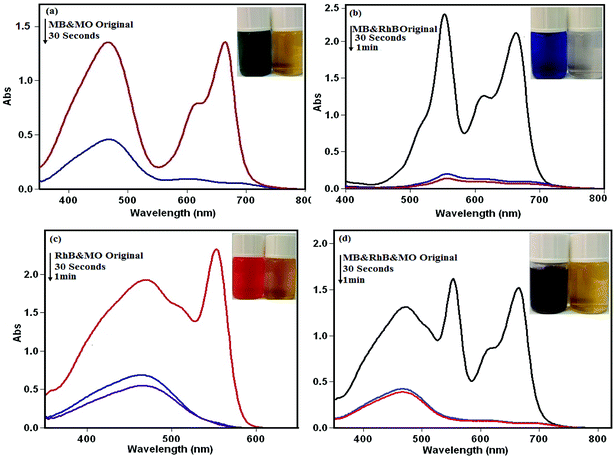 |
| | Fig. 12 Selective adsorption ability of P2W18O62@Fe3O4/MIL-101 (Cr) toward mixed dyes solution of (a) MB&MO, (b) MB&RhB, (c) RhB&MO, (d) MB&RhB&MO. Conditions: C0 (MB) = C0 (RhB) = C0 (MO) = 25 mg L−1, and adsorbent dose = 30 mg/30 mL. | |
3.8.3. Adsorption kinetics. The adsorption kinetic gives data about the mechanisms of adsorption, which is necessary to know the rate of adsorption during the removal of pollutants from wastewater to optimize the parameters. In conclusion, in the adsorption system design, the most important factor is predicting the rate at which adsorption takes place for a given system. To design and create an effective and fast model, studies were done on the adsorption rate. For the examination of the controlling mechanisms of the adsorption process, such as the chemical reaction, diffusion control, and mass transfer, several kinetics models (pseudo-first order, pseudo-second order, and intraparticle diffusion) were used to test the experimental data.60,61The pseudo-first-order equation is illustrated by the following:62
| |
 | (3) |
where
qe and
k1 are the amount of dye adsorbed at equilibrium (mg g
−1) and the equilibrium rate constant of pseudo-first order kinetics (1/min), respectively. The straight-line plots of log(
qe −
qt)
versus t for the adsorption of MB and RhB onto P
2W
18O
62@Fe
3O
4/MIL-101 (Cr) at different dye concentrations (150, 175, and 200 mg L
−1) were tested to acquire the rate parameters. The
k1,
qe, and correlation coefficients (
R2) under different dye concentrations values were computed as plots and the results are listed in
Table 3. To the MB dye, values of the correlation coefficient
R2 acquired were in the range of 0.9667–0.9946 and for RhB dye, the values of the correlation coefficient
R2 acquired were in the range 0.9454–0.9896. Moreover, the experimental values of
qe, cal were lower than the experimental values of
qe, exp. The coefficients of the pseudo first-order and second-order models are summarized in
Table 2. It can be seen that the correlation coefficient
R2 of the pseudo second-order model were higher than 0.99, but those of the pseudo first-order model were not satisfactory. Furthermore,
qe, cal calculated by the pseudo second-order model were much closer to the experimental
qe, exp as compared with the pseudo first-order model. All of these prove that the adsorption of MB and RhB on P
2W
18O
62@Fe
3O
4/MIL-101 (Cr) followed the pseudo second-order model.
Table 3 Kinetics constants for MB and RhB adsorption at 150, 175, and 200 mg L−1 dye concentrations (pH = 6, T = 25 °C, and adsorbent: 30 mg)
| Dye |
qe, exp (mg g−1) |
Pseudo-first-order kinetic |
Pseudo-second-order kinetic |
Intraparticle diffusion |
| k1 (min−1) |
qe, cal (mg g−1) |
R12 |
k2 (g mg−1 min−1) |
qe, cal (mg g−1) |
R22 |
kp |
I |
R32 |
| MB |
| 150 |
147.6 |
0.07 |
5 |
0.967 |
0.009 |
149.3 |
1 |
6.7 |
82.4 |
0.4349 |
| 175 |
169.3 |
0.05 |
13 |
0.995 |
0.005 |
172.4 |
0.9999 |
8.08 |
91.07 |
0.4748 |
| 200 |
191.2 |
0.04 |
17 |
0.982 |
0.003 |
196.1 |
0.9999 |
9.4 |
98.8 |
0.5091 |
![[thin space (1/6-em)]](https://www.rsc.org/images/entities/char_2009.gif) |
| RhB |
| 100 |
96 |
0.05 |
4.5 |
0.945 |
0.003 |
102.1 |
0.999 |
6.5 |
38.7 |
0.6653 |
| 125 |
111 |
0.04 |
10 |
0.989 |
0.001 |
123.5 |
0.9957 |
8.4 |
36.6 |
0.792 |
| 150 |
124 |
0.03 |
15 |
0.989 |
0.001 |
135.1 |
0.9957 |
9.3 |
44.9 |
0.7529 |
The adsorption kinetics was thus obtained by fitting the experimental data with the pseudo-second-order kinetics equation:47
| |
 | (4) |
The parameters of this equation are presented in Table 3. The values of qe cal and K2 were calculated from the slope and intercept of the linear isotherm of t/qt vs. t in Fig. 13 and 14. The results are summarized in Table 3. For the adsorption of MB and RhB by POM@Fe3O4/MOF, linear relationships with a high correlation coefficient (R2 = 0.9999–1) for MB and (R2 = 0.9957–0.9999) for RhB between t/qt and t were obtained, indicating that the adsorption process could be fitted by the pseudo-second-order model. Moreover, in the different concentrations for the pseudo-second-order model, the calculated qe, cal for MB and RhB values agreed fine with the experimental qe, exp for MB and RhB values.
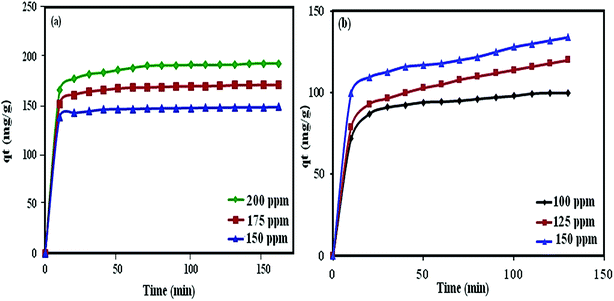 |
| | Fig. 13 Effect of contact time and initial dye concentration on the adsorption process onto the P2W18O62@Fe3O4/MIL-101 (Cr) adsorbent. | |
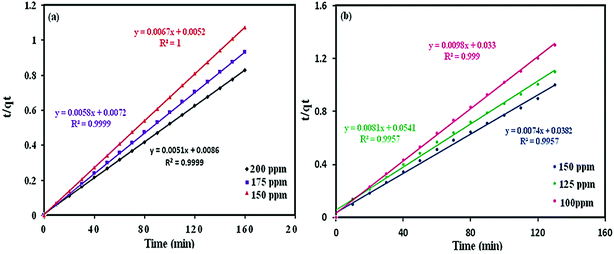 |
| | Fig. 14 Pseudo-second order kinetics for dyes adsorption: (a) MB, (b) RhB. | |
To investigate experimental data and study the possibility of intraparticle diffusion resistance that could affect the adsorption process, eqn (5), was used:63
| |
 | (5) |
where
qt,
kp and
I are the values of dye adsorbed (mg g
−1) at time
t (min), the intraparticle diffusion rate constant (mg g
−1 min
−1/2), and the intercept, respectively. The thickness of the boundary layer is indicated by the constant
I. The results demonstrated that the surface adsorption by the diffusion of the particles may be done and the sorption process following an intraparticle diffusion model.
3.8.4. Adsorption isotherm. Adsorption isotherms can be used to portray the adsorption efficiency of the adsorbed dye molecules in interacting with an adsorbent. Therefore, it is important to investigate the most appropriate relationship between the dye adsorption on the adsorbent and its concentration remaining in solution (liquid phase). In adsorption studies, several isotherm models to explain the experimental data have been investigated, including the Freundlich, Temkin, and Langmuir adsorption isotherms.64 The Langmuir isotherm model is most used and demonstrates that the adsorption occurs at specific homogeneous sites within the adsorbent. This equation can be expressed as follows:65| |
 | (6) |
The adsorption parameters and linear correlation coefficients R2 for MB and RhB are listed in Table 4. Where Ce, KL, and Qm are the equilibrium concentration of dye solution (mg L−1), the Langmuir constant (mg L−1), and the maximum adsorption capacity (mg g−1), respectively. The maximum adsorption capacities of MB and RhB toward P2W18O62@Fe3O4/MIL-101 (Cr) were 200 mg g−1 and 164 mg g−1, respectively, indicating that the magnetic nanohybrid exhibited quite high adsorption capacities for MB and RhB. The adsorption capacity for MB was larger than for RhB. This point may be explained by the fact that the molecular size of RhB was larger than that of MB. The Freundlich equation is expressed as:22
where
Qe and
Ce are defined the same as those in the Langmuir model, and
KF and 1/
n represent the Freundlich constants corresponding to the adsorption capacity and the adsorption intensity, where the value of
KF and 1/
n can be determined from the intercept and slope of the linear plot of ln
![[thin space (1/6-em)]](https://www.rsc.org/images/entities/char_2009.gif) qe versus
qe versus ln
![[thin space (1/6-em)]](https://www.rsc.org/images/entities/char_2009.gif) Ce
Ce. The equilibrium data and adsorption isotherms of MB and RhB on P
2W
18O
62@Fe
3O
4/MIL-101 and the calculated parameters of the three models are listed in
Table 3. As shown in Fig. S1
† the linearity of the Langmuir plot (
R2 = 0.991 for MB and 0.986 for RhB) was significantly better than that of the Freundlich plot (
R2 = 0.9263 for MB and 0.8685 for RhB).
Table 4 Isotherm constants for MB and RhB adsorption at different concentrations
| Dye |
Langmuir isotherm model |
Freundlich isotherm model |
Temkin isotherm model |
| R2 |
KL (L mg−1) |
Qm (mg g−1) |
R2 |
KF (mg g−1) |
n (mg L−1) |
R2 |
KT |
B1 |
| MB |
0.991 |
0.4 |
200 |
0.9263 |
54 |
2.36 |
0.980 |
2.3 |
50.62 |
| RhB |
0.986 |
0.3 |
164 |
0.8685 |
44.8 |
2.6 |
0.903 |
4.5 |
30.22 |
Therefore, the Langmuir isotherm model was better able to describe the adsorption behavior of P2W18O62@Fe3O4/MIL-101 (Cr) toward MB and RhB, and the adsorption of MB and RhB on P2W18O62@Fe3O4/MIL-101 (Cr) was a monolayer adsorption reaction.66–68 The Temkin equation is expressed as:
| |
 | (8) |
This isotherm, by ignoring the extremely low and large value of concentrations, assumes that: (a) the adsorption is characterized by a uniform distribution of binding energies, up to some maximum binding energy, and also (b) the heat of adsorption of all molecules in the layer would decrease linearly rather than logarithmically with coverage due to adsorbent–adsorbate interactions.69 By drawing the quantity qe versus ln![[thin space (1/6-em)]](https://www.rsc.org/images/entities/char_2009.gif) Ce, the constants B1 and KT were determined from the slope and the intercept, respectively, where KT is the equilibrium binding constant (L mol−1) corresponding to the maximum binding energy and the constant B1 is related to the heat of adsorption. The results indicated that the isotherm data of MB and RhB followed the Langmuir isotherm (Fig. S1†).
Ce, the constants B1 and KT were determined from the slope and the intercept, respectively, where KT is the equilibrium binding constant (L mol−1) corresponding to the maximum binding energy and the constant B1 is related to the heat of adsorption. The results indicated that the isotherm data of MB and RhB followed the Langmuir isotherm (Fig. S1†).
3.8.5. Thermodynamics. Gibbs energy changes (ΔG°, kJ mol−1), entropy (ΔS°, kJ mol−1 K−1), and enthalpy (ΔH°, kJ mol−1) are thermodynamic parameters. These parameters are relevant to the adsorption and these are designated from the adsorption isotherms at different temperatures.70 These parameters were determined using the following equations:71| |
 | (9) |
| |
ΔG° = −RT![[thin space (1/6-em)]](https://www.rsc.org/images/entities/char_2009.gif) ln ln![[thin space (1/6-em)]](https://www.rsc.org/images/entities/char_2009.gif) Kc Kc
| (10) |
where R (8.314 J mol−1 K) is the gas constant, T (K) is the absolute temperature, and K is the thermodynamic equilibrium constant for the adsorption process, which can be accounted from the ratio of the equilibrium adsorption capacity (Qe) to the equilibrium concentration of the solution (Ce). By drawing a plot of ln![[thin space (1/6-em)]](https://www.rsc.org/images/entities/char_2009.gif) Kc versus 1/T, the values ΔS° and ΔH° can be obtained from the slopes and intercepts, respectively (Table 5).
Kc versus 1/T, the values ΔS° and ΔH° can be obtained from the slopes and intercepts, respectively (Table 5).
Table 5 Results of the thermodynamic studies for MB and RhB adsorption on P2W18O62@Fe3O4/MIL-101
| Temperature °C |
Thermodynamic parameters |
| ΔG° (kJ mol−1) |
ΔH° (kJ mol−1) |
ΔS° (J mol−1 K−1) |
| For MB dye |
| 25 |
−1.08 |
50.52 |
173.2 |
| 35 |
−2.76 |
|
|
| 45 |
−4.49 |
|
|
| 55 |
−6.22 |
|
|
| 65 |
−7.95 |
|
|
| 75 |
−9.68 |
|
|
![[thin space (1/6-em)]](https://www.rsc.org/images/entities/char_2009.gif) |
| For RhB dye |
| 25 |
−11.72 |
42.82 |
183.93 |
| 35 |
−13.54 |
|
|
| 45 |
−15.37 |
|
|
| 55 |
−17.20 |
|
|
| 65 |
−19.03 |
|
|
| 75 |
−20.86 |
|
|
The results indicated that the adsorption processes of the MB and RhB dyes were endothermic processes. The values of ΔS° suggest increased defects at the solid/solution interface are created in the internal structure in the adsorption of MB and RhB dye on the P2W18O62@Fe3O4/MIL-101 (Cr). The values of ΔH° demonstrate an energy barrier in the endothermic process and adsorption process. In Table 5, the values of ΔG° range from −20 to 0 kJ mol−1, showing that the dominating mechanism is physisorption. Also, the negative ΔG° demonstrated that the adsorption of MB and RhB on the magnetic nanohybrid (P2W18O62@Fe3O4/MIL-101 (Cr)) was spontaneous at different temperatures.62
3.8.6. Stability and recyclability of the magnetic nanohybrid. One of the most important practical applications for the removal of dye pollutants is the reusability of the magnetic nanohybrid. For practical application of the adsorbent in industry, this is very important. To survey the feasibility of reusing the magnetic adsorbent, cycle experiments were performed by using a mixture of NaCl (0.1 M), ethanol, and water as desorption solvents. As a result, 30 mg of adsorbent was poured into 30 mL of dye solutions (50 mg L−1) and was then stirred for 30 min, and then the adsorbent was completely separated by using a magnet of water. Then, the magnetic adsorbent with the desorption solvents (water, ethanol, and NaCl) was recovered and washed several times by distilled water and eventually dried and reused. As shown in Fig. 15(a), the adsorbent was still capable of removing up to 98% of MB and RhB in every three cycles. As shown in Fig. 15(b–d), the FT-IR spectrum, XRD pattern, and SEM of the recovered adsorbent after three runs were consistent with the nanohybrid. These observations confirmed that the structure of the P2W18O62@Fe3O4/MIL-101 (Cr) magnetic nanohybrid was stable under the reaction conditions and was not affected by the reactants.
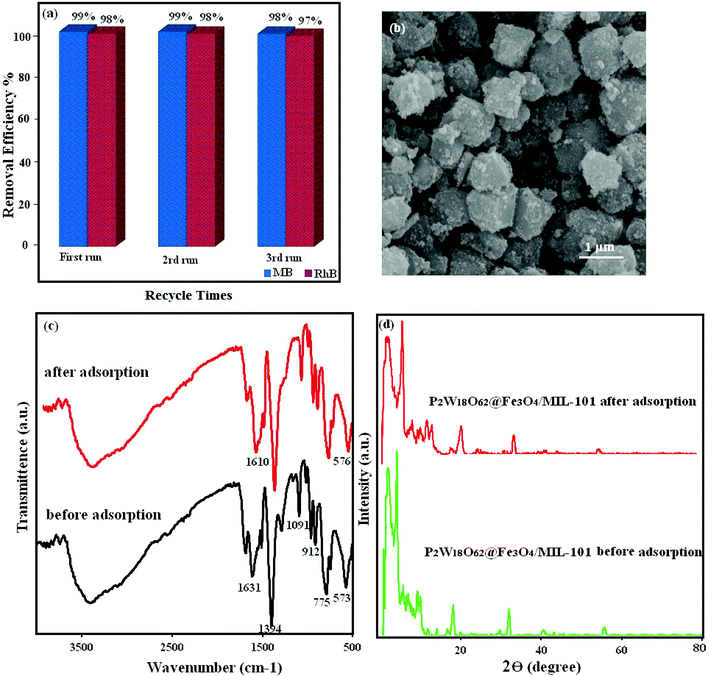 |
| | Fig. 15 (a) Recyclability of the P2W18O62@Fe3O4/MIL-101 (Cr) hybrid nanomaterial in the removal of MB dye, (b) SEM images, (c) FT-IR spectrum, and (d) XRD pattern of the fresh and recovered nanohybrid after three runs. | |
4 Conclusions
In the present work, kinetic, equilibrium and thermodynamic studies were carried out for the adsorption of MB and RhB dyes from aqueous solutions by using a novel ternary magnetic P2W18O62@Fe3O4/MIL-101 (Cr) nanohybrid. The results of the adsorption showed that P2W18O62@ Fe3O4/MIL-101 could be effectively used as a new adsorbent for the removal of cationic dyes. The nanohybrid demonstrated high adsorption capacities toward MB and RhB. The kinetics investigation of the dyes on the sorbent demonstrated that the adsorption kinetics of dyes on P2W18O62@Fe3O4/MIL-101 (Cr) followed the pseudo-second-order and Langmuir isotherm at different dye concentration values. The results from the thermodynamic studies showed that the dye adsorption on the magnetic nanohybrid was an endothermic, spontaneous, and physical reaction. The magnetic adsorbent revealed a high potential for the quick separation and removal of MB and RhB from aqueous solution, which could be attributed to its huge adsorption capacity and excellent reusability. Based on the data of the present study, the magnetic nanohybrid has potential as an eco-friendly adsorbent for dye elimination from colored wastewater.
Conflicts of interest
There are no conflicts of interest to declare.
Acknowledgements
The authors appreciatively acknowledge the Lorestan University and Iran Nanotechnology Initiative Council (INIC) for their financial support.
References
- T. Wang, P. Zhao, N. Lu, H. Chen, C. Zhang and X. Hou, Chem. Eng. J., 2016, 295, 403–413 CrossRef CAS.
- G. Férey, C. Mellot-Draznieks, C. Serre, F. Millange, J. Dutour, S. Surblé and I. Margiolaki, Science, 2005, 309, 2040–2042 CrossRef PubMed.
- L. Sun, S. Hu, H. Sun, H. Guo, H. Zhu, M. Liu and H. Sun, RSC Adv., 2015, 5, 11837–11844 RSC.
- J. D. Joshi, N. B. Patel and S. D. Patel, Iran. Polym. J., 2006, 15, 219 CAS.
- G. Crini, Bioresour. Technol., 2006, 97, 1061–1085 CrossRef CAS PubMed.
- N. M. Mahmoodi and M. Arami, Chem. Eng. J., 2009, 146, 189–193 CrossRef CAS.
- N. M. Mahmoodi, B. Hayati, M. Arami and C. Lan, Desalination, 2011, 268, 117–125 CrossRef CAS.
- T. Bechtold, E. Burtscher and A. Turcanu, J. Chem. Technol. Biotechnol., 2001, 76, 303–311 CrossRef CAS.
- L. Bromberg, Y. Diao, H. Wu, S. A. Speakman and T. A. Hatton, Chem. Mater., 2012, 24, 1664–1675 CrossRef CAS.
- M. Cai, J. Su, Y. Zhu, X. Wei, M. Jin, H. Zhang, C. Dong and Z. Wei, Ultrason. Sonochem., 2016, 28, 302–310 CrossRef CAS PubMed.
- L. V. Gonzalez-Gutierrez and E. M. Escamilla-Silva, Eng. Life Sci., 2009, 9, 311–316 CrossRef CAS.
- J. Wang, G. Zhao, Y. Li, H. Zhu, X. Peng and X. Gao, Dalton Trans., 2014, 43, 11637–11645 RSC.
- A. Pourjavadi, S. H. Hosseini, F. Seidi and R. Soleyman, Polym. Int., 2013, 62, 1038–1044 CrossRef CAS.
- M. Rafatullah, O. Sulaiman, R. Hashim and A. Ahmad, J. Hazard. Mater., 2010, 177, 70–80 CrossRef CAS PubMed.
- X.-J. Dui, W.-B. Yang, X.-Y. Wu, X. Kuang, J.-Z. Liao, R. Yu and C.-Z. Lu, Dalton Trans., 2015, 44, 9496–9505 RSC.
- K. Gong, W. Wang, J. Yan and Z. Han, J. Mater. Chem. A, 2015, 3, 6019–6027 RSC.
- H. Zhang, J. Yang, Y.-Y. Liu, S.-Y. Song, X.-L. Liu and J.-F. Ma, Dyes Pigm., 2016, 133, 189–200 CrossRef CAS.
- J. C. Ye, J. J. Chen, R. M. Yuan, D. R. Deng, M. S. Zheng, L. Cronin and Q. F. Dong, J. Am. Chem. Soc., 2018, 140, 3134–3138 CrossRef CAS PubMed.
- F.-Y. Yi, W. Zhu, S. Dang, J.-P. Li, D. Wu, Y.-h. Li and Z.-M. Sun, Chem. Commun., 2015, 51, 3336–3339 RSC.
- S. Farhadi, M. Hakimi and M. Maleki, Acta Chim. Slov., 2017, 64, 1005–1019 CrossRef CAS PubMed.
- X. Zhang, T. Lu, X. Xu and Y. Wang, J. Coord. Chem., 2017, 70, 60–70 CrossRef CAS.
- Z.-L. Cheng, Y.-X. Li and Z. Liu, J. Alloys Compd., 2017, 708, 255–263 CrossRef CAS.
- J. Li, J. Wang, Y. Ling, Z. Chen, M. Gao, X. Zhang and Y. Zhou, Chem. Commun., 2017, 53, 4018–4021 RSC.
- T. Wang, J. Wang, C. Zhang, Z. Yang, X. Dai, M. Cheng and X. Hou, Analyst, 2015, 140, 5308–5316 RSC.
- M. R. Karekal, V. Biradar and M. Bennikallu Hire Mathada, Bioinorg. Chem. Appl., 2013, 2013, 315972 Search PubMed.
- X. Liu, J. Luo, Y. Zhu, Y. Yang and S. Yang, J. Alloys Compd., 2015, 648, 986–993 CrossRef CAS.
- S. Wang, L. Bromberg, H. Schreuder-Gibson and T. A. Hatton, ACS Appl. Mater. Interfaces, 2013, 5, 1269–1278 CrossRef CAS PubMed.
- Y. Li, Q. Xie, Q. Hu, C. Li, Z. Huang, X. Yang and H. Guo, Sci. Rep., 2016, 6, 30651 CrossRef CAS PubMed.
- H. Liu, X. Ren and L. Chen, J. Ind. Eng. Chem., 2016, 34, 278–285 CrossRef CAS.
- M. Saikia, D. Bhuyan and L. Saikia, New J. Chem., 2015, 39, 64–67 RSC.
- X. Zhao, S. Liu, Z. Tang, H. Niu, Y. Cai, W. Meng, F. Wu and J. P. Giesy, Sci. Rep., 2015, 5, 11849 CrossRef PubMed.
- I.-M. Mbomekalle, Y. W. Lu, B. Keita and L. Nadjo, Inorg. Chem. Commun., 2004, 7, 86–90 CrossRef CAS.
- H. Sun, L. Cao and L. Lu, Nano Res., 2011, 4, 550–562 CrossRef CAS.
- T. Wang, P. Zhao, N. Lu, H. Chen, C. Zhang and X. Hou, Chem. Eng. J., 2016, 295, 403–413 CrossRef CAS.
- C. Roch-Marchal, T. Hidalgo, H. Banh, R. A. Fischer and P. Horcajada, Eur. J. Inorg. Chem., 2016, 27, 4387–4394 CrossRef.
- P. K. Prabhakaran and J. Deschamps, J. Mater. Chem. A, 2015, 3, 7014–7021 RSC.
- L. Zhang, B. Shan, H. Yang, D. Wu, R. Zhu, J. Nie and R. Cao, RSC Adv., 2015, 5, 23556–23562 RSC.
- A. Bielański and A. Lubańska, J. Mol. Catal. A: Chem., 2004, 224, 179–187 CrossRef.
- X.-J. Dui, W.-B. Yang, X.-Y. Wu, X. Kuang, J.-Z. Liao, R. Yu and C.-Z. Lu, Dalton Trans., 2015, 44, 9496–9505 RSC.
- K. Gong, W. Wang, J. Yan and Z. Han, J. Mater. Chem. A, 2015, 3, 6019–6027 RSC.
- S. Ribeiro, C. M. Granadeiro, P. Silva, F. A. A. Paz, F. F. de Biani, L. Cunha-Silva and S. S. Balula, Catal. Sci. Technol., 2013, 3, 2404–2414 RSC.
- A. X. Yan, S. Yao, Y. G. Li, Z. M. Zhang, Y. Lu, W. L. Chen and E. B. Wang, Chem.–Eur. J., 2014, 20, 6927–6933 CrossRef CAS PubMed.
- C. M. Granadeiro, A. D. Barbosa, P. Silva, F. A. A. Paz, V. K. Saini, J. Pires, B. de Castro, S. S. Balula and L. Cunha-Silva, Appl. Catal., A, 2013, 453, 316–326 CrossRef CAS.
- C. M. Granadeiro, A. D. Barbosa, S. Ribeiro, I. C. Santos, B. de Castro, L. Cunha-Silva and S. S. Balula, Catal. Sci. Technol., 2014, 4, 1416–1425 RSC.
- O. N. Shebanova and P. Lazor, J. Raman Spectrosc., 2003, 34, 845–852 CrossRef CAS.
- A. Aijaz, T. Akita, N. Tsumori and Q. Xu, J. Am. Chem. Soc., 2013, 135, 16356–16359 CrossRef CAS PubMed.
- Z. Jiang and Y. Li, J. Taiwan Inst. Chem. Eng., 2016, 59, 373–379 CrossRef CAS.
- V. V. Kumar, S. Sivanesan and H. Cabana, Sci. Total Environ., 2014, 487, 830–839 CrossRef CAS PubMed.
- A. Mohammadi, H. Daemi and M. Barikani, Int. J. Biol. Macromol., 2014, 69, 447–455 CrossRef CAS PubMed.
- H. Asfour, M. Nassar, O. Fadali and M. El-Geundi, J. Chem. Technol. Biotechnol., 1985, 35, 28–35 CrossRef.
- S. Wang and Z. Zhu, J. Hazard. Mater., 2006, 136, 946–952 CrossRef CAS PubMed.
- J. Wang, T. Tsuzuki, B. Tang, X. Hou, L. Sun and X. Wang, ACS Appl. Mater. Interfaces, 2012, 4, 3084–3090 CrossRef CAS PubMed.
- Y. Yu, B. N. Murthy, J. G. Shapter, K. T. Constantopoulos, N. H. Voelcker and A. V. Ellis, J. Hazard. Mater., 2013, 260, 330–338 CrossRef CAS PubMed.
- M. Mohammadi, A. J. Hassani, A. R. Mohamed and G. D. Najafpour, J. Chem. Eng. Data, 2010, 55, 5777–5785 CrossRef CAS.
- Q.-Q. Jin, X.-H. Zhu, X.-Y. Xing and T.-Z. Ren, Adsorpt. Sci. Technol., 2012, 30, 437–447 CrossRef CAS.
- Y. Shao, L. Zhou, C. Bao, J. Ma, M. Liu and F. Wang, Chem. Eng. J., 2016, 283, 1127–1136 CrossRef CAS.
- E. Haque, J. W. Jun and S. H. Jhung, J. Hazard. Mater., 2011, 185, 507–511 CrossRef CAS PubMed.
- C. Li, Z. Xiong, J. Zhang and C. Wu, J. Chem. Eng. Data, 2015, 60, 3414–3422 CrossRef CAS.
- S. Lin, Z. Song, G. Che, A. Ren, P. Li, C. Liu and J. Zhang, Microporous Mesoporous Mater., 2014, 193, 27–34 CrossRef CAS.
- T. Shen, J. Luo, S. Zhang and X. Luo, J. Environ. Chem. Eng., 2015, 3, 1372–1383 CrossRef CAS.
- A. Özcan and A. S. Özcan, J. Hazard. Mater., 2005, 125, 252–259 CrossRef PubMed.
- N. M. Mahmoodi, B. Hayati and M. Arami, Ind. Crops Prod., 2012, 35, 295–301 CrossRef CAS.
- A. Maleki, B. Hayati, M. Naghizadeh and S. W. Joo, J. Ind. Eng. Chem., 2015, 28, 211–216 CrossRef CAS.
- D. P. Dutta and S. Nath, J. Mol. Liq., 2018, 269, 140–151 CrossRef CAS.
- S. Chatterjee, D. S. Lee, M. W. Lee and S. H. Woo, Bioresour. Technol., 2009, 100, 2803–2809 CrossRef CAS PubMed.
- C. Yang, S. Wu, J. Cheng and Y. Chen, J. Alloys Compd., 2016, 687, 804–812 CrossRef CAS.
- C. Yang, J. Cheng, Y. Chen and Y. Hu, J. Colloid Interface Sci., 2017, 504, 39–47 CrossRef CAS PubMed.
- L. L. Zhi and M. A. Zaini, Water Sci. Technol., 2017, 75, 864–880 CrossRef CAS PubMed.
- I. D. Mall, V. C. Srivastava, N. K. Agarwal and I. M. Mishra, Chemosphere, 2005, 61, 492–501 CrossRef CAS PubMed.
- Y. Kim, C. Kim, I. Choi, S. Rengaraj and J. Yi, Environ. Sci. Technol., 2004, 38, 924–931 CrossRef CAS PubMed.
- T. A. Khan, S. Dahiya and I. Ali, Appl. Clay Sci., 2012, 69, 58–66 CrossRef CAS.
Footnote |
| † Electronic supplementary information (ESI) available. See DOI: 10.1039/c8ra06287k |
|
| This journal is © The Royal Society of Chemistry 2018 |
Click here to see how this site uses Cookies. View our privacy policy here.  Open Access Article
 *
*
![[thin space (1/6-em)]](https://www.rsc.org/images/entities/char_2009.gif) 000 different types of organic dyes have been produced all over the world. It is estimated that about 10% to 15% of the dyes are discharged to the environment from washing operations and an incomplete exhaustion of coloring materials during the dyeing process, which consequently pose a significant threat to the environment and human health because of their toxicity, potential mutagenicity, and even carcinogenicity without reasonably processing.4,5 Moreover, the discharge of such dyes without treatment into rivers is usually easily noticed since dyes are highly visible and commonly harmful to aquatic life. As a result, the removal of dye pollutants is important for water safety and human health protection. The non-biodegradable nature of dyes and their stability toward light and oxidizing agents complicate the selection of a suitable method for their removal.6,7 Several methods, such as electrochemical,8,9 physical,10 biological,11 adsorption, membrane-based separation, and oxidative degradation,12 have been used for dye removal from dye wastewater. Among the existing elimination techniques, adsorption has been recognized as one of the most competitive technologies for the removal of dyes due to the suitable choice of adsorbent, excellent elimination performance, simplicity of design, lower energy consumption, and ability to treat dyes in a more concentrated form.13,14
000 different types of organic dyes have been produced all over the world. It is estimated that about 10% to 15% of the dyes are discharged to the environment from washing operations and an incomplete exhaustion of coloring materials during the dyeing process, which consequently pose a significant threat to the environment and human health because of their toxicity, potential mutagenicity, and even carcinogenicity without reasonably processing.4,5 Moreover, the discharge of such dyes without treatment into rivers is usually easily noticed since dyes are highly visible and commonly harmful to aquatic life. As a result, the removal of dye pollutants is important for water safety and human health protection. The non-biodegradable nature of dyes and their stability toward light and oxidizing agents complicate the selection of a suitable method for their removal.6,7 Several methods, such as electrochemical,8,9 physical,10 biological,11 adsorption, membrane-based separation, and oxidative degradation,12 have been used for dye removal from dye wastewater. Among the existing elimination techniques, adsorption has been recognized as one of the most competitive technologies for the removal of dyes due to the suitable choice of adsorbent, excellent elimination performance, simplicity of design, lower energy consumption, and ability to treat dyes in a more concentrated form.13,14


![[thin space (1/6-em)]](https://www.rsc.org/images/entities/char_2009.gif) :
:![[thin space (1/6-em)]](https://www.rsc.org/images/entities/char_2009.gif) 1, v/v) solvent containing 0.1 mol L−1 of NaCl at room temperature. Then, the regenerated adsorbent was dried at room temperature and reused for the next adsorption experiment.
1, v/v) solvent containing 0.1 mol L−1 of NaCl at room temperature. Then, the regenerated adsorbent was dried at room temperature and reused for the next adsorption experiment.
![[double bond, length as m-dash]](https://www.rsc.org/images/entities/char_e001.gif) C bonds and the band around 1631 cm−1 was related to the aromatic group.36 In Fig. 1(b), the characteristic bands of Dawson heteropolyanion are displayed at 1091 (the stretching frequency of P–O of the central PO4 tetrahedron), 960 (W
C bonds and the band around 1631 cm−1 was related to the aromatic group.36 In Fig. 1(b), the characteristic bands of Dawson heteropolyanion are displayed at 1091 (the stretching frequency of P–O of the central PO4 tetrahedron), 960 (W![[double bond, length as m-dash]](https://www.rsc.org/images/entities/char_e001.gif) O terminal bands), and 912 and 775 cm−1 (W–O–W “inter” and “intra” W–O–W bridges), respectively.37,38 As shown in Fig. 1(c), the band appearing at 570 cm−1 is attributed to the vibrational band of the Fe–O of Fe3O4. Also, in Fig. 1(f), after forming the P2W18@Fe3O4/MIL-101 (Cr) nanohybrid, the characteristic peaks related to MIL-101 (Cr) are almost the same. Additionally, four P2W18 peaks and Fe3O4 related bands are well retained in the P2W18@Fe3O4/MIL-101 (Cr) sample. However, these are slightly shifted peaks compared with the pure Dawson-type P2W18 and Fe3O4. These shifts imply that interactions exist between the Dawson-type anion and Fe3O4 with MIL-101 (Cr).
O terminal bands), and 912 and 775 cm−1 (W–O–W “inter” and “intra” W–O–W bridges), respectively.37,38 As shown in Fig. 1(c), the band appearing at 570 cm−1 is attributed to the vibrational band of the Fe–O of Fe3O4. Also, in Fig. 1(f), after forming the P2W18@Fe3O4/MIL-101 (Cr) nanohybrid, the characteristic peaks related to MIL-101 (Cr) are almost the same. Additionally, four P2W18 peaks and Fe3O4 related bands are well retained in the P2W18@Fe3O4/MIL-101 (Cr) sample. However, these are slightly shifted peaks compared with the pure Dawson-type P2W18 and Fe3O4. These shifts imply that interactions exist between the Dawson-type anion and Fe3O4 with MIL-101 (Cr).


![[double bond, length as m-dash]](https://www.rsc.org/images/entities/char_e001.gif) O stretch is shifted to lower frequency upon coupling with MIL-101 (Cr), which may be due to chemical interaction between P2W18O62 and MIL-101 (Cr).44 The FT-Raman spectrum of the magnetic nanohybrid in Fig. 3(d) shows three bands of Fe3O4 at 200, 680, and 757 cm−1 and two bands of the P2W18O62, besides the characteristic bands of MIL-101 (Cr). Then, Raman spectroscopy confirmed the coexistence of P2W18O62, Fe3O4, and MIL-101 (Cr) in the hybrid nanomaterial.45
O stretch is shifted to lower frequency upon coupling with MIL-101 (Cr), which may be due to chemical interaction between P2W18O62 and MIL-101 (Cr).44 The FT-Raman spectrum of the magnetic nanohybrid in Fig. 3(d) shows three bands of Fe3O4 at 200, 680, and 757 cm−1 and two bands of the P2W18O62, besides the characteristic bands of MIL-101 (Cr). Then, Raman spectroscopy confirmed the coexistence of P2W18O62, Fe3O4, and MIL-101 (Cr) in the hybrid nanomaterial.45


![[thin space (1/6-em)]](https://www.rsc.org/images/entities/char_2009.gif)


![[thin space (1/6-em)]](https://www.rsc.org/images/entities/char_2009.gif) qe versus ln
qe versus ln![[thin space (1/6-em)]](https://www.rsc.org/images/entities/char_2009.gif) Ce. The equilibrium data and adsorption isotherms of MB and RhB on P2W18O62@Fe3O4/MIL-101 and the calculated parameters of the three models are listed in Table 3. As shown in Fig. S1† the linearity of the Langmuir plot (R2 = 0.991 for MB and 0.986 for RhB) was significantly better than that of the Freundlich plot (R2 = 0.9263 for MB and 0.8685 for RhB).
Ce. The equilibrium data and adsorption isotherms of MB and RhB on P2W18O62@Fe3O4/MIL-101 and the calculated parameters of the three models are listed in Table 3. As shown in Fig. S1† the linearity of the Langmuir plot (R2 = 0.991 for MB and 0.986 for RhB) was significantly better than that of the Freundlich plot (R2 = 0.9263 for MB and 0.8685 for RhB).

![[thin space (1/6-em)]](https://www.rsc.org/images/entities/char_2009.gif) Ce, the constants B1 and KT were determined from the slope and the intercept, respectively, where KT is the equilibrium binding constant (L mol−1) corresponding to the maximum binding energy and the constant B1 is related to the heat of adsorption. The results indicated that the isotherm data of MB and RhB followed the Langmuir isotherm (Fig. S1†).
Ce, the constants B1 and KT were determined from the slope and the intercept, respectively, where KT is the equilibrium binding constant (L mol−1) corresponding to the maximum binding energy and the constant B1 is related to the heat of adsorption. The results indicated that the isotherm data of MB and RhB followed the Langmuir isotherm (Fig. S1†).
![[thin space (1/6-em)]](https://www.rsc.org/images/entities/char_2009.gif) ln
ln![[thin space (1/6-em)]](https://www.rsc.org/images/entities/char_2009.gif) Kc
Kc
![[thin space (1/6-em)]](https://www.rsc.org/images/entities/char_2009.gif) Kc versus 1/T, the values ΔS° and ΔH° can be obtained from the slopes and intercepts, respectively (Table 5).
Kc versus 1/T, the values ΔS° and ΔH° can be obtained from the slopes and intercepts, respectively (Table 5).
![[thin space (1/6-em)]](https://www.rsc.org/images/entities/char_2009.gif)


