DOI:
10.1039/C8RA06992A
(Paper)
RSC Adv., 2018,
8, 37401-37409
A study on the preparation and application of a core–shell surface imprinted uranyl magnetic chelating adsorbent
Received
21st August 2018
, Accepted 9th October 2018
First published on 16th November 2018
Abstract
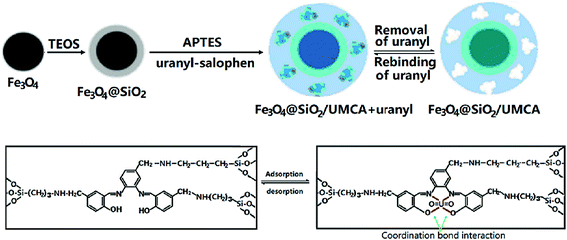
A core–shell surface imprinted uranyl magnetic chelating adsorbent (UMCA) was synthesized by combining the sol–gel process with the surface molecular imprinting technique (SMIT). A specific salophen and uranyl–salophen were designed and synthesized. Then, the synthesized uranyl–salophen complex was used as a template (in which uranyl is the target analyte), 3-aminopropyltriethoxysilane as a functional monomer and tetraethylorthosilicate as a cross-linker. The obtained UMCA was characterized by a variety of modern analytical and detection techniques. The adsorbent can be used for the solid-phase extraction of uranyl with good selectivity, high adsorption capacity, magnetic separation characteristics and good reusability. The chelating sorbent was successfully applied for the separation of uranyl, followed by multiphase photocatalytic resonance fluorescence method determination in several environmental water samples with a relative standard deviation of <5.48% and spiked recoveries of 92.5% to 103.0%. The adsorption mechanism was preliminarily discussed.
1 Introduction
Uranium is a ubiquitous trace radioactive element that has received much attention, owing to its high toxicity and radioactivity.1 The presence of uranium in the environment implies the possibility of human uptake, which can cause serious damage to human health.2–4 Recently, low concentrations of uranium have been widely detected in most environmental water, tap water, and groundwater.5 Therefore, it is very important to detect uranium levels in water.
Several analytical techniques have been developed for the determination of uranium, including ICP-MS,6,7 ion exchange method,8,9 X-ray spectrometry,10 quantum dot nanosensors,11 electrochemistry and sensor method,12,13 and high-selectivity and high-sensitivity spectroscopy.14–16 However, these methods are usually not suitable for routine analysis because of expensive equipment and high running cost. Due to the interference from the complex matrices of real samples, it is difficult to detect uranium directly by these analytical methods, so pre-concentration steps prior to its determination are necessary.17,18 Techniques such as liquid–liquid extraction and solid-phase extraction (SPE) have been applied for this task,19,20 of which SPE has become the most popular in recent years. Since SPE usually lacks molecular selectivity, the development of highly-selective adsorbents for SPE procedures, including the use of molecularly imprinted polymers (MIPs) as synthetic antibody mimics,21 has attracted much attention.
The molecular imprinting technique is based on the copolymerization of functional monomers and cross-linking monomers in the presence of a template. The key to the preparation of the target ion chelating sorbent by SMIT is to synthesize the target ion complex as a template. After copolymerization, the functional groups and the ligands are “frozen” in the cross-linked polymeric network. Subsequent removal of the target ion leads to empty cavities in the polymer matrix, which are complementary in size, shape and functionality to the target ion. The chelating sorbent thus has an ion memory and is able to specifically recognize and rebind the target ion.22,23 However, the chelating adsorbents prepared by traditional methods have some disadvantages in practical application, such as uneven distribution of binding sites, poor site accessibility, weak binding force to target ions, and low mass transfer efficiency.21 Moreover, most chelating sorbent systems lack true water compatibility. The SMIT with a sol–gel process was considered as an ideal solution for these problems. The chelating sorbent prepared by this method has binding sites situated at the surface and has been confirmed to be much more specific towards the target analytes and is much faster for mass transfer.24 The SMIT is easy to operate and low in cost for analyzing uranium, but in some published papers25 uranium are directly polymerized with functional monomers to form adsorbents, which results in the further improvement of its adsorption efficiency. Therefore, it is of great significance for developing a new method to separate environmental uranium.
Magnetic nanoparticles have been extensively applied in many fields because they have many excellent characteristics: high surface-to-volume ratio, functional modification, magnetic susceptibility, good coercivity, and easy separability from sample solutions by an external magnetic field.26,27 However, magnetic nanoparticles are not only easy to oxidize in air or solution, but also easy to leach under acidic conditions and hydrolyze in solution. In addition, under acidic conditions, the functional groups of the coating layer physically immobilized onto the magnetic nanoparticles are very unstable. SiO2 is stable under acidic conditions and is inert to the redox reaction, so coating silica on the magnetic nanoparticles is a good solution for the above problems.28,29 As far as we know, there is no report on the solid phase extraction of uranium using a chelating sorbent prepared by SMIT.30,31
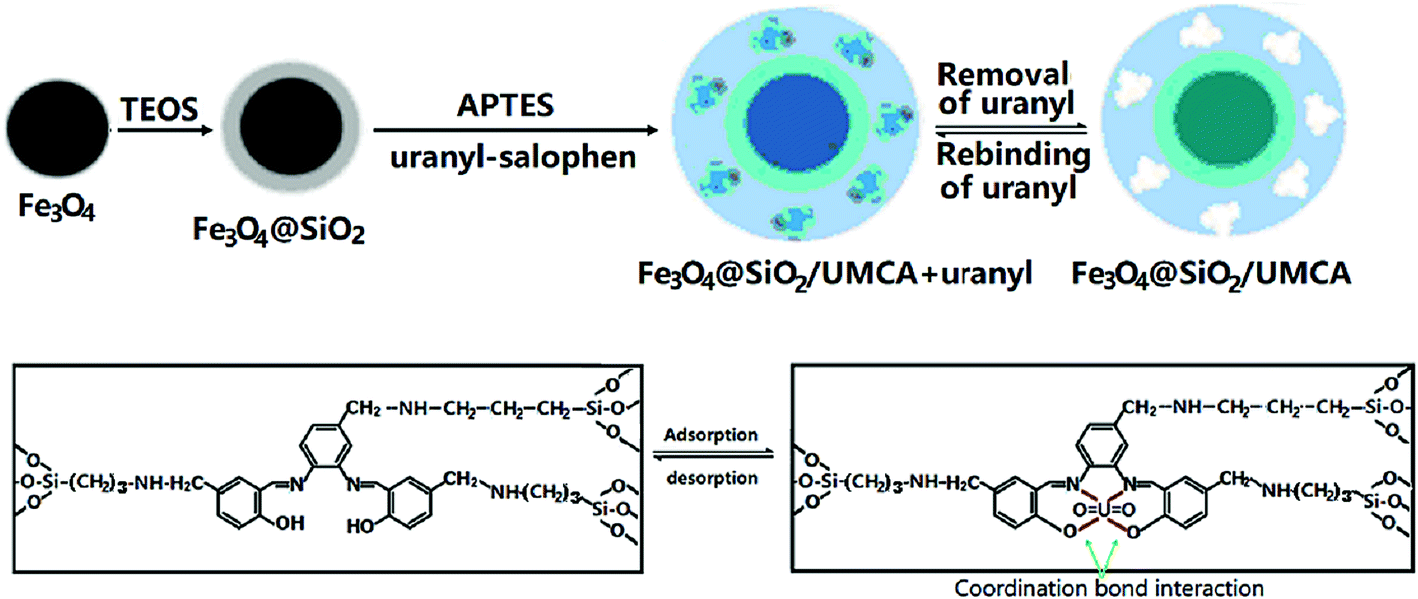
In this study, a new UMCA was prepared by sol–gel method combined with an improved SMIT. The composition and morphology of the prepared UMCA were characterized by scanning electron microscopy (SEM), powder X-ray diffraction (XRD) and Fourier transform infrared (FTIR) spectroscopy. Equilibrium adsorption experiments and Scatchard analysis were used to evaluate the adsorption properties. This established method has been applied to the separation of trace uranium in water samples to prove its applicability.
2 Experimental
2.1 Materials and reagents
Uranium nitrate hexahydrate, 3-aminopropyltriethoxysilane (APTES), and tetraethyl orthosilicate (TEOS) were obtained from the Shanghai Mindray Company (Shanghai, China). Phenyl-triethoxysilane (PTEOS) was purchased from the Qingzhou Zhenhua Chemical Reagent Company (Qingzhou, China). All reagents used in this study were of analytical grade, and doubly distilled water was used throughout.
2.2 Preparation of UMCA
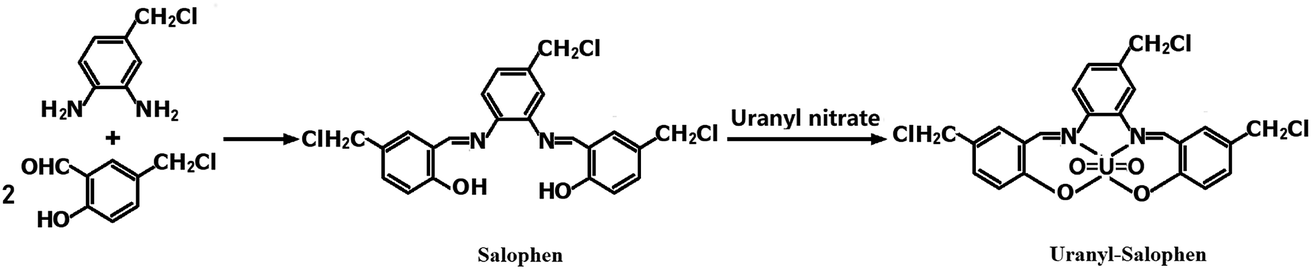
2.2.1 Synthesis of the uranyl–salophen complex32. 4-Chloromethyl-o-phenylenediamine (1.50 g) and 2-hydroxy-5-chloromethyl benzaldehyde (3.40 g) were dissolved in 80 mL of anhydrous ethanol in a 250 mL three-necked flask. The mixture was stirred for 2 h under reflux and then cooled to room temperature. The solid mass was filtered, and the product, salophen, was recrystallized from ethanol and vacuum-dried for 2 h. Next, this salophen was added into a beaker containing 50 mL ethanol, and 3.75 g hexahydrate uranyl nitrate was added to the mixture, which was then stirred for 45 min under reflux and cooled to room temperature. After filtering and washing with ethanol three times, the synthetic product, uranyl–salophen complex, was dried under vacuum at 60 °C for 12 h. The synthesis process and structure17,19,20,32 of the uranyl–salophen complex is illustrated in Scheme 1.
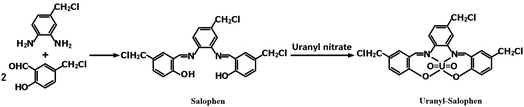 |
| | Scheme 1 Procedure of synthesizing salophen and [UO22+–salophen] synthetic process diagram. | |
2.2.2 Synthesis of Fe3O4 magnetic nanoparticles33. 17.0 g sodium nitrate, 1.4705 g trisodium citrate dehydrate and 0.8 g NaOH were subsequently dissolved in 95 mL of deionized water. When the above solution was heated to 100 °C, 5.0 mL of 2.0 mol L−1 ferrous sulfate solution was rapidly added into the mixture, and then the mixed solution was maintained at 100 °C for 1.5 h. The black precipitate of Fe3O4 magnetic nanoparticles was separated by a magnet, repeatedly washed with deionized water several times, and dried under vacuum at 50 °C for 8 h.
2.2.3 The preparation of Fe3O4@SiO2 core–shell nanoparticles, using the sol–gel process34. Commonly, 0.500 g synthetic Fe3O4 magnetic nanoparticles were dispersed in 100 mL ethanol–water (4.0![[thin space (1/6-em)]](https://www.rsc.org/images/entities/char_2009.gif) :1.0, v/v) by sonication for 40 min, subsequently, 5.0 mL of 25% (wt) ammonia solution and 4.0 mL TEOS were sequentially added. Under continuous stirring, the suspension obtained above was allowed to react at room temperature for 12 h. The particulate product was collected by a magnet, rinsed with deionized water three times, and dried under vacuum at 50 °C for 9 h.
:1.0, v/v) by sonication for 40 min, subsequently, 5.0 mL of 25% (wt) ammonia solution and 4.0 mL TEOS were sequentially added. Under continuous stirring, the suspension obtained above was allowed to react at room temperature for 12 h. The particulate product was collected by a magnet, rinsed with deionized water three times, and dried under vacuum at 50 °C for 9 h.
2.2.4 Synthesis of UMCA. 0.15 g of synthetic uranyl–salophen and 2.0 mL of APTES were dissolved in 50 mL ethanol. When the mixture solution was stirred for 30 min, 4.0 mL of TEOS was added. After stirring for 20 min, 0.40 g of synthetic Fe3O4@SiO2 core–shell nanoparticles and 1.0 mL of 0.010 mol L−1 HCl were added. Then, the mixture was continuously stirred for 15 h at room temperature. Finally, the chelating absorbent product was collected by a magnet, rinsed with anhydrous ethanol, and dried under vacuum at 60 °C for 15 h. The preparation process of the UMCA is illustrated in Scheme 2.
 |
| | Scheme 2 Schematic illustration for the preparation of core–shell UMCA via sol–gel process. | |
As a reference, the non-uranyl-magnetic chelating sorbent (NMCA) was prepared using the same procedure but in the absence of the template uranyl–salophen.
2.2.5 Elution of uranyl ion. 0.80 g of the UMCA was washed three times with 10 mL of 0.5 mol L−1 HCl with stirring for 45 min each. The uranium reagent III spectrophotometric method was used to determine the complete removal of uranyl from UMCA. The obtained UMCA was washed with anhydrous ethanol to remove any remaining hydrochloric acid and then dried at 60 °C in a vacuum desiccator for 6 hours. The NMCA was processed using the same process.
2.3 Instrumentation
FTIR spectra of Fe3O4, Fe3O4@SiO2 and UMCA were obtained on an IR Prestige-21 spectrometer (SHIMADZU, Japan). An X-ray diffractometer (D8 ADVANCE, Bruker, Germany) operating with a Cu anode at 40 kV and 40 mA in the range between 10 °C and 80 °C with a speed of 3° min−1 was used to characterize the structures of the powder samples. A Sirion-200 scanning electron microscope (FEI, United States) was used to investigate the morphologies of Fe3O4, Fe3O4@SiO2 and UMCA. A Shimadzu UV-2450 Spectrophotometer (Kyoto, Japan) was used to measure the absorption spectra. The fluorescence spectra and the intensities of fluorescence were measured with a Hitachi RF-4500 Spectrofluorometer (SHIMADZU, Japan) equipped with a 1 cm quartz cell. A PB-21 standard pH meter (Beijing) was used for pH adjustment.
2.4 Static adsorption properties of UMCA
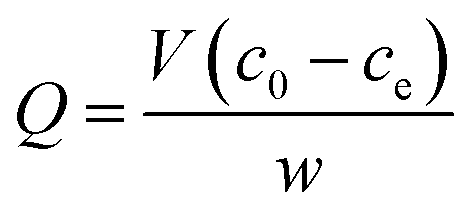
For the investigation of the absorption capacity of the prepared UMCA, 10 mg of UMCA particles were added to 5.0 mL of the standard solution with a varied initial concentration (10–150 μmol L−1) of uranyl. The above mixture was shaken at room temperature for 2 hours, followed by magnetic separation of adsorbents. Arsenazo III spectrophotometry was used to determine the uranyl residue in the supernatant. The equilibrium adsorption capacity (Q μmol g−1) for uranyl was calculated by the following eqn (1)| |
 | (1) |
where c0 and ce (μmol L−1) are the initial and the final concentration of uranyl in the tested solution, respectively; V (L) is the volume of the solution; and w (g) is the mass of the UMCA. Similarly, the binding capacity of NMCA for uranyl was investigated using the same procedure as that for UMCA.
By further processing these saturated binding data, the Scatchard equation could be obtained to estimate the binding properties of UMCA. The Scatchard equation35 is expressed as:
where
Qmax (μmol g
−1) is the apparent maximum adsorption capacity,
Q (μmol g
−1) is the adsorption capacity toward uranyl at equilibrium calculated by
eqn (1), and
KD is the dissociation constant. By drawing the linear relationship between
Q/
Ce and
Q, the values of
KD and
Qmax can be calculated from the slope and intercept of the Scatchard plot.
In the study on competitive recognition, the adsorption capacity is also used to calculate the distribution coefficient (Kd), the selectivity coefficient (k), and the relative selectivity coefficient (k0). The formulas are as follows:
| | |
Kd = [(c0 − ce)/ce] × (V/w)
| (3) |
where
Kd(
i) and
Kd(
j) are the distribution coefficients of the analyte and reference material, respectively.
2.5 Kinetic adsorption properties of UMCA
To investigate the adsorption kinetics of the chelating adsorbent, 50 mg of UMCA or NMCA particles were mixed with 10 mL of the solution containing 50 μmol L−1 of uranyl. After mixing for a period of time, the mixture was separated by a magnet. The concentration of uranyl in the supernatant was determined by Arsenazo III spectrophotometry.
2.6 Adsorption selectivity experiments of UMCA
In order to study adsorption selectivity and the rebinding selectivity of UMCA, a similar element thorium (Th4+) was selected to study the competitive recognition ability. UMCA or NMCA (50 mg) was added to a 10 mL solution containing 60 μmol L−1 of uranyl or Th4+. The mixture was shaken at room temperature for 90 min, and the solid chelating adsorbent was separated by a magnet. The uranyl or Th4+ residue was detected by UV/Vis spectrophotometry at wavelengths of 665 nm for U and 625 nm for Th.
2.7 Study on the application of adsorbent
Firstly, in 2 test tubes, 10.0 mg UMCA nanoparticles were added to each tube, and 5 mL of uranium standard solution or a certain volume of water sample were respectively added to each test tube. An equivalent amount of distilled water was added to another test tube as a reagent blank. The mixture was continuously stirred to adsorb the uranyl. After 90 min, the upper solution was discarded and the UMCA was retained.
Secondly, several solutions were added to the above test tubes in the following order: 1.5 mL of 0.10 mol L−1 Tris–HCl buffer solution (pH 5.0), 1.2 mL of 0.010 mol L−1 KBrO3 solution, 0.5 mL of 1.0 × 10⁻⁴ mol L−1 RhG solution. The mixture was diluted to 5.0 mL with redistilled water and shaken well. The mixture was allowed to react at room temperature with continuous stirring and strong visible-light irradiation for 10 min.
Subsequently, the resonance fluorescence spectroscopy was obtained by synchronously scanning with Δλ = 0 from 450 to 650 nm in a 1 cm quartz cell, and the fluorescence intensity was measured at 544 nm. The decreased fluorescence intensity was represented as ΔF = F0 − F, where F and F0 are the fluorescence intensities of the reaction system with and without uranyl, respectively.
3 Results and discussion
3.1 Selection of the functional monomers
In this study, the synthesis of UMCA was based on SMIT. One of the important factors for successful molecular imprinting is the selection of suitable functional monomers. Because uranyl–salophen was used as a template, the selected functional monomer should be able to form a firm covalent bond with the synthesized salophen ligand. This ensured that salophen ligand was not eluted when the uranyl ion was removed after polymerization and could still maintain the chelating characteristics of the recognition site of the uranyl ion including shape, size and functionalities. When APTES was selected, it was capable of establishing N–C bonds with the chloromethyl (shown in Scheme 2) of the synthetic salophen ligand, which can form a chelating coordination bond with uranyl. While PTEOS was used, it could not combine with salophen ligand and could only interact with uranyl via π–π interaction between the π–π electron of the phenyl group and the p electron of uranyl. The static binding capacities of uranyl were investigated for nine possible compositions of UMCA (shown in Table 1). The data clearly suggested that the binding capacity (QUMCA) of UMCA5 was the highest among the nine UMCAs. When UMCA7 and UMCA8 were used, low specific binding capacities were observed, demonstrating that the chelate bonding interaction between the salophen ligand and uranyl might be much stronger than the π–p interaction between uranyl and PTEOS. Therefore, APTES was selected as the functional monomer in subsequent experiments.
Table 1 The effect of the ratio of template to functional monomers on the binding capacities of nine UMCAs (QUMCA)
| UMCA |
1 |
2 |
3 |
4 |
5 |
6 |
7 |
8 |
9 |
| Uranyl–salophen (mmol) |
1.0 |
0.80 |
0.60 |
0.40 |
0.20 |
0.10 |
0.20 |
0.20 |
0 |
| Uranyl (mmol) |
0 |
0 |
0 |
0 |
0 |
0 |
0 |
0 |
0.20 |
| APTES (mmol) |
8.5 |
8.5 |
8.5 |
8.5 |
8.5 |
8.5 |
4.25 |
0 |
8.5 |
| PTEOS (mmol) |
0 |
0 |
0 |
0 |
0 |
0 |
4.25 |
8.5 |
0 |
| QUMCA (μmol g−1) |
3.03 |
3.12 |
3.98 |
5.01 |
7.79 |
6.10 |
4.56 |
1.68 |
1.03 |
3.2 Characterization of the morphology and composition of UMCA
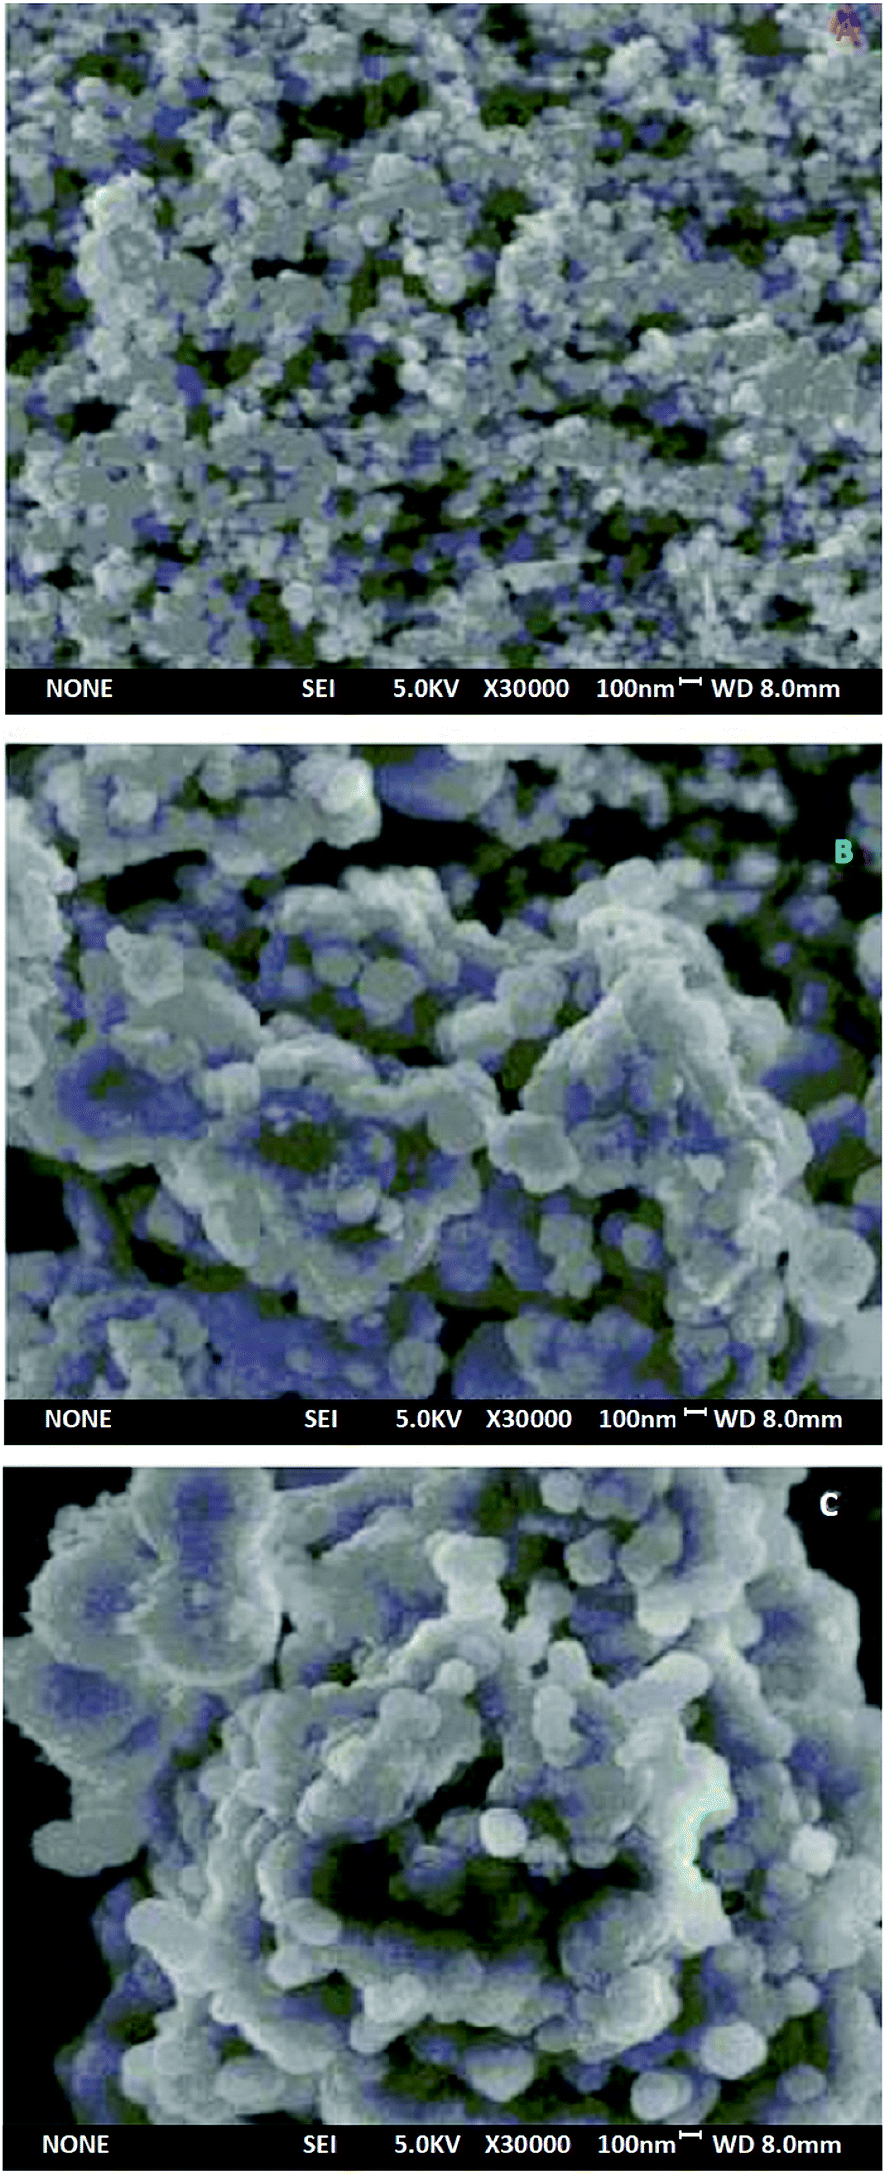
3.2.1 The analysis of SEM. The SEM images of Fe3O4, Fe3O4@SiO2 and UMCA are shown in Fig. 1. As shown in Fig. 1, three kinds of nanoparticles, Fe3O4, Fe3O4@SiO2 and UMCA, had good morphology, and their diameters were approximately 62 nm, 126 nm and 186 nm, respectively. Therefore, the thickness of the imprinting layer was estimated to be about 30 nm. The thickness of the imprinted layer is not only related to the adsorption capacity but also the adsorption rate.36 The SEM images show that these core–shell nanoparticles had very regular morphological characteristics. Because of the nanosized particles and thin imprinting layer, UMCA may have a larger specific area, thus increasing the adsorption capacity.
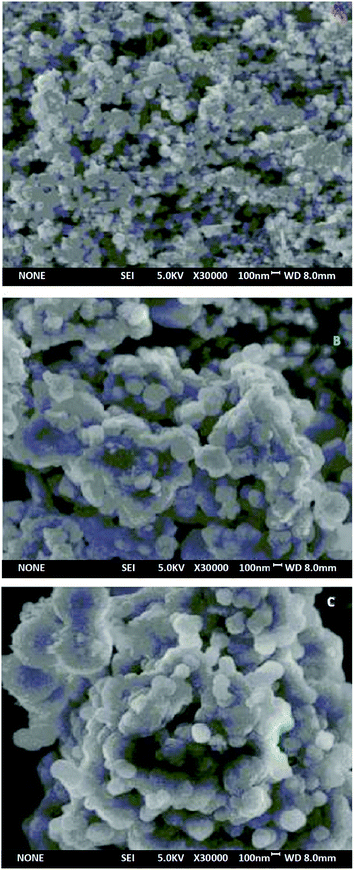 |
| | Fig. 1 SEM images of Fe3O4 (A), Fe3O4@SiO2 (B) and UMCA (C). | |
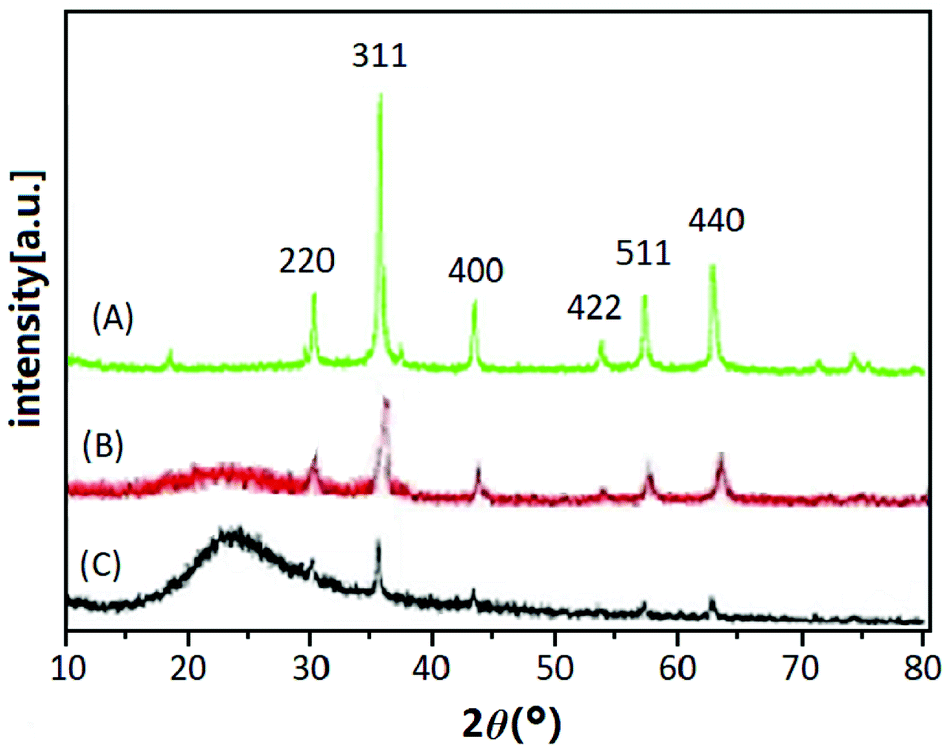
3.2.2 XRD analysis. The XRD patterns of Fe3O4 (A), Fe3O4@SiO2 (B) and UMCA (C) are shown in Fig. 2. Six diffraction peaks of Fe3O4 (2θ = 30.19°, 35.50°, 43.40°, 53.64°, 57.24°, and 62.86°) were observed in curve (A), and the peak positions could be indexed to (220), (311), (400), (422), (511), and (440), which match well with the database of magnetite in the JCPDS-International Center (JCPDS card: 19-0629). In Fig. 2B and C, the same characteristic peak series with curve (A) can be found, only the intensity of all these peaks had decreased. This indicated that the crystal structure of the magnetite remained unchanged, but the difference was that the SiO2 layer or molecular imprinted layer was coated on the surface of the Fe3O4 nanoparticles. The broad diffraction peak at 2θ = 22.86° in Fig. 2B and C reflected the amorphous SiO2 in Fe3O4@SiO2 and UMCA.37
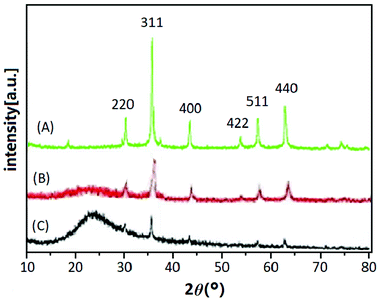 |
| | Fig. 2 XRD patterns of Fe3O4 (A), Fe3O4@SiO2 (B) and UMCA (C). | |
Three synthetic black particles, Fe3O4, Fe3O4@SiO2 and UMCA, were experimentally observed. After placement for an extended time, it was found that the Fe3O4 particles became reddish-brown and lost their magnetic properties, which indicated that FeO in the particles might have oxidized to Fe2O3, resulting in the structural changes of Fe3O4 and loss of magnetic properties. In contrast, Fe3O4@SiO2 and UMCA did not undergo this change, suggesting that the “SiO2” or “SiO2 + imprinted layer” of the outer shell can protect the inner Fe3O4 from oxidation. Based on the analysis of the above experimental data and phenomena, it could be speculated that the Fe3O4 nanoparticles were really embedded in the core of the UMCA nanoparticles.
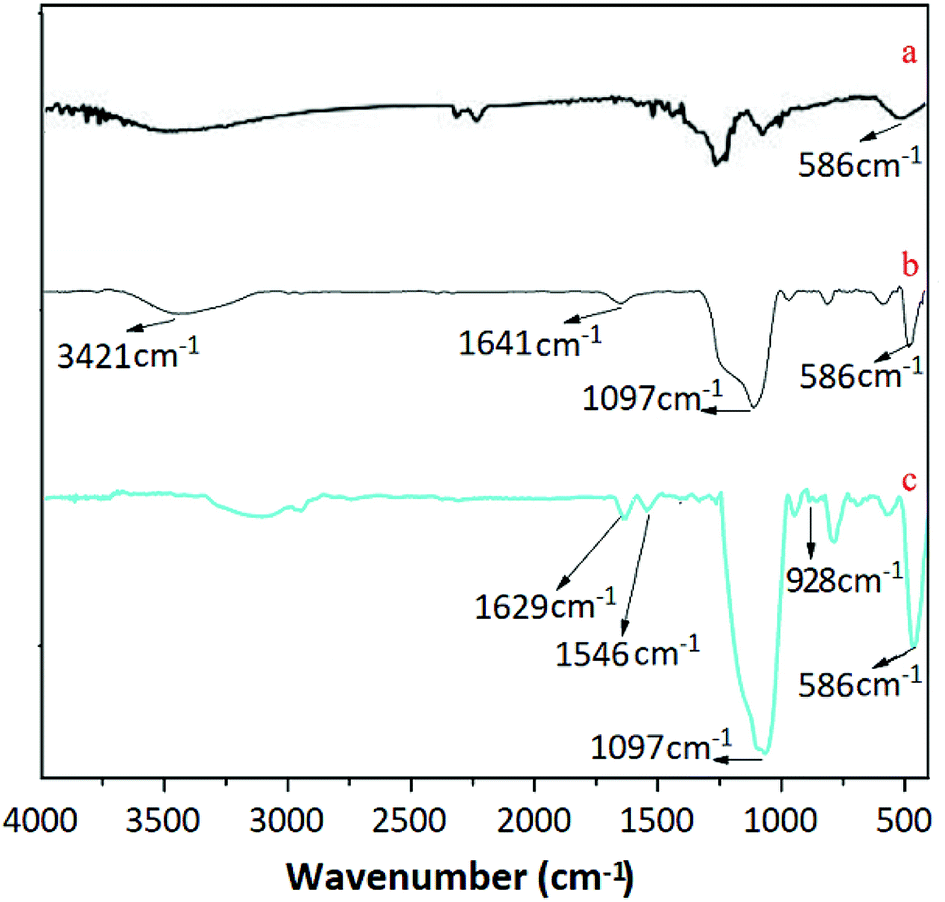
3.2.3 The analysis of FTIR spectra. Fig. 3 displays the FTIR spectra of Fe3O4, Fe3O4@SiO2 and UMCA. As shown in Fig. 3(a–c), three adsorption bands at 586 cm−1 were all attributed to the Fe–O vibration.38 The two characteristic bands observed in Fig. 3(b and c) at 1197 cm−1 were presumed to be caused by the stretching vibration of Si–O–H and Si–O–Si,39,40 which showed that silica had been successfully coated on the surface of the Fe3O4 nanoparticles. The presence of vibrational peaks at 3421 cm−1 and 1641 cm−1 at the same time (Fig. 3b) represents an amino group in the conjugate form. The observed feature bands at 1629 cm−1 and at 1546 cm−1 in Fig. 3c were originated from the telescopic vibration of C![[double bond, length as m-dash]](https://www.rsc.org/images/entities/char_e001.gif) N and the characteristic absorption of the benzene ring, respectively. The telescopic vibration absorption peak of the double bond between uranium and oxygen of uranyl was located at 982 cm−1, as shown in Fig. 1C.41
N and the characteristic absorption of the benzene ring, respectively. The telescopic vibration absorption peak of the double bond between uranium and oxygen of uranyl was located at 982 cm−1, as shown in Fig. 1C.41
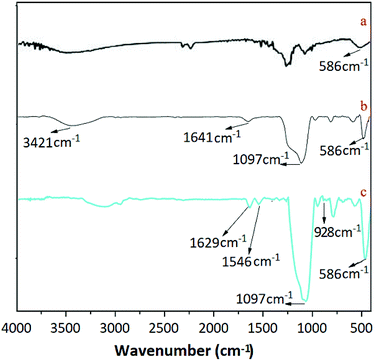 |
| | Fig. 3 FTIR spectra of Fe3O4 (a), Fe3O4@SiO2 (b) and UMCA (c). | |
3.3 Evaluation of the adsorption properties of UMCA
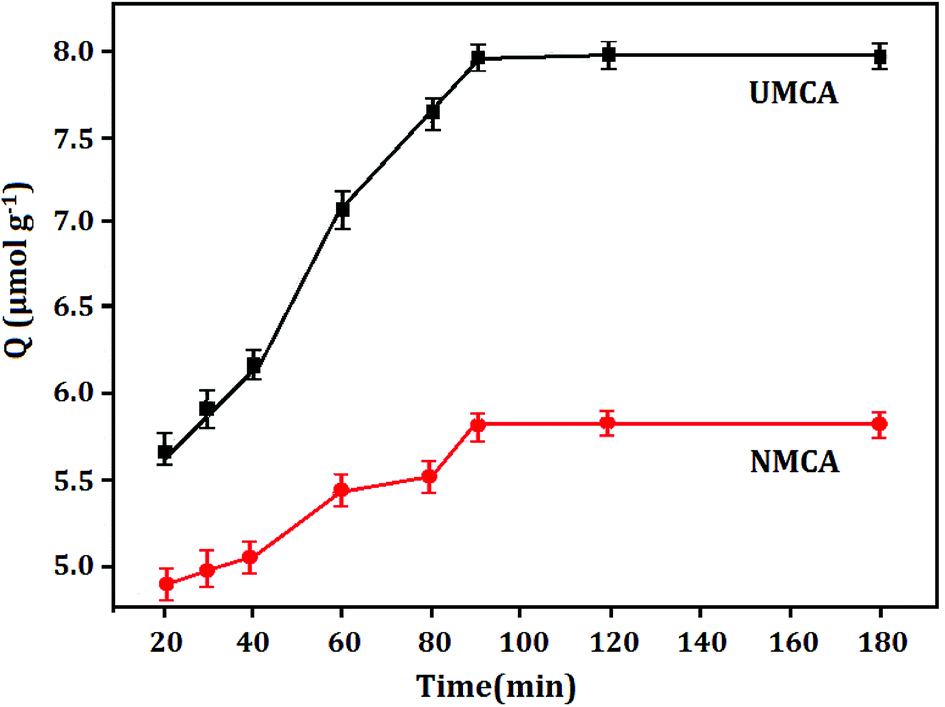
3.3.1 Kinetic adsorption capacity. Fig. 4 displays the adsorption capacity and adsorption time curve of UMCA and NMCA, which shows the adsorption kinetics characteristic of 50 μmol L−1 uranyl solution adsorbed onto the UMCA and NMCA. As shown in Fig. 4, the adsorption capacity of UMCA increases rapidly in the first 90 min because there are a large number of empty and high-affinity binding sites on the surface of UMCA, which make uranyl easy to combine with them as there is less resistance in the initial adsorption process. With the extension of time, the adsorption rate gradually slows and finally reaches equilibrium. Because of the lack of an imprinting process, NMCA had only some randomly distributed types of functional groups on its surface, and its adsorption capacity for uranyl was relatively low. Therefore, the adsorption capacity of UMCA was much higher than that of NMCA in all recombination processes.
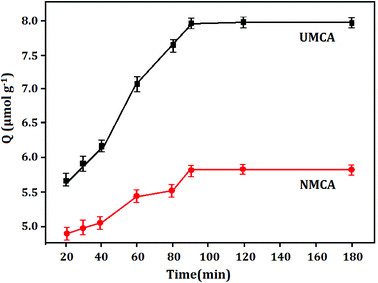 |
| | Fig. 4 The adsorption capacity–adsorption time curve of UMCA and NMCA. | |
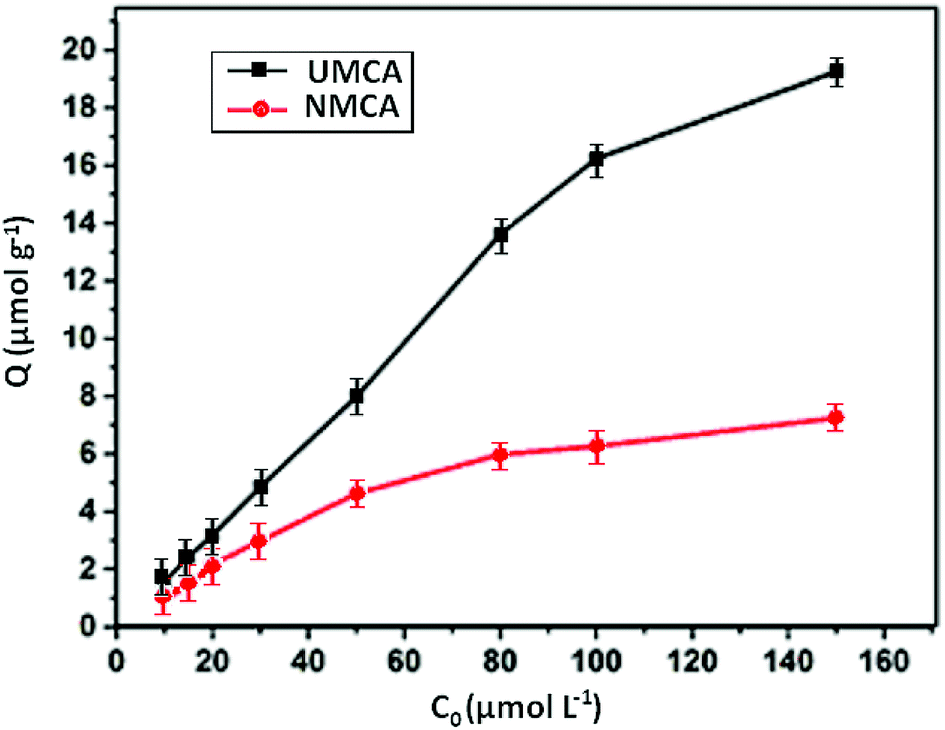
3.3.2 Static adsorption capacity. The recognition selectivity and specific binding of the chelating adsorbent UMCA can be evaluated by the relative adsorption capacity of uranyl ions.41 The rebinding experiments were carried out at different uranyl concentrations ranging from 10 to 150 μmol L−1 in the presence of 50 mg UMCA or NMCA at room temperature. The results of the experiment are shown in Fig. 5. As shown, the adsorption capacity increased with an increase in the initial uranyl concentration for both UMCA and NMCA, but the adsorption capacity of UMCA was much higher than that of NMCA. In addition, the adsorption capacity is related to the imprinting thickness.
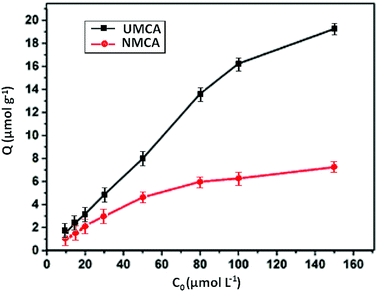 |
| | Fig. 5 The relationship between the adsorption capacity and concentrations of UMCA and NMCA. | |
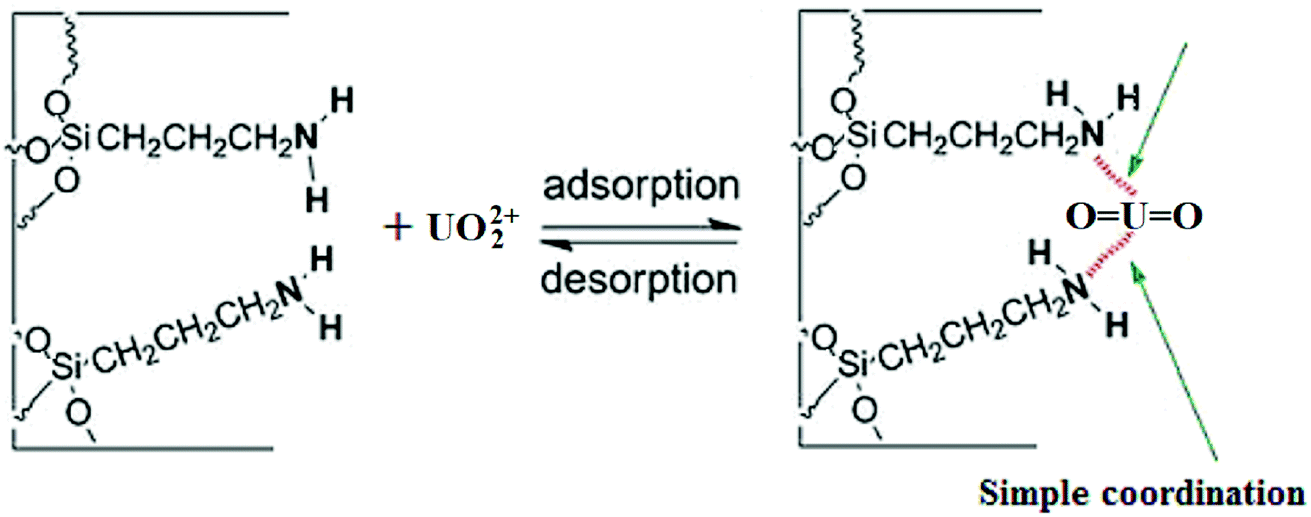
The Scatchard plot and equation for UMCA and NMCA could be obtained by further processing these saturated binding data according to eqn (2), and the processing results are shown in Fig. 6. As shown in Fig. 6, there are two straight lines, which indicate that two kinds of different binding sites exist in the UMCA: one exhibits high affinity or selectivity, while the other has low affinity or selectivity. The reason can be explained as follows: the former was due to a strong chelate coordination effect between the uranyl ion and salophen ligand (see Scheme 1), which exhibit high selectivity; the latter was due to a weak coordination effect between the single amino and uranyl ion (see Fig. 7), which has no selectivity. The dissociation constants for the high-affinity sites and the low-affinity sites were KD1 = 0.013 mol L−1 and KD2 = 0.236 mol L−1, respectively. The saturated adsorption capacity for the high-affinity sites and the low-affinity sites were Qmax1 = 9.26 μmol g−1 and Qmax2 = 82.9 μmol g−1, respectively. There was only a straight line, which exhibited lower selectivity and affinity for NMCA.
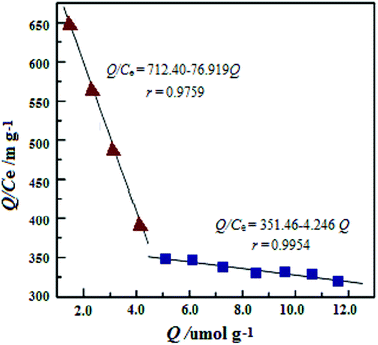 |
| | Fig. 6 Scatchard plot analysis of the binding characteristics between UMCA and UO22+. | |
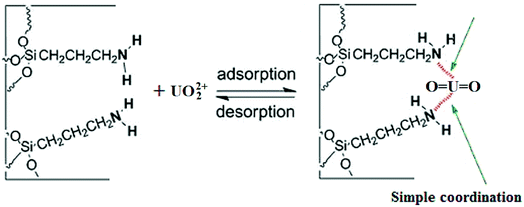 |
| | Fig. 7 Schematic illustration for the weak coordination effect between the amino group and UO22+. | |
3.3.3 Studies on competitive recognition. Thorium (Th4+), which often coexists with uranium, was selected as a reference material for competitive recognition research. According to eqn (3)–(5), experimental data including the adsorption capacity (Q), the distribution coefficient (Kd), the selectivity coefficient (k) and the relative selectivity coefficient (k0) were obtained in these competitive recognition experiments and are shown in Table 2. Therein, Kd shows the adsorption ability of a substance by an adsorbent, k reveals the dissimilarity of two different substances adsorbed by one adsorbent and k0 indicates the selectivity of two different adsorbents for one substance.42
Table 2 Competitive adsorption of UO22+ and Th4+ by UMCA and NMCA
| Analytes |
Q/μmol g−1 |
Kd/L g−1 |
k |
k0 |
| UMCA |
MCA |
UMCA |
NMCA |
UMCA |
NMCA |
| UO22+ |
8.561 |
2.068 |
0.4520 |
0.1068 |
|
|
|
| Th4+ |
2.236 |
2.065 |
0.1091 |
0.1089 |
4.232 |
1.002 |
4.101 |
It could be seen from Table 2 that the UMCA demonstrated about 3.5 times the adsorption capacity of UO22+ to Th4+, while UO22+ and Th4+ had similar Kd on NMCA. The k value of UMCA was about four times that of NMCA, which revealed the high selectivity of UMCA to uranyl; the k0 value of 4.101, which was greater than 1, also showed a higher binding specificity of UMCA than that of NMCA. Although the uranyl ion was not directly used as a template, these results still implied that UMCA had a good imprinting effect on uranyl.
3.4 Stability and repeatability of UMCA
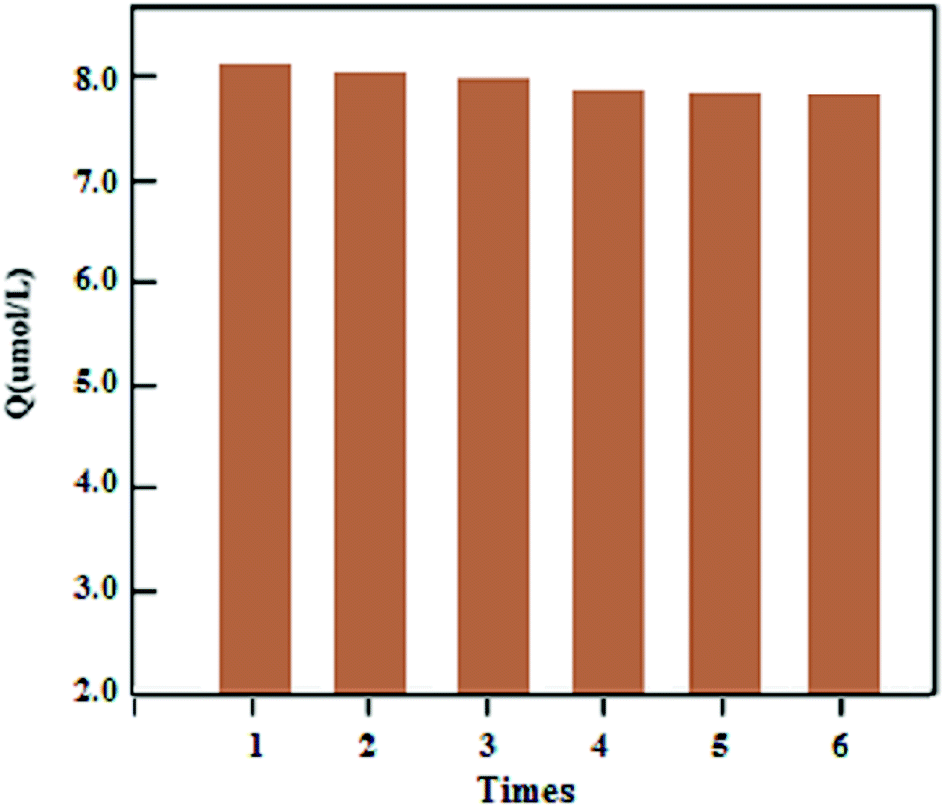
The stability of the synthesized UMCA was examined by comparing the adsorption capacities of uranyl in six consecutive adsorption–desorption cycles. Fig. 8 showed that the adsorption capacity decreased slowly with the increasing number of cycles, and the adsorption capacity decreases by only about 4.58% after six regeneration cycles. In order to investigate the repeatability of UMCA, six batches of UMCA were independently prepared under the same experimental conditions and used to carry out parallel adsorption experiments on the same uranyl solution. The relative standard deviation of the experimental results was less than 5.24%. The above results demonstrated that the UMCA had good stability, potential regeneration and acceptable repeatability.
 |
| | Fig. 8 Stability and potential regeneration of the UMCA. | |
3.5 Separation of UMCA via magnetism
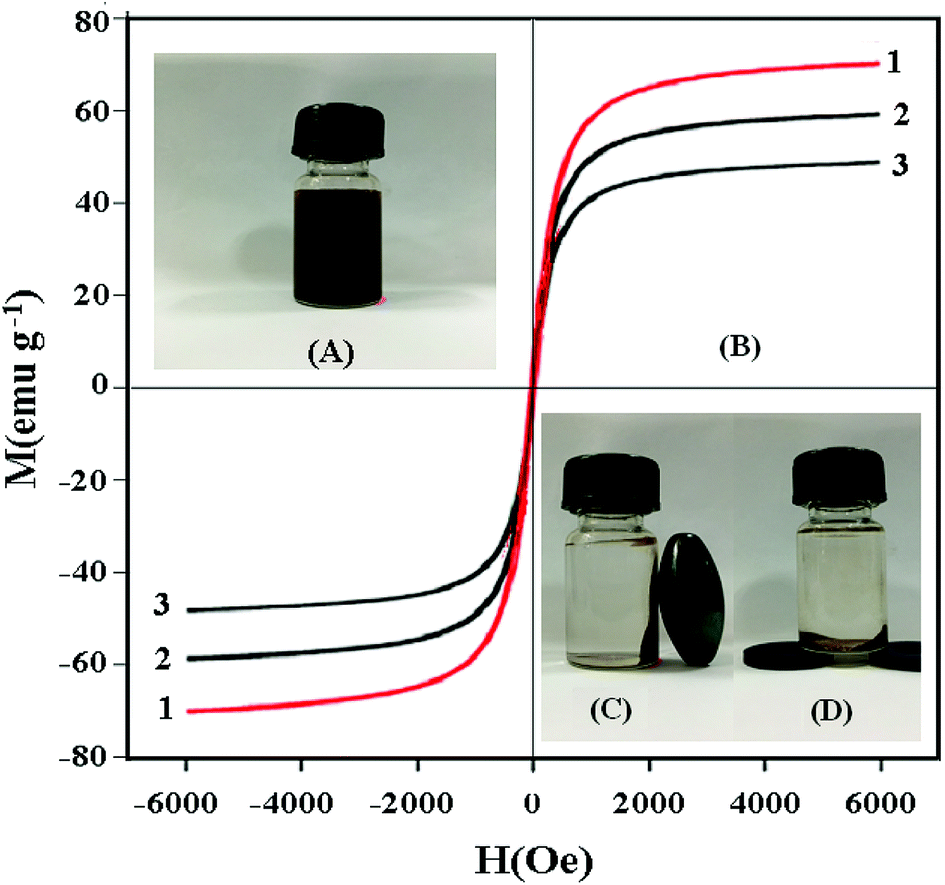
The magnetic hysteresis loops of Fe3O4 (1), Fe3O4@SiO2 (2) and UMCA (3) are measured and presented in Fig. 9. It can be seen from Fig. 9B that there is no hysteresis, both remanence and coercivity values are zero, suggesting that the samples are superparamagnetic. The saturation magnetization (Ms) values were 70.56 emu g−1, 59.49 emu g−1 and 49.63 emu g−1 at room temperature, respectively. The Ms of UMCA was reduced by 20.93 emu g−1 in comparison with the bulk Fe3O4 but remained strongly magnetic and allowed for use as an effective magnetic separation carrier.43–45 UMCA particles could be dispersed uniformly in the solution (Fig. 9A). Fig. 9C and D show the separation process of UMCA. When an external magnetic field was applied, the black particles were attracted to the walls or the bottom of the vial and the dispersion became clear and transparent. This is very convenient for the separation of UMCAs from the adsorption solution.
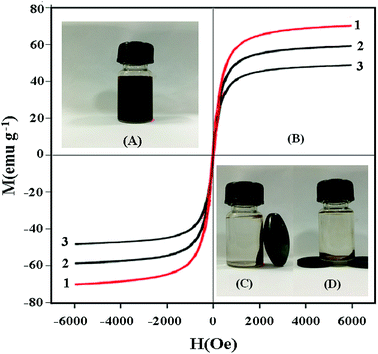 |
| | Fig. 9 Investigation of the magnetic properties of UMCA. (A) UMCA particles are dispersed uniformly in solution; (B) the magnetization curves of Fe3O4 (1), Fe3O4@SiO2 (2) and UMCA (3); (C) UMCA is separated from solution by an external magnetic field on the lateral wall; (D) UMCA is separated from solution by an external magnetic field at the bottom. | |
3.6 Validation of UMCA applicability
According to Section 2.7, the prepared UMCA was used to separate and detect trace uranium in several environmental water samples to validate its practical application.
There was a linear relationship between the ΔF at 544 nm and the concentration of UO22+ solutions in the range of 0.89–33.6 nmol L−1 with a correlation coefficient of 0.9965. The limit of detection was 0.15 nmol L−1 (at three times the signal-to-noise ratio), which is lower than the reported values of 14.7 nmol L−1 (ref. 12) and 0.33 nmol L−1.16
As can be seen in Table 3, the recoveries of uranyl changed from 92.5% to 103.0% for the three real samples. The results indicate that the as-prepared UMCA exhibits good performance for the selective extraction of uranyl from real samples.
Table 3 The determination results of UO22+ in real samples (n = 6)
| Samples |
Added (μg L−1) |
Found (μg L−1) |
Recovery (%) |
RSD (%) |
| N.D. not detected. |
| Pond water |
0.0 |
N.D.a |
— |
— |
| 0.4 |
0.409 |
102.3 |
2.36 |
| 0.8 |
0.775 |
96.9 |
3.48 |
| River water |
0.0 |
N.D. |
— |
— |
| 0.4 |
0.412 |
103.0 |
3.36 |
| 0.8 |
0.805 |
100.6 |
5.48 |
| Polluted water |
0.0 |
1.06 |
— |
4.46 |
| 0.4 |
1.44 |
95.0 |
4.58 |
| 0.8 |
1.80 |
92.5 |
4.32 |
3.7 The selectivity test for other metal ions
Water samples, especially those from different environments, often contain a series of other metal ions, which will greatly affect the adsorption efficiency. The influences of other metal ions on the proposed method were assessed by analyzing synthetic sample solutions containing 0.4 ng mL−1 of UO22+, where some metal cations had been added according to the likely interference composition in actual water samples. The tolerance limit is defined as the ratio of foreign substance that gives a relative error of not more than ±5%. The results showed that the following metal ions would not interfere with the determination: more than 600 times K+, Na+; 500 times Ca2+, Mg2+, Co2+, Cu2+, Sn4+; 200 times Ni2+, Sr+, Pb2+, Cr3+; 100 times Cd2+, Zn2+, Hg2+, Al3+, Ag+, Ra2+; and 50 times, Mn2+, As3+. Thus, it can be seen that most of the metal ions added are tolerable at high concentrations and have no effect on the extraction efficiency and determination of uranium.
4 Conclusions
A core–shell surface imprinted UMCA has been successfully synthesized and was used successfully for the separation and determination of uranyl by SPE coupled with multiphase photocatalytic resonance fluorescence method. The synthesized UMCA has excellent adsorption capacity, special recognition selectivity, high extraction efficiency and good stability and reproducibility for uranyl ions. Because of the excellent photocatalytic properties of UMCA after the adsorbed uranyl ion in the samples, it can be used directly as a catalyst to detect uranium by multiphase photocatalytic fluorimetry, which reduces the complex elution process and avoids the loss of uranium during the elution process. Thus, the accuracy of the detection was significantly improved. The technique reported in this paper can provide an efficient, selective and inexpensive method for the separation and enrichment of trace uranium in environmental water samples.
Conflicts of interest
There are no conflicts to declare.
Acknowledgements
The authors wish to thank the Hunan Technology Department Foundation, China (No. 2015SK20012) and the Hunan Education Department Foundation in China (No. 14A123) for their financial support.
References
- P. C. Valerie, S. D. Sabine, B. Veronique, G. Tatiana, V. Claude, C. Gaelle, S. P. Lorenzo, P. Sophie, A. S. Rasha, D. A. Christophe and F. C. Georges, Arch. Toxicol., 2017, 91, 1903–1914 CrossRef PubMed.
- S. V. Gudkov, A. V. Chernikov and V. I. Bruskov, Russ. J. Gen. Chem., 2016, 86, 1531–1538 CrossRef CAS.
- J. Lourenço, S. Marques, F. P. Carvalho, J. Oliveira, M. Malta, M. Santos, F. Gonçalves, R. Pereira and S. Mendo, Sci. Total Environ., 2017, 605/606, 391–404 CrossRef PubMed.
- A. Srivastava, V. Chahar, V. Sharma, Y. Sun, R. Bol, F. Knolle, E. Schnug, F. Hoyler, N. Naskar, S. Lahiri and R. Patnaik, J. Radioanal. Nucl. Chem., 2017, 314, 1367–1373 CrossRef CAS.
- B. Q. Li, L. K. Liu and W. L. Hao, J. Nucl. Radiochem., 2014, 36, 104–108 CAS.
- F. Pointurier, A. Hubert and N. Baglan, J. Radioanal. Nucl. Chem., 2008, 276, 505–511 CrossRef CAS.
- G. Helle, C. Mariet and G. Cote, Talanta, 2015, 139, 123–131 CrossRef CAS PubMed.
- D. L. Stoliker, N. Kaviani and D. B. Kent, Geochem. Trans., 2013, 14, 1–9 CrossRef CAS PubMed.
- C. Banerjee, N. Dudwadkar and S. C. Tripathi, J. Hazard. Mater., 2014, 280, 63–70 CrossRef CAS PubMed.
- N. L. Misra, K. D. S. Mudher and V. C. Adya, Spectrochim. Acta, Part B, 2005, 60, 834–840 CrossRef.
- A. Saha, T. Debnath, S. Neogy, H. N. Ghosh, M. K. Saxena and B. S. Tomar, Sens. Actuators, B, 2017, 253, 592–602 CrossRef CAS.
- B. Agnieszka, R. Janusz and G. Lukasz, J. Electrochem. Soc., 2017, 164, B470–B475 CrossRef.
- Z. Robert, G. Lukasz and M. Elzbieta, Sens. Actuators, B, 2017, 238, 540–547 CrossRef.
- W. I. Mortada, I. M. M. Kenawy, G. G. El-Gamal and S. M. N. Moalla, J. Radioanal. Nucl. Chem., 2017, 313, 69–77 CrossRef CAS.
- H. Y. Zhang, X. Cheng, L. Chen, F. Mo, L. J. Xu and F. F. Fu, Anal. Chim. Acta, 2017, 956, 63–69 CrossRef CAS PubMed.
- R. K. Dutta and K. Ambika, Anal. Chem., 2016, 88, 9071–9078 CrossRef CAS PubMed.
- M. L. Wu, L. F. Liao and M. M. Zhao, Anal. Chim. Acta, 2012, 729, 80–84 CrossRef CAS PubMed.
- E. M. Thazhathuparambil, P. P. Krishnapillai and P. R. Talasila, J. Hazard. Mater., 2011, 188, 384–390 CrossRef PubMed.
- G. R. Li, J. K. Li and Q. Han, Anal. Methods, 2016, 8, 5984–5993 RSC.
- J. K. Li, G. R. Li and Q. Han, Spectrochim. Acta, Part A, 2016, 169, 208–215 CrossRef CAS PubMed.
- L. Zhou, C. Shang, Z. Liu, G. Huang and A. A. Adesina, J. Colloid Interface Sci., 2012, 366, 165–172 CrossRef CAS PubMed.
- X. N. Yan, J. Deng, J. S. Xu, H. Li, L. L. Wang, D. Chen and J. Xie, Sens. Actuators, B, 2012, 171/172, 1087–1094 CrossRef.
- T. N. Tawanda, C. Ewa and C. Luke, Toxicol. Environ. Chem., 2016, 98, 1–12 CrossRef.
- J. Qian, S. Zhang, Y. Zhou, P. Dong and D. B. Hua, RSC Adv., 2015, 5, 4153–4161 RSC.
- T. Muhammad, L. Cui and W. Jide, Anal. Chim. Acta, 2012, 709, 98–104 CrossRef CAS PubMed.
- X. H. Gu, R. Xu, G. L. Yuan, H. Lu, B. R. Gu and H. P. Xie, Anal. Chim. Acta, 2010, 675, 64–70 CrossRef CAS PubMed.
- Z. H. Zhang, X. Yang, X. Chen, M. L. Zhang, L. J. Luo, M. J. Peng and S. Z. Yao, Anal. Bioanal. Chem., 2011, 401, 2855–2863 CrossRef CAS PubMed.
- D. Chen, J. Deng, J. Liang, J. Xie, K. Huang and C. Hu, Anal. Methods, 2013, 5, 722–728 RSC.
- Z. Xu, L. Ding, Y. J. Long, L. G. Xu, L. B. Wang and C. L. Xu, Anal. Methods, 2011, 3, 1737–1744 RSC.
- X. Wang, Q. Kang, D. Shen, Z. Zhang, J. Li and L. Chen, Talanta, 2014, 124, 7–13 CrossRef CAS PubMed.
- S. Xu, J. Li and L. Chen, J. Mater. Chem., 2011, 21, 4346–4351 RSC.
- M. Zhao, L. Liao, M. Wu, Y. Lin, X. Xiao and C. Nie, Biosens. Bioelectron., 2012, 34, 106–111 CrossRef CAS PubMed.
- C. Hui, C. M. Shen, T. Z. Yang, L. H. Bao, J. F. Tian, H. Ding, C. Li and H. J. Gao, J. Phys. Chem. C, 2008, 112, 11336–11339 CrossRef CAS.
- C. Hu, J. Deng, Y. Zhao, L. Xia, K. Huang, S. Ju and N. Xiao, Food Chem., 2014, 158, 366–373 CrossRef CAS PubMed.
- X. Wang, L. Y. Wang, X. W. He, Y. K. Zhang and L. X. Chen, Talanta, 2009, 78, 327–332 CrossRef CAS PubMed.
- Z. Zhang, L. Chen, F. Yang and J. Li, RSC Adv., 2014, 4, 31507–31514 RSC.
- M. Zhang, B. L. Cushing and C. J. Connor, Nanotechnology, 2008, 19, 085601–085605 CrossRef PubMed.
- H. F. Men, H. Q. Liu, Z. L. Zhang, J. Huang, J. Zhang, Y. Y. Zhai and L. Li, Environ. Sci. Pollut. Res., 2012, 19, 2271–2280 CrossRef CAS PubMed.
- J. H. Wang, S. R. Zheng, Y. Shao, J. L. Liu, Z. Y. Xu and D. Q. Zhu, J. Colloid Interface Sci., 2010, 349, 293–299 CrossRef CAS PubMed.
- X. B. Luo, S. L. Luo, Y. C. Zhan, H. Y. Shu, Y. N. Huang and X. M. Tu, J. Hazard. Mater., 2011, 192, 949–955 CrossRef CAS PubMed.
- Z. J. Duan, L. P. Fan, G. Z. Fang, J. H. Yi and S. Wang, Anal. Bioanal. Chem., 2011, 401, 2291–2299 CrossRef CAS PubMed.
- D. M. Han, G. Z. Fang and X. P. Yan, J. Chromatogr. A, 2005, 1100, 131–136 CrossRef CAS PubMed.
- F. Ning, H. Peng, L. Dong, Z. Zhang and J. Li, J. Agric. Food Chem., 2014, 62, 11138–11145 CrossRef CAS PubMed.
- L. Shi, Y. Tang, Y. Hao, G. He and R. Gao, J. Sep. Sci., 2016, 39, 2876–2883 CrossRef CAS PubMed.
- R. Gao, X. Cui, Y. Hao, G. He and M. Zhang, Talanta, 2016, 150, 46–53 CrossRef CAS PubMed.
|
| This journal is © The Royal Society of Chemistry 2018 |
Click here to see how this site uses Cookies. View our privacy policy here. 
 Open Access Article
 This Open Access Article is licensed under a Creative Commons Attribution-Non Commercial 3.0 Unported Licence
 *,
Meng-Yuan Xu,
Jie-Kang Li and
Yang Yang
*,
Meng-Yuan Xu,
Jie-Kang Li and
Yang Yang