 Open Access Article
Preparation of polycarbonate diols (PCDLs) from dimethyl carbonate (DMC) and diols catalyzed by KNO3/γ-Al2O3†
Menglu Songab,
Xiangui Yang *a and
Gongying Wanga
aChengdu Institute of Organic Chemistry, Chinese Academy of Sciences, Chengdu 610041, China. E-mail: yangxg@cioc.ac.cn
bNational Engineering Laboratory & Technology, University of Chinese Academy of Sciences, Beijing 101408, China
First published on 12th October 2018
Abstract
γ-Al2O3 loaded with potassium nitrate (KNO3/Al2O3) catalysts were prepared, characterized and employed as a type of heterogenous solid base catalyst in the synthesis of polycarbonate (1,4-butane carbonate)-diol (PBC–OH) via the transesterification of dimethyl carbonate (DMC) and 1,4-butanediol (BD). The relationship between physicochemical properties and catalytic performance for KNO3/Al2O3 in this transesterification reaction was investigated using various techniques. The results demonstrated that the performance of KNO3/Al2O3 catalysts was highly influenced by basic site amount and strength. The medium and strong basic sites were beneficial for this reaction. The catalyst with a KNO3 loading of 35% and a calcination temperature of 700 °C exhibited the best catalytic activity due to its highest basic site amount and appropriate base strength. The highest BD conversion and PBC–OH yield of 80.2% and 68.4% were obtained under optimal reaction conditions. Also, this solid base catalyst was successfully employed in the synthesis of copolycarbonate diols from DMC and two different diols. Different scanning calorimetry results indicated that the thermal properties of the copolycarbonate diols can be adjusted by regulating the average segment lengths, Mn and copolymer composition structure.
1 Introduction
Polyurethanes (PUs) are one of the most versatile plastic materials. The nature of their chemistry allows polyurethanes to be molded into unusual shapes and to enhance industrial and consumer products by adding comfort, warmth and convenience to our lives. PUs thus are widely used in producing clothing, plastics and biomedical products. The demands for these products have increased at a stable rate in recent years.1,2 In general, PUs are synthesized from ether- and ester-based macrodiols. In order to improve the properties of PUs, such as flexibility and mechanical performance, weather and fungi resistance, anti-oxidation and anti-ultraviolet properties, polycarbonate diols (PCDLs) have been introduced by the academic and industrial community to prepare PUs.3–6In the past decades, several approaches have been developed for the synthesis of PCDLs.7–9 Among them, the two-step condensation polymerization of dimethyl carbonate (DMC) and aliphatic diols is preferred by researchers to prepare bulk PCDLs. This is because this method avoids the use of toxic chemicals like phosgene, and has flexibility for the synthesis of PCDLs with diverse structures.10
Generally, there are two different types of catalysts for the two-step condensation polymerization, i.e., homogeneous and heterogeneous catalysts. Homogeneous catalysts, such as sodium acetyl acetone (NaAcac),11 alkali metal salts,12 metal acetates,13,14 and NaH,15 have the advantage of high efficiency and have been widely employed in industry.16 However, it is difficult to separate the mixture of homogeneous catalyst and products through some simple separation methods. In this context, the development of heterogeneous catalysts is necessary considering the demerits of homogeneous catalysts.17 Several applications of heterogeneous catalysts have been reported in literature. For example, Feng et al.18,19 reported KF/Al2O3 and calcined MgAl hydrotalcite exhibited good catalytic performance for the synthesis of poly(1,6-hexane carbonate)-diol (PHC-diol) from DMC and 1,6-hexanediol (HD). The HD conversion and PHC-diol yield achieved as high as 85% and 96%, respectively. However, the polyurethane has a low flexibility and elastic recovery, if it is only prepared by PHC-diol.20 In order to address these problems, aliphatic polycarbonate diols using 1,4-butanediol (BD) or two or more types of diols are disclosed. Recently, Lee et al.1 and Kim et al.21 considered NaH as the catalyst in the synthesis of copolycarbonate diols. However, the separation of catalysts is still a troublesome problem. In this perspective, it is significant to find a heterogeneous catalyst, which is easily to separate with the products and also has good catalytic activities in the synthesis of poly(1,4-butane carbonate)-diol (PBC–OH) and copolycarbonate diols.
γ-Al2O3 is commonly used as a heterogeneous support due to its high surface area and good availability.22 γ-Al2O3 loaded with alkali metal salt, such as NaOH,22 NaNO3,23 KNO3,24,25 KI26 and KOH27 have been widely used in the synthesis of biodiesel. However, the synthesis of PBC–OH and copolycarbonate diols using γ-Al2O3-based catalysts is rarely reported in literature.
In this work, KNO3/Al2O3 is used as the catalyst for the transesterification of DMC and BD. The relationship between the basic properties and catalytic activities was studied by X-ray powder diffraction (XRD), Fourier transform infrared spectrometry (FTIR), Brunauer–Emmett–Teller (BET), and CO2 temperature-programmed desorption (CO2-TPD) methods. By using this solid base catalyst, the copolycatbonate diols are also synthesized and the thermal properties were investigated by different scanning calorimetry (DSC).
2 Experimental
2.1 Materials and instruments
The chemical materials involved are as follows: KNO3, γ-Al2O3, DMC and 1,4-butanediol (BD) were purchased from Chengdu Kelong Chemical Company (China). 1,6-Hexanediol (HD) and 1,4-cyclohexanedimethanol (CHDM) were obtained from Shanghai Aladdin Bio-Chem Technology Co., Ltd., China. KNO3, DMC and HD were used as received. γ-Al2O3 was pretreated at 500 °C for 5 hours prior to impregnation. And BD was dried with 4 Å molecular sieves before use.The distillate in the first step was determined using a gas chromatograph (Shimadzu GC-14B) fitted with a flame ionization detector (FID). PEG 20 M was used as stationary phase. The column temperature was 120 °C and injection temperature was 200 °C. The BD conversion and the yield of polymer were calculated by eqn (1) and (2), respectively.
 | (1) |
 | (2) |
The polymer structures were identified using 1H nuclear magnetic resonance (1H NMR). 1H NMR was recorded in CDCl3 at 25 °C by using a Bruker DRX-300 NMR spectrometer.
Number average molecular weight (Mn) and polydispersity index (PDI) of polymer were analyzed by employing a gel permeation chromatography (GPC) system equipped with a 2690D separation module and a 2410 refractive index detector. The system was performed at 30 °C and a flow rate of 0.5 mL min−1 with tetrahydrofuran (THF) as eluent.
DSC tests were carried out on a TA Instrument DSC-Q20 thermal analyzer under nitrogen atmosphere. The samples were loaded in aluminium pans, heated to 120 °C and kept for 5 min to remove thermal history, then were cooled to −80 °C at a rate of 10 °C min−1, and finally were reheated to 120 °C at the same rate. From the second heating run, the glass transition temperature (Tg) and melting temperature (Tm) of the copolymers of polycarbonate diols was obtained.
2.2 Characterization of catalysts
The catalyst samples were characterized by FTIR analysis using a ThermoFisher Nicolet 6700 spectrometer with a resolution of 0.4 cm−1.XRD analysis was conducted on a PANalytical X'pert Prodiffractometer using a radiation source of Co Kα radiation (λ = 0.1789 nm), within the 2θ range from 5° to 80°.
The surface areas of catalysts were measured using a BET surface analysis apparatus with N2 gas. The total pore volume was estimated according to the Barrett–Joyner–Halenda (BJH) method based on the adsorption isotherm.
The basicity of catalysts was measured by CO2-TPD. In a typical experiment, the catalyst (100 mg) was pretreated in the environment of He with a flow rate of 30 mL min−1 at 600 °C for 2 h to remove moisture and other adsorbed gases. After cooling down to 50 °C, the catalyst was exposed to the environment of pure CO2 for 2 h, and then purged with He with a flow rate of 30 mL min−1 for 2 h to exclude physically adsorbed CO2. Subsequently, the sample was heated to 800 °C at a rate of 10 °C min−1. The desorbed CO2 was detected using a thermal conductivity detector.
The content of K after calcination was detected by inductively coupled plasma optical emission spectrometer (ICP-OES) using an Agilent 7700 instrument.
2.3 Preparation of catalysts
The catalysts were prepared by an incipient wetness impregnation method. In a typical process, 5 g Al2O3 was impregnated using 5 mL of KNO3 aqueous solution with appropriate concentration. Then, the mixture was kept at room temperature for 24 h. After removing the water on a rotary evaporator, the white solid was dried at 105 °C for 12 h and then calcined at a given temperature for 5 h. The catalyst obtained was denoted as ω% KNO3/Al2O3-T, where ω and T represented the amount of KNO3 loading and calcination temperature, respectively.2.4 Synthesis of PBC–OH and copolycarbonate diols
The poly(1,4-butane carbonate)-diol (PBC–OH) was prepared by a two-step condensation polymerization method, i.e., transesterification and polycondenstation. A typical procedure was explained as follows.In the first step, DMC (21.62 g, 240 mmol), BD (18.21 g, 120 mmol) and some amounts of catalyst were successively charged into a 100 mL three-necked round-bottom flask, which was equipped with a mechanical stirrer, a reflux condenser, a nitrogen inlet and a thermometer. Next, the mixture was heated to 125 °C under nitrogen atmosphere and stirred continually for several hours. Then, the temperature was gradually increased to 170 °C and sustained for about 1 h to separate the by-product. In this process, the temperature at the distillation head was controlled under 64 °C in order to avoid too much loss of DMC.
In the second step, the polycondensation temperature was adjusted to 140 °C. The pressure was slowly reduced to about 5.0 × 10⁴ Pa and then sustained for 0.5 h. After that, the system pressure was gradually reduced to about 5.0 × 10³ Pa and maintained for 4 h. Finally, the polymer was obtained by dissolving the residue in dichloromethane (CH2Cl2) and precipitating it with excessive ethanol. The final products are dried in a vacuum oven for 12 h at 45 °C to constant weight. The copolycarbonate diols were synthesized via a similar procedure.
3 Results and discussion
3.1 Screening of the catalyst
The catalytic performance screening of Al2O3 supported with different nitrates in the transesterification of DMC and BD was investigated. The results are presented in Table 1. Clearly, the pure Al2O3 showed no activity (entry 1). However, when Al2O3 was loaded with nitrates and activated at 700 °C, the supported catalysts showed catalytic activity. The LiNO3/Al2O3, NaNO3/Al2O3, and KNO3/Al2O3 (entries 1–3) manifested high catalytic activities, having BD conversions of at least 66%. In particular, KNO3/Al2O3 demonstrated the highest activity of 80.2% of BD conversion. BD conversions for Mg(NO3)2/Al2O3 and Ca(NO3)2/Al2O3 catalysts (entries 5 and 6), however, were 17.2% and 50.1%, respectively. Based on the discussion above, KNO3/Al2O3 exhibited the best activity. Therefore, it was selected for further investigation and its properties were studied in detail.| Entries | Catalysts | BD conversion (%) |
|---|---|---|
| a The catalyst amount was 1.5 wt%. The loading amount of nitrates was 35%. All catalysts were activated at 700 °C for 5 h before use. | ||
| 1 | Al2O3 | 0 |
| 2 | LiNO3/Al2O3 | 66.3 |
| 3 | NaNO3/Al2O3 | 73.0 |
| 4 | KNO3/Al2O3 | 80.2 |
| 5 | Mg(NO3)2/Al2O3 | 17.2 |
| 6 | Ca(NO3)2/Al2O3 | 50.1 |
3.2 Catalyst characterization
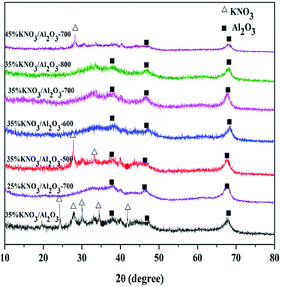
The XRD patterns of KNO3/Al2O3 catalysts with different KNO3 loadings and calcination temperature were measured, as displayed in Fig. 1. As shown, the uncalcined 35% KNO3/Al2O3 catalyst exhibits clear characteristic peaks of Al2O3 phase (2θ = 37°, 46°, 67°) and KNO3 phase (2θ = 23°, 27°, 29°, 34°, 41°).22,28 When the catalyst was calcinated at 500 °C, the diffraction peaks identical to KNO3 phase were obviously decreased in both the intensity and the number. This implies only part of KNO3 was decomposed at 500 °C. When the calcination temperature increased from 600 °C to 800 °C, neither characteristic peaks of KNO3 nor new phase, such as K2O, could be noted in the XRD patterns. This is possibly due to their high degree of dispersion or their smaller amounts on Al2O3 support than the detectable amount via the XRD technique.29 In order to check the content of the calcined catalyst, the content of K of the 35% KNO3/Al2O3-700 catalyst was investigated by ICP-OES. The quantitative of ICP-OES shows that 8.6% of K is yielded, which is lower than the theoretical value. This is because a small part of K was lost during the preparation and calcination. In fact, in our experiments, obvious corrosion was found on the inside wall of crucible.In the case of 25% KNO3/Al2O3 catalyst calcined at 700 °C, only diffraction peaks related to Al2O3 were detected. When the loading amount of KNO3 is higher than 35%, an obvious characteristic peak attributed to KNO3 phase appears. It indicates that the KNO3 loaded on Al2O3 support was over-saturated at a KNO3 loading amount of 45%. These results agree well with those reported by Islam et al.23 for NaNO3/Al2O3 catalyst.
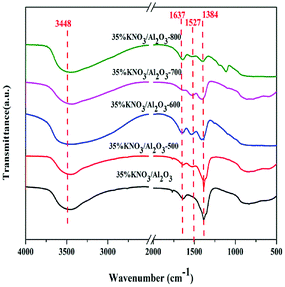
The investigation of all the uncalcined and calcined 35% KNO3/Al2O3 catalysts was conducted by FTIR spectroscopy as depicted in Fig. 2. In this figure, the peaks positioned at around 3500 cm−1 correspond to the stretching vibration of Al–O–K group.24 The peaks at 1637 cm−1 can be attributed to the bending mode of the surface hydroxyl group (–OH).22 The absorption bands at 1384 cm−1 indicate the presence of nitrate species (NO3−),28 and their intensity decrease gradually with the calcination temperature raising from 500 to 800 °C. This suggests that KNO3 tend to decompose at a high temperature. Meanwhile, no characteristic peaks assigned to NO2− (1550 cm−1 and 1320 cm−1) and KOH (3741 cm−1) are detected, which indicates that the production of KNO3 decomposition was K2O, rather than KNO2 and KOH.24,28,30 Moreover, it should be noted that weak characteristic peak of KNO3 could still be detected even if the catalyst was calcined at 800 °C. It indicates not all KNO3 loaded on the Al2O3 are decomposed under the activation conditions. This is due to the fact there exist interactions between KNO3 and Al2O3.24,26 The peaks at 1527 cm−1 denote the carbonates species, which is possibly generated through the carbonation of K2O with CO2 in air.28
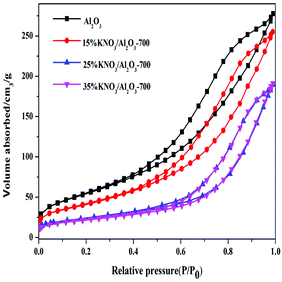
Fig. 3 gives the N2 adsorption–desorption isotherms of Al2O3 and KNO3/Al2O3-700 with different loading amount of KNO3. The isotherms of four samples are of type IV with an H4 hysteresis loop. Furthermore, the hysteresis loop of catalysts became narrower and the hysteresis point was shifted to higher P/P0 values. These phenomena imply that the average pore diameter increases after impregnation of Al2O3 with KNO3. The results for measured BET surface area and pore volume are presented in Table 2. It can be seen that both BET surface area and the pore volume are significantly decreased with the increasing content of KNO3. It is possibly ascribed to the effect of catalyst deposition on the support, blocking part of the porous network.31,32 However, the average pore diameter increases with the increase of the loading amount of KNO3. This finding is different from that reported by Xie et al.25 In their work, the pore size decreased with the increasing amount of the KNO3 loaded on the Al2O3. The possible reason could be that the thin layers formed on the surface of γ-Al2O3 reduce the small pores. This effect has little impact on large pores, and makes the catalyst pore sizes more equal, resulting in an increase in average pore size.33 From the analysis above, we can infer that KNO3 loaded on the Al2O3 was decomposed and K2O species are formed. K2O and Al–O–K can be used as the active sites in the transesterification of DMC and BD.
| Samples | BET surface area (m2 g−1) | Pore volume (cm3 g−1) | Pore diameter (nm) |
|---|---|---|---|
| Al2O3 | 261.4 | 0.44 | 5.6 |
| 15% KNO3/Al2O3-700 | 218.3 | 0.42 | 6.2 |
| 25% KNO3/Al2O3-700 | 141.7 | 0.34 | 6.8 |
| 35% KNO3/Al2O3-700 | 120.7 | 0.31 | 6.9 |
3.3 Basic properties of catalysts
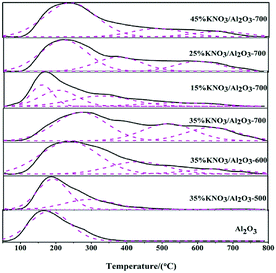
In order to investigate the relationship between the catalytic performance of a KNO3/Al2O3 catalysts and their basic site strength and amount, CO2-TPD technology was performed. The results are shown in Fig. 4. The desorption profiles were deconvoluted to incorporate three kinds of basic sites, i.e., weak, medium and strong basic sites. Generally, a higher temperature is needed to desorb the CO2 adsorbed on the more strong basic sites.34 As presented in Fig. 4, the position of CO2 desorption peaks moved to higher temperature with the increase of the loading amount of KNO3 and calcination temperature. It indicates that the basic strength of catalysts is enhanced with the increase of the loading amount of KNO3 and calcination temperature. The desorption peaks at a temperature of less than 350 °C can be attributed to the interaction of CO2 with weak basic sites. These sites correspond to the –OH group on the surface of γ-Al2O3.27,35 The peaks appearing at higher than 350 °C are characteristic of CO2 desorption from medium and strong basic sites, resulting from the Al–O–K and K2O species, respectively.23The basic site amounts on the catalysts are listed in Table 3. It is evident that the basicity of catalysts is also affected by the loading amount of KNO3 and calcination temperature. The basicity of catalysts increased with the increase of the loading amount of KNO3 and calcination temperature. The basicity reached a maximum value at a KNO3 loading amount of 35% and calcination temperature of 700 °C. This is mainly because the generation of active bases, such as K2O phase on the Al2O3 support, might desorb more CO2 and augment the basicity.23 However, further increase in the loading amount of KNO3 can reduce the basicity. These observations could be ascribed to the overloading of KNO3 that have saturated the Al2O3 surface (see XRD in Fig. 1). The dispersion of excess KNO3 could cover the active base sites which act as active sites for transesterification. Similar findings were also reported in literature.23,32,36
| Catalysts | Desorbed CO2 (μmol g−1) | Total evolved CO2 (μmol g−1) | BD conversion (%) | ||
|---|---|---|---|---|---|
| <350 °C | 350–550 °C | >550 °C | |||
| Al2O3 | 45 | 0 | 0 | 45 | 0 |
| 35% KNO3/Al2O3-500 | 39 | 28 | 0 | 67 | 71.3 |
| 35% KNO3/Al2O3-600 | 63 | 34 | 11 | 108 | 75.5 |
| 35% KNO3/Al2O3-700 | 81 | 83 | 34 | 198 | 80.2 |
| 15% KNO3/Al2O3-700 | 33 | 20 | 8 | 61 | 68.8 |
| 25% KNO3/Al2O3-700 | 71 | 32 | 23 | 126 | 77.2 |
| 45% KNO3/Al2O3-700 | 72 | 25 | 16 | 113 | 75.8 |
The results also show that the catalyst basicity has a strong influence on the catalytic activity in the transesterification of DMC and BD. As shown in Table 3, an increase in the amount of basic sites is favour to improve the BD conversion. In addition, it should be noted that there is no obvious difference in the weak basic sites between 45% KNO3/Al2O3-700 and 35% KNO3/Al2O3-700, but the medium and strong basic sites decreased dramatically. The corresponding BD conversion decreased from 80.2% to 75.8%. This means the medium and strong basic strength centres were catalytical active in the synthesis of PBC–OH via the transesterification of DMC and BD catalyzed by 35% KNO3/Al2O3-700. Similar findings are also reported in the work of Feng et al.18
3.4 Results of PBC–OH synthesis
As discussed above, the catalyst of 35% KNO3/Al2O3-700 exhibited the best catalytic activity. It is thus chosen to investigate the optimal reaction conditions on the synthesis of poly (1,4-butane carbonate)-diol (PBC–OH). Fig. 5 shows the impacts of catalyst amount on the synthesis of PBC–OH with the amount of 35% KNO3/Al2O3-700 varied from 0.1 wt% to 2 wt% (respect to the mass of BD). The BD conversion, Mn and the yield of PBC–OH were steadily improved with an increase in the catalyst amount from 0.1 wt% to 1.5 wt%, beyond which it did not further increase. This is probably attributed to the increase in basicity with the rising amount of catalyst. Therefore, the optimum amount of catalyst is 1.5 wt% for 35% KNO3/Al2O3-700.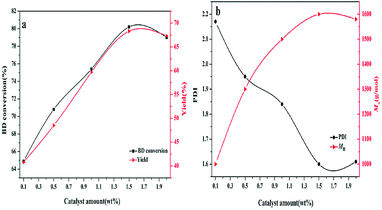 | ||
| Fig. 5 Effects of the amount of catalyst on (a) BD conversion and PBC–OH yield (b) PDI and Mn of PBC–OH(reaction conditions: polycondensation temperature: 140 °C; polycondensation time: 4.5 h). | ||
The effect of polycondensation temperature on the synthesis of PBC–OH was studied in the range of 120 °C to 180 °C. As shown in Fig. 6, Mn value gradually increased from 980 g mol−1 to 1600 g mol−1 with a PBC–OH yield increasing from 37.9% to 68.4%, when the polycondensation temperature increased from 120 °C to 140 °C. Mn reached the maximum of 1800 g mol−1 by raising the polycondensation temperature to 150 °C, whereas the PBC–OH yield decreased to 60.2%. If the temperature is further increased, both Mn and PBC–OH yield decreased sharply. This phenomenon means raising polycondensation temperature in a certain range benefits the polymerization reaction. However, excessive polycondensation temperature is detrimental to polycondensation reaction. This can be explained by the fact that high temperature could reduce the viscosity of the system, which is beneficial for the diffusion of low molecular weight by-products.37 It thus results in a higher value of Mn at a high temperature than that at a low temperature. Unfortunately, PBC–OH is not stable owing to its thermal degradation at higher temperature. Similar effects of polycondensation temperature on the synthesis of Mn of polycarbonates were reported by Wang et al.38 and Zhu et al.39 In order to obtain a high yield of PBC–OH, 140 °C should be selected as a suitable polycondensation temperature for the PBC–OH synthesis.
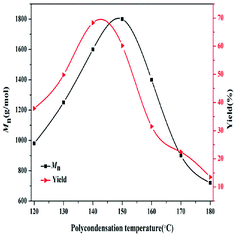 | ||
| Fig. 6 Effect of polycondensation temperature on the Mn and yield of PBC–OH (reaction conditions: catalyst amount: 1.5 wt%; polycondensation time: 4.5 h). | ||
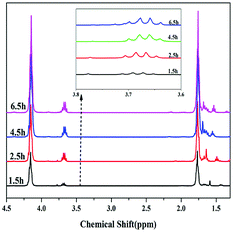
In addition, the dependence of polycondensation time on the PBC–OH synthesis was also investigated. Polycondensation time was performed from 0 h to 6.5 h with the amount of 1.5 wt% of catalyst and polycondensation temperature of 140 °C. As illustrated in Fig. 7, Mn, PDI and yield of resultant polymer increased quickly during the initial 4.5 h, and then changed slightly with prolonging time. This trend is mainly related to the chain-growth pathway in the polymerization reaction. As shown in previous literature, there are three possible chain-growth pathways during the polycondensation between dialkyl carbonate and diols: (1) transesterification between two carbonate end groups with elimination of dialkyl carbonate; (2) reaction between hydroxyl and carbonate end groups with removal of alcohol; (3) reaction between two short chains with two hydroxyl end groups through removing diols.15,40 In our previous study,41 it has been reported that the reaction rate between two short chains with hydroxyl end groups is slow under a certain range of temperature. As shown in Fig. 8, when the polycondensation reaction lasted for 1.5 h, obvious signals at 3.78 ppm can be detected in the 1H-NMR spectrum, indicating the presence of methyl carbonate end-group (–OCH3).42 The molar ratio of [–OCH3]/[–OH] in the product was 12![[thin space (1/6-em)]](https://www.rsc.org/images/entities/char_2009.gif) :
:![[thin space (1/6-em)]](https://www.rsc.org/images/entities/char_2009.gif) 88. The molar ratio of [–OCH3]/[–OH] decreased to 5
88. The molar ratio of [–OCH3]/[–OH] decreased to 5![[thin space (1/6-em)]](https://www.rsc.org/images/entities/char_2009.gif) :
:![[thin space (1/6-em)]](https://www.rsc.org/images/entities/char_2009.gif) 95 when the polycondensation time extended to 2.5 h. And signals for methyl carbonate disappeared when the polycondensation time extended to 4.5 h and 6.5 h. By comparing the 1H-NMR spectrum of polymer products at different polycondensation time, it can be confirmed that the reaction rate between two short chains with hydroxyl end groups is slow at a polycondensation temperature of 140 °C during the synthesis of PBC–OH catalyzed by 35% KNO3/Al2O3-700. This is also identical with our previous work.41
95 when the polycondensation time extended to 2.5 h. And signals for methyl carbonate disappeared when the polycondensation time extended to 4.5 h and 6.5 h. By comparing the 1H-NMR spectrum of polymer products at different polycondensation time, it can be confirmed that the reaction rate between two short chains with hydroxyl end groups is slow at a polycondensation temperature of 140 °C during the synthesis of PBC–OH catalyzed by 35% KNO3/Al2O3-700. This is also identical with our previous work.41
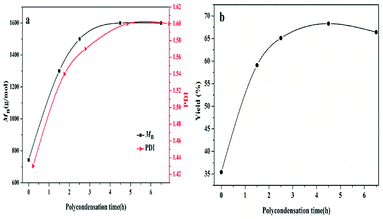 | ||
| Fig. 7 Effects of polycondensation time on the (a) Mn and PDI of PBC–OH (b) yield of PBC–OH (reaction conditions: catalyst amount: 1.5 wt%; polycondensation temperature: 140 °C). | ||
3.5 Recyclability test
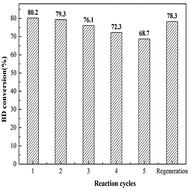
Reusability is a key criterion to evaluate a heterogeneous catalyst. The reusability of the 35% KNO3/Al2O3-700 is depicted in Fig. 9. The catalyst was recovered by filtration, and washed with dichloromethane (CH2Cl2) for several times. Next, it is dried at 45 °C in vacuum for 24 h for the next use. It was found that the BD conversion dropped slowly with the increase of reused time. The BD conversion was still above 70%, when the catalyst was repeated used for four times. A BD conversion of 68.7% was obtained at the fifth run. If the catalyst disposed by the fifth experiment was recalcined at 700 °C for 5 h in air and reused in the next experiment, a BD conversion of 78.3% was attained. It indicates the catalyst can restore almost all its original activity.In order to further explore the reasons of deactivation of the catalyst, the catalysts were characterized by FTIR method, as shown in Fig. 10. Compared with the fresh catalyst (curve a), the fifth reused catalyst (curve b) showed absorption peaks at 2945 cm−1 and 2841 cm−1, which corresponded to the asymmetric and symmetric C–H stretching vibration of methylene, respectively.17 The peaks at 1746 cm−1 and 1263 cm−1 are due to the stretching and asymmetric stretching vibration as of C![[double bond, length as m-dash]](https://www.rsc.org/images/entities/char_e001.gif) O and O–C–O of the carbonate backbone, respectively.13 These peaks indicate the presence of PBC–OH. Furthermore, the fifth reused catalyst was also washed by chloroform (CHCl3) and characterized by FTIR (curve c). Obvious peaks for PBC–OH can also be detected. It implies that it is unavoidable for the residual of PBC–OH. According to work of Feng et al.,19 the pore structure played a key role in the synthesis of PCDLs. Therefore, we speculate that part of PBC–OH remained in the pore of the catalysts, which could not be removed completely by washing with solvent. Upon regeneration by heating at 700 °C for 5 h in air (curve d), most of the peaks for PBC–OH disappeared, implying the removal of PBC–OH deposit by air oxidation. Furthermore, on the basis of the results of FTIR, it was speculated that the trace PBC–OH covered part of the active center, resulting in the catalyst deactivation.
O and O–C–O of the carbonate backbone, respectively.13 These peaks indicate the presence of PBC–OH. Furthermore, the fifth reused catalyst was also washed by chloroform (CHCl3) and characterized by FTIR (curve c). Obvious peaks for PBC–OH can also be detected. It implies that it is unavoidable for the residual of PBC–OH. According to work of Feng et al.,19 the pore structure played a key role in the synthesis of PCDLs. Therefore, we speculate that part of PBC–OH remained in the pore of the catalysts, which could not be removed completely by washing with solvent. Upon regeneration by heating at 700 °C for 5 h in air (curve d), most of the peaks for PBC–OH disappeared, implying the removal of PBC–OH deposit by air oxidation. Furthermore, on the basis of the results of FTIR, it was speculated that the trace PBC–OH covered part of the active center, resulting in the catalyst deactivation.
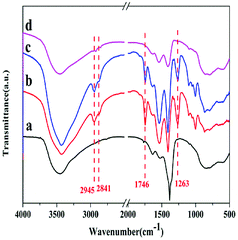 | ||
| Fig. 10 FTIR spectra of (a) fresh catalyst, (b) fifth reused catalyst washed by CH2Cl2, (c) fifth reused catalyst washed by CHCl3 (d) regenerated catalyst. | ||
3.6 Catalytic activity for other diols
Finally, in order to examine the versatility of the system, we synthesized copolycarbonate diols through the transesterification of DMC and two different diols using 35% KNO3/Al2O3-700. The copolycarbonate diols incorporated with line diols (BD and HD) and cycloaliphatic diol (BD and CHDM) were obtained, and the corresponding copolycarbonate diols were labeled as PBHC–OHx and PBCC–OHx, where x is the molar ratio of HD and CHDM molar content to total diols in feed, respectively. It should be noted that variable x was in the range of 10 to 50, because no product was generated when x was higher than 50. It is possibly due to the different reactivity of BD towards HD and CHDM. The molar compositions in final polymer are exhibited in Table 4. It is noteworthy that the molar ration of BD/HD in copolymer is slightly lower than that of BD/HD in feed. This is mainly attributed to side reaction of BD in transesterification.43| Entry | Sample | Diol | Diols molar ratio | Mn (g mol−1) | PDI | Tg (°C) | Tm (°C) | Appearancec | |
|---|---|---|---|---|---|---|---|---|---|
| In feed | In copolymerb | ||||||||
| a Polycondensation temperature: 140 °C.b Determined by 1H NMR.c Appearance at room temperature.d ND: no detect.e Polycondensation temperature: 150 °C. | |||||||||
| 1 | PBC–OH | C4 | 100![[thin space (1/6-em)]](https://www.rsc.org/images/entities/char_2009.gif) : :![[thin space (1/6-em)]](https://www.rsc.org/images/entities/char_2009.gif) 0 0 |
100![[thin space (1/6-em)]](https://www.rsc.org/images/entities/char_2009.gif) : :![[thin space (1/6-em)]](https://www.rsc.org/images/entities/char_2009.gif) 0 0 |
1600 | 1.60 | −46.7 | 60.9 | Wax |
| 2 | PHC–OH | C6 | 100![[thin space (1/6-em)]](https://www.rsc.org/images/entities/char_2009.gif) : :![[thin space (1/6-em)]](https://www.rsc.org/images/entities/char_2009.gif) 0 0 |
100![[thin space (1/6-em)]](https://www.rsc.org/images/entities/char_2009.gif) : :![[thin space (1/6-em)]](https://www.rsc.org/images/entities/char_2009.gif) 0 0 |
1900 | 1.67 | 6.71 | 46.5 | Wax |
| 3 | PBHC–OH10 | C4 + C6 | 9![[thin space (1/6-em)]](https://www.rsc.org/images/entities/char_2009.gif) : :![[thin space (1/6-em)]](https://www.rsc.org/images/entities/char_2009.gif) 1 1 |
87![[thin space (1/6-em)]](https://www.rsc.org/images/entities/char_2009.gif) : :![[thin space (1/6-em)]](https://www.rsc.org/images/entities/char_2009.gif) 13 13 |
1800 | 1.63 | −48.8 | 45.9 | Wax |
| 4 | PBHC–OH20 | C4 + C6 | 8![[thin space (1/6-em)]](https://www.rsc.org/images/entities/char_2009.gif) : :![[thin space (1/6-em)]](https://www.rsc.org/images/entities/char_2009.gif) 2 2 |
76![[thin space (1/6-em)]](https://www.rsc.org/images/entities/char_2009.gif) : :![[thin space (1/6-em)]](https://www.rsc.org/images/entities/char_2009.gif) 24 24 |
1800 | 1.56 | −50.7 | NDd | Clear oil |
| 5 | PBHC–OH30 | C4 + C6 | 7![[thin space (1/6-em)]](https://www.rsc.org/images/entities/char_2009.gif) : :![[thin space (1/6-em)]](https://www.rsc.org/images/entities/char_2009.gif) 3 3 |
65![[thin space (1/6-em)]](https://www.rsc.org/images/entities/char_2009.gif) : :![[thin space (1/6-em)]](https://www.rsc.org/images/entities/char_2009.gif) 35 35 |
1740 | 1.58 | −51.7 | ND | Clear oil |
| 6 | PBHC–OH40 | C4 + C6 | 6![[thin space (1/6-em)]](https://www.rsc.org/images/entities/char_2009.gif) : :![[thin space (1/6-em)]](https://www.rsc.org/images/entities/char_2009.gif) 4 4 |
54![[thin space (1/6-em)]](https://www.rsc.org/images/entities/char_2009.gif) : :![[thin space (1/6-em)]](https://www.rsc.org/images/entities/char_2009.gif) 46 46 |
1790 | 1.51 | −53.1 | ND | Clear oil |
| 7 | PBHC–OH50 | C4 + C6 | 5![[thin space (1/6-em)]](https://www.rsc.org/images/entities/char_2009.gif) : :![[thin space (1/6-em)]](https://www.rsc.org/images/entities/char_2009.gif) 5 5 |
48![[thin space (1/6-em)]](https://www.rsc.org/images/entities/char_2009.gif) : :![[thin space (1/6-em)]](https://www.rsc.org/images/entities/char_2009.gif) 52 52 |
1820 | 1.62 | −54.3 | ND | Clear oil |
| 8 | PBHC–OH50e | C4 + C6 | 5![[thin space (1/6-em)]](https://www.rsc.org/images/entities/char_2009.gif) : :![[thin space (1/6-em)]](https://www.rsc.org/images/entities/char_2009.gif) 5 5 |
49![[thin space (1/6-em)]](https://www.rsc.org/images/entities/char_2009.gif) : :![[thin space (1/6-em)]](https://www.rsc.org/images/entities/char_2009.gif) 51 51 |
3200 | 1.68 | −43.4 | ND | Clear oil |
| 9 | PBCC–OH50 | C4 + CHDM | 5![[thin space (1/6-em)]](https://www.rsc.org/images/entities/char_2009.gif) : :![[thin space (1/6-em)]](https://www.rsc.org/images/entities/char_2009.gif) 5 5 |
46![[thin space (1/6-em)]](https://www.rsc.org/images/entities/char_2009.gif) : :![[thin space (1/6-em)]](https://www.rsc.org/images/entities/char_2009.gif) 54 54 |
3500 | 1.62 | −20.6 | ND | Clear oil |
The thermal properties of the copolycarbonate diols were evaluated by DSC test. The second DSC heating traces are illustrated in Fig. S1 of ESI.† The detailed data, including melting temperature (Tm), and glass transition temperature (Tg) are listed in Table 4. We can find that the thermal properties of copolycarbonate diols was influenced by its average segment lengths, Mn, and copolymer composition structure. As shown in Table 4, the neat PBC–OH and PHC–OH (entries 1 and 2) are crystallizable, giving Tm temperatures of 60.9 °C and 46.5 °C, respectively. Whereas, the values of Tm for PBHC–OH samples (entries 3–7) are found to decrease with the increase of HD comonomer composition. Tm for PBHC–OH20, PBHC–OH30, PBHC–OH40 and PBHC–OH50 copolymer could not be found. It indicates that the copolycarbonate diols with a HD unit content ranging from 24 mol% to 52 mol% are completely amorphous. This is mainly because the skinny amount of HD breaks the law of backbone, resulting in significantly reducing the crystallinity of PBHC–OH20, PBHC–OH30, PBHC–OH40 and PBHC–OH50. A similar explanation can also be found in a relevant paper.44 Furthermore, we found that the Tg values increased with the increase of molecular weight (entries 7 and 8). This phenomenon is mainly because a large number of chain ends disrupt the order in their environment and increase free volume.45 Finally, the Tg values are also influenced by copolymer composition structure. As shown, Tg value for PBCC–OH50 (entry 9) is much higher than that for PBHC–OH50 (entry 8). This is attributed to the strengthening rigidity of copolymers chains caused by CHDM units owing to the poorer rotation of the cyclohexane segment in comparison to HD unit.46
Compared with the results of copolycarbonate diols in literature,1 the copolycarbonate diols we synthesized have narrow polydispersity index (PDI < 1.70). The Mn of the copolycarbonate diols can be adjust by regulating the polycondensation temperature. Furthermore, expect the sample of PBHC–OH10, the copolycarbonate diols in this work were clear oil at room temperature, which are more interested for the industrial community.
3.7 Characterization of the polycarbonate diols
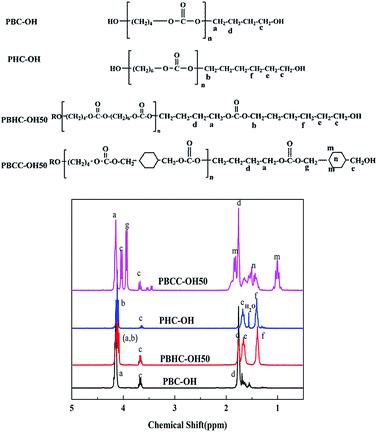
Fig. 11 shows the 1H-NMR spectra of synthesized polycarbonate diols. For the spectrum PBHC–OH50, the peak sites in PBHC–OH50 are almost identical to those of PBC–OH and PHC–OH. The multiple peaks appearing at 4.10–4.16 ppm correspond to the –OCH2 protons (a and b protons) of BD units and HD units; the peak of c proton can be found at 3.68 ppm; the peak around 1.71 ppm is assigned to d proton from BD units; and the peaks around 1.68 and 1.40 ppm are attributed to e and f protons of HD units, respectively.44For the spectrum of PBCC–OH50, except for the peaks assigned to BD units (a and d protons), the peak appearing at 3.94 ppm corresponds to the g proton of CHDM units; the peaks at around 3.68 ppm and 4.02 ppm are due to the terminal –CH2 connected to –OH group; the peaks at 1.83 and 1.04 ppm are attributed to n and m protons from CHDM unit. In addition, the peaks round 1.65 ppm are attributed to –CH of CC unit (n proton).43,46 In summary, the 1H signs are well-founded assigned to the protons at different positions. Moreover, there are no signals detected at 3.78 ppm, implying the absence of methyl carbonate end groups.
4 Conclusions
In the transesterification of DMC and diols, KNO3/Al2O3 is proved to be an efficient heterogeneous catalyst and displays a remarkable activity and a good stability. The catalytic performance of KNO3/Al2O3 catalyst depends on the basic sites amount and strength. The KNO3/Al2O3 catalyst with the loading amount of 35 wt% of KNO3 exhibits the highest catalytic activity and stability. With a fresh KNO3/Al2O3 catalyst, a maximum BD conversion of 80.2% and PBC–OH yield of 68.4% can be reached under the studied reaction conditions. In addition, KNO3/Al2O3 exhibited a good catalytic activity towards the transesterification of DMC and two different diols into copolycarbonate diols, which is of great interest in the synthesis of novel polycarbonate polyurethane. In conclusion, KNO3/Al2O3 is a cost-effective catalyst and can be easily recovered and reused. Therefore, it is a promising heterogeneous catalyst for the synthesis of polycarbonate diols from DMC and diols.Conflicts of interest
There are no conflicts to declare.Acknowledgements
This work is financially supported by the National Key R&D Program of China (2018YFB0605804) and the Science &Technology Pillar Program in Sichuan Province (2016GZ0228).References
- J. Y. Jeon, E. Y. Hwang, S. C. Eo and B. Y. Lee, J. Polym. Sci., Part A: Polym. Chem., 2014, 52, 1570–1580 CrossRef CAS.
- H. Singh and A. K. Jain, J. Appl. Polym. Sci., 2009, 111, 1115–1143 CrossRef CAS.
- V. Garcia-Pacios, V. Costa, M. Colera and J. M. Martin-Martinez, Int. J. Adhes. Adhes., 2010, 30, 456–465 CrossRef CAS.
- V. Garcia-Pacios, M. Colera, Y. Iwata and J. Miguel Martin-Martinez, Prog. Org. Coat., 2013, 76, 1726–1729 CrossRef CAS.
- M. Serkis, R. Poreba, J. Hodan, J. Kredatusova and M. Spirkova, J. Appl. Polym. Sci., 2015, 132, 42672–42686 CrossRef.
- J. T. Guo, M. H. Zhao, Y. Ti and B. Wang, J. Mater. Sci., 2007, 42, 5508–5515 CrossRef CAS.
- Y. S. Qin, X. F. Sheng, S. J. Liu, G. J. Ren, X. H. Wang and F. S. Wang, J. CO2 Util., 2015, 11, 3–9 CrossRef CAS.
- Y. Liu, W. M. Ren, W. P. Zhang, R. R. Zhao and X. B. Lu, Nat. Commun., 2015, 6, 1–8 Search PubMed.
- Y. Liu, W. M. Ren, K. K. He, W. Z. Zhang, W. B. Li, M. Wang and X. B. Lu, J. Org. Chem., 2016, 81, 8959–8966 CrossRef CAS PubMed.
- R. Srivastava, D. Srinivas and P. Ratnasamy, Catal. Lett., 2003, 91, 133–139 CrossRef CAS.
- J. Zhang, W. X. Zhu, C. C. Li, D. Zhang, Y. N. Xiao, G. H. Guan and L. C. Zheng, RSC Adv., 2015, 5, 2213–2222 RSC.
- P. Pawlowski and G. Rokicki, Polymer, 2004, 45, 3125–3137 CrossRef CAS.
- Z. Q. Wang, X. G. Yang, S. Y. Liu, H. Zhang and G. Y. Wang, Chem. Res. Chin. Univ., 2016, 32, 512–518 CrossRef CAS.
- Z. Q. Wang, X. G. Yang, S. Y. Liu, J. Hu, H. Zhang and G. Y. Wang, RSC Adv., 2015, 5, 87311–87319 RSC.
- J. H. Park, J. Y. Jeon, J. J. Lee, Y. Jang, J. K. Varghese and B. Y. Lee, Macromolecules, 2013, 46, 3301–3308 CrossRef CAS.
- Y. S. Eo, H. W. Rhee and S. Shin, J. Ind. Eng. Chem., 2016, 37, 42–46 CrossRef CAS.
- Y. L. Wang, L. J. Yang, X. H. Peng and Z. J. Jin, RSC Adv., 2017, 7, 35181–35190 RSC.
- Y. X. Feng, N. Yin, Q. F. Li, J. W. Wang, M. Q. Kang and X. K. Wang, Catal. Lett., 2008, 121, 97–102 CrossRef CAS.
- Y. X. Feng, N. Yin, Q. F. Li, J. W. Wang, M. Q. Kang and X. K. Wang, Ind. Eng. Chem. Res., 2008, 47, 2140–2145 CrossRef CAS.
- M. Tetsuo and U. Eizaburo, EP Pat. 2213696A1, 2009.
- S. M. Kim, S. A. Park, S. Y. Hwang, E. S. Kim, J. Jegal, C. Im, H. Jeon, D. X. Oh and J. Park, Polymers, 2017, 9, 663–679 CrossRef.
- R. X. Bai, Y. Wang, S. M. Wang, F. M. Li, T. Li and G. X. Li, Fuel Process. Technol., 2013, 106, 209–214 CrossRef CAS.
- A. Islam, Y. H. Taufiq-Yap, C. M. Chu, P. Ravindra and E. S. Chan, Renewable Energy, 2013, 59, 23–29 CrossRef CAS.
- W. L. Xie, H. Peng and L. G. Chen, Appl. Catal., A, 2006, 300, 67–74 CrossRef CAS.
- W. L. Xie and J. Chen, J. Agric. Food Chem., 2014, 62, 10414–10421 CrossRef CAS PubMed.
- W. L. Xie and H. T. Li, J. Mol. Catal. A: Chem., 2006, 255, 1–9 CrossRef CAS.
- K. Noiroj, P. Intarapong, A. Luengnaruemitchai and S. Jai-In, Renewable Energy, 2009, 34, 1145–1150 CrossRef CAS.
- K. K. Hu, H. J. Wang, Y. H. Liu and C. Yang, J. Ind. Eng. Chem., 2015, 28, 334–343 CrossRef CAS.
- C. S. Castro, C. Ferreti, J. I. D. Cosimo and J. M. Assaf, Fuel, 2013, 103, 632–638 CrossRef CAS.
- A. P. Vyas, N. Subrahmanyam and P. A. Patel, Fuel, 2009, 88, 625–628 CrossRef CAS.
- N. Boz, N. Degirmenbasi and D. M. Kalyon, Appl. Catal., B, 2009, 89, 590–596 CrossRef CAS.
- L. C. Meher, M. G. Kulkarni, A. K. Dalai and S. N. Naik, Eur. J. Lipid Sci. Technol., 2006, 108, 389–397 CrossRef CAS.
- H. B. Ma, S. F. Li, B. Y. Wang, R. H. Wang and S. J. Tian, J. Am. Oil Chem. Soc., 2008, 85, 263–270 CrossRef CAS.
- L. L. Xu, H. L. Song and L. J. Chou, Appl. Catal., B, 2011, 108, 177–190 CrossRef.
- Z. M. Liu, J. W. Wang, M. Q. Kang, N. Yin, X. K. Wang, Y. S. Tan and Y. L. Zhu, J. Ind. Eng. Chem., 2015, 21, 394–399 CrossRef CAS.
- Y. H. Taufiq-Yap, H. V. Lee, R. Yunus and J. C. Juan, Chem. Eng. J., 2011, 178, 342–347 CrossRef CAS.
- Z. Z. Jiang, C. Liu, W. C. Xie and R. A. Gross, Macromolecules, 2007, 40, 7934–7943 CrossRef CAS.
- Z. Q. Wang, X. G. Yang, J. G. Li, S. Y. Liu and G. Y. Wang, J. Mol. Catal. A: Chem., 2016, 424, 77–84 CrossRef CAS.
- W. X. Zhu, X. Huang, C. C. Li, Y. N. Xiao, D. Zhang and G. H. Guan, Polym. Int., 2011, 60, 1060–1067 CrossRef CAS.
- Z. Z. Jiang, C. Liu and R. A. Gross, Macromolecules, 2008, 41, 4671–4680 CrossRef CAS.
- M. L. Song, X. G. Yang and G. Y. Wang, Chem. Res. Chin. Univ., 2018, 34, 1–6 CrossRef.
- J. J. Sun and D. Kuckling, Polym. Chem., 2016, 7, 1642–1649 RSC.
- X. D. Cai, X. G. Yang and G. Y. Wang, Polymer, 2017, 110, 87–94 CrossRef CAS.
- W. X. Zhu, W. Zhou, C. C. Li, Y. N. Xiao, D. Zhang, G. H. Guan and D. Wang, J. Macromol. Sci., Part A: Pure Appl.Chem., 2011, 48, 583–594 CrossRef CAS.
- P. U. Naik, K. Refes, F. Sadaka, C. H. Brachais, G. Boni, J.-P. Couvercelle, M. Picquet and L. Plasseraud, Polym. Chem., 2012, 3, 1475–1480 RSC.
- T. T. Chen, G. D. Jiang, G. Y. Li, Z. P. Wu and J. Zhang, RSC Adv., 2015, 5, 60570–60580 RSC.
Footnote |
| † Electronic supplementary information (ESI) available. See DOI: 10.1039/c8ra07141a |
| This journal is © The Royal Society of Chemistry 2018 |

