DOI:
10.1039/C8RA07711H
(Paper)
RSC Adv., 2018,
8, 35005-35013
High-sensitivity refractive index of Au@Cu2−xS core–shell nanorods
Received
17th September 2018
, Accepted 8th October 2018
First published on 12th October 2018
Abstract
A high refractive index sensitivity of Au@Cu2−xS core–shell nanorods working in the near-infrared is theoretically demonstrated. The sensitivity of our sensor reaches 1200 nm per Refractive Index Unit (RIU), which is higher than that of other metal–metal core–shell nanorods. The reason is that the new materials and structure of Au@Cu2−xS core–shell nanorods lead to a unique sensing principle. It is noteworthy that the refractive index (RI) sensitivity is more susceptible to the effects of the shell-thickness to core-radius ratio than to the aspect ratio. These results show that the excellent sensitivity performance of Au@Cu2−xS core–shell nanorods working in the near-infrared can be treated as a new tool to detect the minute variations in refractive index for small amounts of chemicals and biomolecules.
1. Introduction
Surface plasmon resonance (SPR) is formally defined as a collective oscillation of the electrons under incident electromagnetic radiation at the metal and dielectric interface.1,2 The medium boundaries in particular nanostructures restrict the propagation characteristics of the SPR leading to localization of the phenomenon which is called localized surface plasmon resonance (LSPR).2 Noble metal3 and semiconductor nanoparticles4 (NPs) have received considerable interest for their unique and adjustable LSPR.5–7 Compared to noble metals bulk nanostructures (such as metallic nanoslits8), LSPR of nanoparticles is more sensitive and responsive to the variations of the surrounding medium refractive index (RI), having good potential in sensing applications, including protein interactions,9 biological sensing10 and inorganic ion sensing.11
In terms of improving the RI sensitivity, LSPR sensor is strongly influenced by the size,12 shape13 and material of the nanostructure.14 Compared with the nanospheres, gold nanorods (NRs) show a higher RI sensitivity, reaching 366 nm/Refractive Index Unit (RIU).15 Further, Zhu et al.16 has presented that the RI sensitivity of molecular sensors based on single gold nanorod light scattering can be improved by using gold core–shell nanorod coated by silver nanoshell instead of gold nanospheres, which is also found in gold nanoshells.17,18 The reason is that the resonance wavelengths of nanorod and nanoshells become longer, leading to reduce restoring force from the positive metal cations and the negative electrons. According to ref. 19, the decreasing restoring force can improve the RI sensitivity. That is to say, RI sensitivity can be enhanced by utilizing longer plasmon wavelengths, leading to widen nanoparticle sensors' applications. Unfortunately, the resonance wavelength of the metallic nanostructure can be excited in visible region, which cause that these metal nanorods can't work under the entire near-infrared region.20 Based on our present research, we found that the semiconductor shell (Cu2−xS) is important for expanding resonance wavelength, and the RI sensitivity is greatly improved by using metal–semiconductor core–shell nanoparticles (CSNPs).21 But the RI sensitivity can be further improved by using metal–semiconductor core–shell nanorods (CSNRs). Nevertheless, the plasmon wavelengths shift and RI sensitivity behaviors of metal–semiconductor CSNRs have not yet attracted sufficient attention.
This paper studies theoretically the metal–semiconductor CSNRs plasmon wavelengths shift as a sensor to detect the refractive index changes surrounding the semiconductor shell. For example, we use the optical absorption spectrum and electric charge distribution of Au@Cu2−xS CSNRs to investigate this kind metal–semiconductor CSNRs plasmons wavelength shift under near-infrared region. There are two reasons to design metal–semiconductor CSNRs. Firstly, in order to effectively shift the resonance wavelength to near-infrared region, the semiconductor nanoshell (Cu2−xS) is chosen because its LSPR wavelength can be adjusted with controlling the concentration of the carrier.22 Secondly, LSPRs of semiconductor shell and metal core can be excited in near-infrared region and visible light, respectively, leading to improve the RI sensitivity.21 The sensing figure of merit (FoM) of CSNRs is studied to find that Au@Cu2−xS CSNRs has the better sensing performance comparing with the Au@Ag CSNRs. Previous studies only discussed the effect of aspect ratio on the CSNRs sensitivity. In this article, however, by analyzing the charge distribution of Au@Cu2−xS CSNRs, we find that the RI sensitivity is greater influenced by the shell-thickness to core-radius ratio (STCRR) than that of the aspect ratio. It indicates that the higher RI sensitivity of Au@Cu2−xS CSNRs can be obtained by only increasing shell-thickness to core-radius rather than the aspect ratio. This RI sensitivity enhancement behavior of Au@Cu2−xS CSNRs is different from that of Au@Cu2−xS CSNPs21 and other CSNRs,23,24 which is a special phenomenon of Au@Cu2−xS CSNRs sensing. This is important for a tool to detect the refractive index minute variations for chemicals and biomolecules.
2. Methods
The Au@Cu2−xS CSNRs is comprised of Au core and Cu2−xS shell. The Au core is composed by the Au nano-cylinder and two Au nano-hemispheres. The cross-section schematic diagram of Au@Cu2−xS CSNRs is drawn in Fig. 1a; the Au core is shown in the golden part, and the Cu2−xS shell is the blue part. COMSOL Multiphysics software is utilized to calculate absorption spectrum and electromagnetic field distribution of the Au@Cu2−xS CSNRs. The optical constants of Au core are obtained by using the experimental data interpolation method.25 The optical constants of Cu2−xS can be calculated by using Drude's model.22
 |
| | Fig. 1 (a) The schematic cross-section diagram of the Au@Cu2−xS CSNRs. Δr is the thickness of the Cu2−xS shell; r1 is the radius of the Au nano-hemisphere; r is the radius of the Au@Cu2−xS nano-hemisphere (r = Δr + r1); L is the length of the Au nano-cylinder; W is the width of the Au@Cu2−xS CSNRs (W = 2r). The aspect ratio (R) is equal to (2r + L)/W. (b) The absorption spectrum of the Au@Cu2−xS CSNRs (r = 40 nm, L = 100 nm), Au and Cu2−xS nanoparticle (r = 40 nm), respectively. | |
Fig. 1b exhibits the absorption spectra of the Au@Cu2−xS CSNRs, Au and Cu2−xS nanoparticle, respectively. The surrounding medium refractive index is equal to 1.2. For pure Au and Cu2−xS nanorods, there are two LSPR absorption peaks corresponding to transverse and longitudinal resonance.26 However, in the absorption spectrum of the Au@Cu2−xS CSNRs, four resonant peaks are observed for the coating Cu2−xS shell, which is same as Au@Ag CSNRs27 and can be explained by plasmon hybridization theory.28 The Peak 1 and Peak 2 correspond to the transverse and longitudinal plasmon from Au@Cu2−xS interface. The Peak 3 corresponds to the longitudinal plasmon from outer Au surface and the Peak 4 corresponds to the transverse plasmon from outer Au surface, which can be exhibited at the top right illustration of Fig. 1b. Because the RI sensitivity of Au@Cu2−xS CSNRs at a near-infrared band is our study subject, the resonant Peak 1 will be researched.
3. Results and discussion
To study the effect of the aspect ratios on the LSPR property of Au@Cu2−xS CSNRs, we calculate the extinction spectra of Au@Cu2−xS CSNs with varied length and radius, as shown in Fig. 2. The aspect ratio (R) of Au@Cu2−xS CSNRs is defined as:| |
 | (1) |
where the Δr/r1 is the STCRR of Au@Cu2−xS CSNRs. From Fig. 2, the resonance wavelength can be red shifted by increasing the RI and R. Next, the LSPR shifts of Au@Cu2−xS CSNRs with different aspect ratios are calculated. The nearly linear shift of LSPR wavelength with the change of RI under different aspect ratios is shown in Fig. 3a. When the radius of Au@Cu2−xS CSNRs is 40 nm and the length is 100 nm, the LSPR shift can be close to 442 nm with the RI increasing from 1.0 to 1.6. When the length is systematically increased from 100 nm to 200 nm with a radius of 40 nm, apparently, the LSPR shift can be greatly increased (621 nm). Correspondingly, the LSPR shift of Au@Ag CSNRs also show the same trend (see Fig. 3b). But it's worth noting that LSPR shift of Au@Cu2−xS CSNRs is greater than that of Au@Ag CSNRs under the same aspect ratio. Therefore, the resonance wavelength shift can be improved by the change of radius and length of CSNRs.
 |
| | Fig. 2 The extinction coefficient of the Au@Cu2−xS CSNRs with different RI and different R: (a) r = 80 nm L = 100 nm, (b) r = 40 nm L = 100 nm, (c) r = 40 nm L = 200 nm. | |
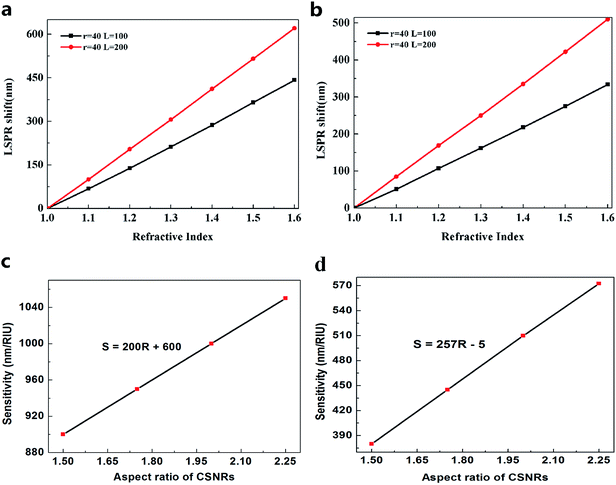 |
| | Fig. 3 LSPR shift of (a) Au@Cu2−xS CSNRs, (b) Au@Ag CSNRs and RI sensitivity of (c) Au@Cu2−xS CSNRs, (d) Au@Ag CSNRs with different aspect ratio. | |
Considering RI sensitivity can be usually described as a variation of LSPR wavelength per RIU, the influence factors of Au@Cu2−xS CSNRs' LSPR wavelength shift must be studied. In Fig. 3a, clearly, the resonance wavelength of Au@Cu2−xS CSNRs can be adjusted by changing length and radius. To study the effect of length (L) and radius (r) systematically, we set width (W) equaling to 2-fold radius. Fig. 3c shows the sensitivity of Au@Cu2−xS CSNRs with different aspect ratio. As shown in Fig. 3b, RI sensitivity approaches 1050 nm per RIU when the aspect ratio is equal to 2.25. In the same aspect ratio, however, the RI sensitivity of Au@Ag CSNRs is the 570 nm per RIU (see Fig. 3d), which is much less than that of Au@Cu2−xS CSNRs. We can confirm this by comparing the RI sensitivity of Au@Cu2−xS CSNRs and Au@Ag CSNRs under the same geometric parameters29 as shown in Table 1. In addition, the results show that RI sensitivity of Au@Cu2−xS CSNRs increases linearly with enlarging aspect ratio (R),30,31
| | |
ΔλLSPR/Δn ≈ 200R + 600 (nm/RIU)
| (2) |
Table 1 The sensitivity of nanorods with the increase of R
| |
L (nm) |
r1 (nm) |
Δr (nm)4 |
STCRR |
R |
LSPRsn=1 (nm) |
LSPRsn=1.2 (nm) |
Sensitivity (nm/RIU) |
| Au@Cu2−xS |
36 |
9 |
9 |
1 |
2 |
1205 |
1375 |
850 |
| 54 |
4.5 |
4.5 |
1 |
4 |
1325 |
1535 |
1050 |
| Au@Ag29 |
36 |
9 |
9 |
1 |
2 |
460 |
520 |
300 |
| 54 |
4.5 |
4.5 |
1 |
4 |
605 |
700 |
475 |
As we known, the collective oscillation motion of metal's free electrons can excite LSPR. In this process, the named restoring force is caused by the coulombic attraction between the positive metal cations and the negative electrons.19 When a nanorod has larger aspect ratio, the coulombic attraction between the positive metal cations and the negative electrons can be weakened, which means the restoring force decrease. The result is that the plasmon energy is lower and the LSPR shift is larger, leading to improving refractive index sensitivity. However, although the sensitivities of the Au@Ag and Au@Cu2−xS CSNRs rise when the aspect ratio increases, the sensitivity of Au@Cu2−xS is far more than that of the Au@Ag CSNRs. The reason is that LSPR shift of Au@Cu2−xS CSNRs is larger than that of Au@Ag CSNRs. We observed that the increase in sensitivity of Au@Cu2−xS CSNRs is linearly correlated with increased aspect ratio regarding eqn (2). But from Fig. 2 we can find that the extinction spectrum continuously decreases by increasing the aspect ratio, which is difficult to be detected in practical application. The reason is that the large magnitude of the imaginary dielectric function of metal plays a negative role on an excitation of plasmonic resonance.32 Therefore, the length of Au core is grown as the increase of aspect ratio, leading to decrease extinction spectrum.
For the core–shell nanoparticles, the shell thicknesses also have the important effect on the LSPR shift.21,33,34 To avoid the impact of aspect ratio of CSNRs, the aspect ratio is fixed to 1.6. To study the effect of the core radii and shell thicknesses on the LSPR property of Au@Cu2−xS CSNRs, we calculate the extinction spectra of Au@Cu2−xS CSNs with varied the core radii r1 and the shell thicknesses Δr, as shown in Fig. 4. The resonance wavelength can be red shifted by increasing the RI and the core radii r1 and the shell thicknesses as shown in Fig. 4. Fig. 5a and b show the LSPR shift with varying refractive index when the core radii r1 and the shell thicknesses Δr are changed. It is clearly seen that the LSPR wavelength is nearly linear shift with changing RI under different core radii and shell thicknesses. In Fig. 5a, for Au@Cu2−xS CSNRs with 40 nm radius and 10 nm shell thickness, the LSPR shift may approximately reach 450 nm when the RI increases from 1.0 to 1.6. As the shell thickness rises from 10 nm to 20 nm, it is observed that the LSPR shift can be increased greatly, which can reach 620 nm. Correspondingly, the LSPR shift of Au@Ag CSNRs is slight when the shell thickness is in the same changes (as seen Fig. 5b). Therefore, the resonance wavelength shift of Au@Cu2−xS CSNRs can be susceptible to the variation of shell thickness-to-core radius ratio (STCRR, RSTCRR = Δr/r1), which leads to affect RI sensitivity. Fig. 5c shows that the sensitivity of Au@Cu2−xS CSNRs can be improved when the STCRR increases. As shown in Fig. 3c, the sensitivity approximately reaches 1200 nm per RIU when the STCRR is equal to 3. Our calculations show that RI sensitivity can be improved by enlarging STCRR, which is much more than that of Au@Ag CSNRs (as seen Fig. 5d). But it seems that sensitivity of CSNRs saturates when Δr is triple r1 + L/2. The reason is that if the shell thickness is increased, due to the growth properties of the core–shell nanorods, the shape of the nanorods evolves from rod-like to near-spherical. As we know, spherical nanoparticles exhibit the poorest sensitivities. Based on our early work,21 the sensitivity of Au@Cu2−xS core–shell nanoparticles saturates when the ratio of the shell-thickness to core-radius is close to 3. Furthermore, the performance of the sensor can be usually measured by the figure of merit (FoM).35–37 The sensing FoM is calculated as:
| |
 | (3) |
where the
S represent the RI sensitivity, the FWHM represent the full width half maxima of the absorption spectrum of Au@Cu
2−xS CSNRs.
Fig. 5e and f show that the FoM of Au@Cu
2−xS and Au@Ag CSNRs can be improved with increscent STCRR. Most impressive, the FoM of Au@Cu
2−xS CSNRs is greater than that of Au@Ag CSNRs, which demonstrated that the LSPRs sensor of Au@Cu
2−xS CSNRs has the better performance comparing with the Au@Ag CSNRs. We can confirm this by comparing the RI sensitivity of Au@Cu
2−xS CSNRs and Au@Ag CSNRs under the same geometric parameters
33 as shown in
Table 2.
 |
| | Fig. 4 The extinction coefficient of the Au@Cu2−xS CSNRs with different RI and different core radii and shell thicknesses: (a) r = 30 nm Δr = 10 nm, (b) r = 40 nm Δr = 20 nm, (c) r = 40 nm Δr = 10 nm. | |
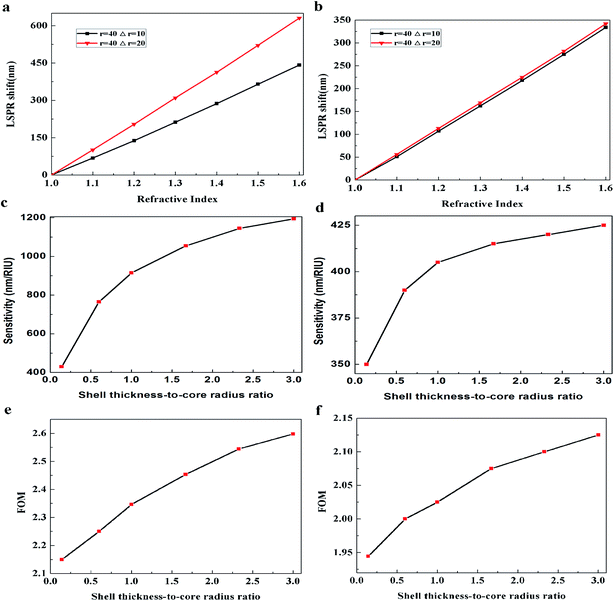 |
| | Fig. 5 The LSPR shift of (a) Au@Cu2−xS CSNRs, (b) Au@Ag CSNRs and RI sensitivity of (c) Au@Cu2−xS CSNRs, (d) Au@Ag CSNRs with different STCRR, and the FoM of (e) Au@Cu2−xS CSNRs and (f) Au@Ag CSNRs with different STCRR. | |
Table 2 The sensitivity of nanorods with the increase of STCRR
| |
L (nm) |
r1 (nm) |
Δr (nm) |
STCRR |
R |
LSPRs n=1.33 (nm) |
LSPRs n=1.42 (nm) |
Sensitivity (nm/RIU) |
| Au@Cu2−xS |
60 |
10 |
5 |
0.5 |
3 |
1280 |
1345 |
722 |
| 80 |
10 |
10 |
1 |
3 |
1610 |
1700 |
1000 |
| Au@Ag33 |
60 |
10 |
5 |
0.5 |
3 |
700 |
740 |
440 |
| 80 |
10 |
10 |
1 |
3 |
735 |
785 |
550 |
Next, the electric charge distribution and the local electric field pattern of Au@Cu2−xS CSNRs are calculated to find out the reason of the adjustable sensitivity under the different shell thickness. We assume the RI of sensing medium is equal to 1.6. As seen in Fig. 6a and b, the LSPR is derived from the like charges oscillations between the inner and outer shell surfaces of Au@Cu2−xS CSNRs. In this collective oscillation behavior, the restoring force is caused by the coulombic attraction19 between heterocharges at the both ends of Au@Cu2−xS CSNRs. However, due to the like charges oscillate between the outer and inner surfaces of Au@Cu2−xS CSNR shell, there is a repulsive force between the inner and outer surfaces shell, leading to reducing the restoring force and increasing the RI sensitivity. The optical properties of the semiconductor can be tuned by controlling the carrier concentration,22,38,39 which can effectively influence on LSPR behavior. Therefore, as shown in Fig. 7, the oscillatory behavior of electric charge between inner and outer surfaces of Au@Cu2−xS CSNR shell becomes more intense when the shell thickness increases,40 leading to the enhancement in repulsive force. This is the reason that RI sensitivity of Au@Cu2−xS CSNR can be improved by increasing shell thickness. It is also can be found in Au@Ag CSNRs (as shown in Fig. 8).
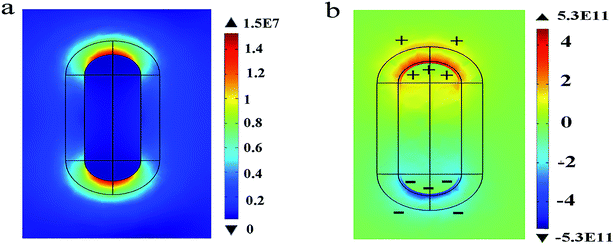 |
| | Fig. 6 The electric field (a) and electric charge distribution (b) of the Au@Cu2−xS CSNRs when Δr is 10 nm, r is 20 nm, L is 100 nm, when the resonance wavelength is 1379 nm. | |
 |
| | Fig. 7 The normalized electric charge distributions of the Au@Cu2−xS CSNRs when Δr is 10 nm (a), Δr is 20 nm (b) and Δr is 30 nm (c). | |
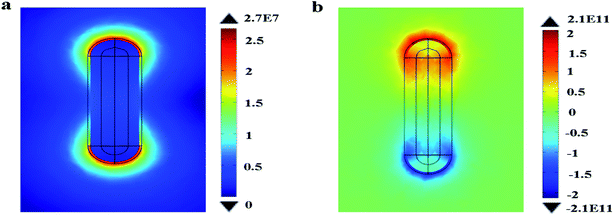 |
| | Fig. 8 Local electric field (a) and electric charge distribution (b) of the Au@Ag CSNRs with Δr = 10 nm, r1 = 20 nm, when the resonance wavelength is 366 nm. | |
However, although the sensitivities of the Au@Ag and Au@Cu2−xS CSNRs rise with the increase of the STCRR, the sensitivity of Au@Ag is far smaller than that of the Au@Cu2−xS CSNRs. Comparing the electric charge distribution of Au@Cu2−xS and Au@Ag CSNRs, we can find that quantity of electric charges of Au@Cu2−xS CSNRs is apparently higher than Au@Ag CSNRs under the same conditions. In order to find the reason, we compare the dielectric constant imaginary portion of the Au@Ag with that of Au@Cu2−xS CSNRs at their resonance wavelengths, as shown in Fig. 9. As we know, the dielectric constant imaginary portion represents the loss of material. The more dielectric constant imaginary portion offers the bigger loss, which decreases electric charges quantity. From Fig. 9, the LSPR of Au@Cu2−xS CSNRs can be excited at 1379 nm, and the LSPR of Au@Ag CSNRs can be excited at 366 nm, respectively. When the resonance wavelength is 366 nm, the positive imaginary portion of the Au@Ag CSNRs approximates 0.53. Corresponding, when the resonance wavelength is 1379 nm, the positive imaginary portion of the Au@Cu2−xS CSNRs is close to 0.185. Therefore, the positive imaginary portion of the Au@Cu2−xS CSNRs is smaller than that of the Au@Ag at their resonance wavelengths, leading to the more charge and higher repulsive force, which can cause higher sensitivity.
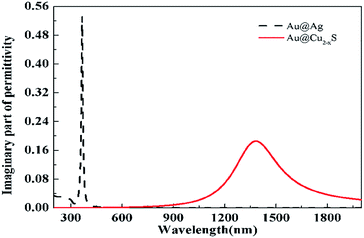 |
| | Fig. 9 The positive imaginary portion of dielectric constant of the Au@Ag and Au@Cu2−xS CSNRs. | |
The RI sensitivity of Au@Cu2−xS CSNRs can be affected by both of the aspect ratio and the STCRR. The next step is to find the main influence factor on the RI sensitivity of Au@Cu2−xS CSNRs between the aspect ratio and the STCRR. The term “STCRR” has been defined in eqn (1).
The variation of STCRR can change the aspect ratio of Au@Cu2−xS CSNRs when L is constant. It is obvious that in this case the interaction between the aspect ratio and STCRR can affect the RI sensitivity of Au@Cu2−xS CSNRs. When the shell thickness Δr and core-radius r1 are changed, respectively, the change of RI sensitivity is calculated, as shown in Fig. 10a and b. The length is constant, which is equal to 100 nm. In Fig. 10a, the r1 decreases from 30 nm to 10 nm when the Δr is 20 nm, making the STCRR increase from 0.6 to 2.0. According to the eqn (1), the reduction of the r1 will result in an increase in the aspect ratio of Au@Cu2−xS CSNRs from 2 to 2.6. It is obvious that the RI sensitivity of Au@Cu2−xS CSNRs shows an increasing trend with the increase of the aspect ratio and STCRR. In Fig. 10b, as the r1 is 20 nm, the Δr increases from 10 nm to 30 nm, making the STCRR to increase from 0.5 to 1.5. According to the eqn (1), the increase of the Δr causes the decrease of aspect ratio of the Au@Cu2−xS CSNRs from 2.6 to 2. From the above, we know that the reduction of the aspect ratio of Au@Cu2−xS CSNRs can lead to a decrease in the RI sensitivity as shown in Fig. 3. However, in Fig. 10b, it is obviously observed that the RI sensitivity of Au@Cu2−xS CSNRs still greatly increases with the increase of STCRR when the aspect ratio reduces at the same time. It shows that comparing with the aspect ratio, the RI sensitivity of Au@Cu2−xS CSNRs is more susceptible to the effects of the STCRR. The RI sensitivity of Au@Ag CSNRs, by contrast, slightly increases under the same conditions (as shown in Fig. 11), but it is obviously smaller than that of Au@Cu2−xS CSNRs. It means that RI sensitivity of Au@Ag CSNRs can be improved when the silver shell is certain thickness, instead of the shell thickness continues to become thicker, which is consistent with the description of ref. 33. On the contrary, the RI sensitivity of Au@Cu2−xS CSNRs can be greatly improved by only increasing STCRR, which is a special phenomenon of Au@Cu2−xS CSNRs sensing. The results indicate that LSPR shift of Au@Cu2−xS CSNRs can be treated as a sensor to detect the refractive index small changes surrounding the CSNRs because the Au@Cu2−xS CSNRs' LSPR shift line slope is greatly more than that of Au@Ag CSNRs when STCRR is increased, which can cause drastic LSPR shift when the refractive index change slightly.
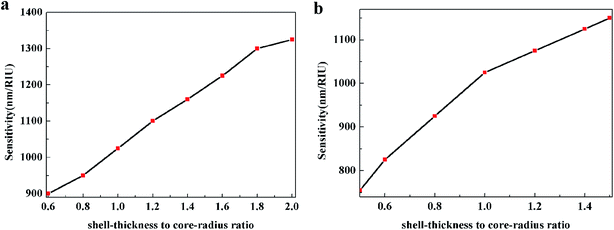 |
| | Fig. 10 The RI sensitivity of Au@Cu2−xS CSNRs with (a) Δr = 20 nm, r1 decreases from 30 nm to 10 nm, making the STCRR to increase from 0.6 to 2.0 and R to increase from 2 to 2.6, and (b) r1 = 20 nm, Δr increases from 10 nm to 30 nm, making the STCRR to increase from 0.5 to 1.5 and R to decrease from 2.6 to 2. | |
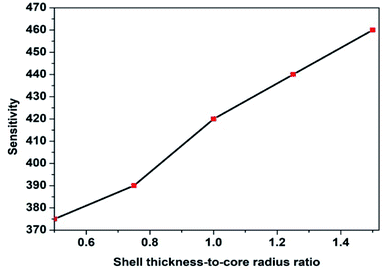 |
| | Fig. 11 The RI sensitivity of Au@Ag CSNRs with r1 = 20 nm, Δr increases from 10 nm to 30 nm, making the STCRR to increase from 0.5 to 1.5 and the R to decrease from 2.6 to 2. | |
To find out this reason, the charge distribution of Au@Cu2−xS CSNRs with different STCRR and R is calculated shown in Fig. 12 (specific parameter in Tables 3 and 4). As we systematically increase STCRR from 2 to 4 with the constant R (Fig. 12a and 2), it is observed that the charge of Au@Cu2−xS CSNRs increased by 103% (from 1.44 × 10¹¹ to 2.93 × 10¹¹). However, in Fig. 12c and d, increasing the R from 2 to 4 with the constant STCRR, we can find that the charge of Au@Cu2−xS CSNRs increased by 70% (from 1.34 × 10¹¹ to 2.28 × 10¹¹). Therefore, it is clearly that the change of STCRR of Au@Cu2−xS CSNRs can greatly improve the quantity of electric charge effectively, leading to reduce the restoring force and increase the RI sensitivity.
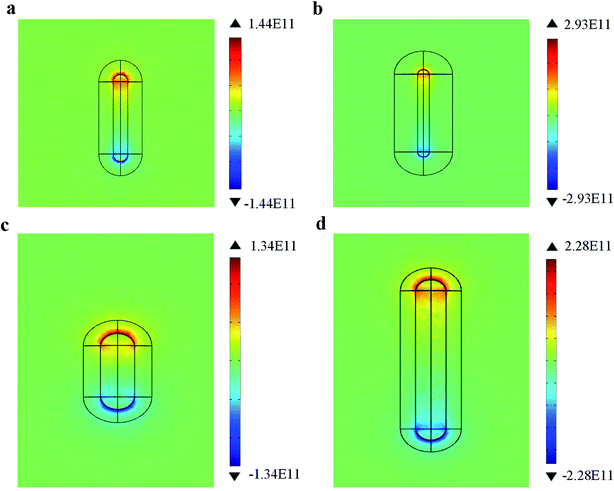 |
| | Fig. 12 The electric charge distribution of the Au@Cu2−xS CSNRs with (a) STCRR = 2, R = 2.6, (b) STCRR = 4, R = 2.6, (c) STCRR = 1, R = 2, (d) STCRR = 1, R = 4. | |
Table 3 The charge of Au@Cu2−xS with the increase of STCRR
| L |
r1 |
Δr |
STCRR |
R |
LSPRs Peak |
Charge |
| 100 nm |
10 nm |
20 nm |
2 |
2.6 |
1525 nm |
1.44 × 10¹¹ |
| 100 nm |
6 nm |
24 nm |
4 |
2.6 |
1785 nm |
2.93 × 10¹¹ |
Table 4 The charge of Au@Cu2−xS with the increase of R
| L |
r1 |
Δr |
STCRR |
R |
LSPRs Peak |
Charge |
| 100 nm |
25 nm |
25 nm |
1 |
2 |
1305 nm |
1.34 × 10¹¹ |
| 300 nm |
25 nm |
25 nm |
1 |
4 |
1720 nm |
2.28 × 10¹¹ |
4. Conclusion
In summary, the RI sensitivity of Au@Cu2−xS CSNRs is investigated by calculating the shift of LSPR in near-infrared region. The Au@Cu2−xS CSNRs show the higher sensitivity comparing with Au@Ag CSNRs. The RI sensitivity of the Au@Cu2−xS CSNRs can be improved with increasing both the aspect ratio and STCRR. Remarkably, comparing with the aspect ratio, it is found that the STCRR has a great influence on the RI sensitivity. The present work paved the road for utilizing the metal–semiconductor CSNRs as a sensing tool to detect minuteness variations of RI for small amounts of chemicals and biomolecules. Although the difficulty of preparing Au@Cu2−xS CSNRs for experiment, the theoretical results have the guidance meaning for the sensing behavior of Au@Cu2−xS CSNRs. We will discuss the preparation method of Au@Cu2−xS CSNRs in the future.
Conflicts of interest
The authors declare that they have no competing interests.
Acknowledgements
This work is supported by the National Natural Science Foundation of China (NSFC) (No. 61701207, 61205204 and 61804071), the Natural Science Foundation of Gansu Province (No. 1606RJZA068, No. 61804071 and 17JR5RA119), State Key Laboratory of Millimeter Waves of Southeast University (No. K201717), the China Scholarship Council Foundation (No. 201406185011), the Fundamental Research Funds for the Central Universities of China (lzujbky-2018-127), and the Scientific Research Foundation for the Returned Overseas Chinese Scholars.
References
- A. K. Mishra, S. K. Mishra and B. D. Gupta, Plasmonics, 2015, 10(5), 1071–1076 CrossRef CAS.
- A. K. Mishra, S. K. Mishra and R. K. Verma, Plasmonics, 2017, 12(6), 1657–1663 CrossRef CAS.
- K. M. Elnour, E. T. Salam, H. M. Soliman and A. S. Orabi, Nanoscale Res. Lett., 2017, 12(1), 231 CrossRef CAS PubMed.
- A. Boltasseva and H. A. Atwater, Science, 2011, 331, 290–291 CrossRef CAS PubMed.
- V. N. Guilengui, L. Cerutti, J. B. Rodriguez, E. Tournie and T. Taliercio, Appl. Phys. Lett., 2012, 101, 788 Search PubMed.
- G. Garcia, R. Buonsanti, E. L. Runnerstrom, R. J. Mendelsberg, A. Llordes, A. Anders, T. J. Richardson and D. J. Milliron, Nano Lett., 2011, 11(10), 4415–4420 CrossRef CAS PubMed.
- S. D'Addato, D. Pinotti, M. C. Spadaro, G. Paolicelli, V. Grillo, S. Valeri, L. Pasquali, L. Bergamini and S. Corni, Beilstein J. Nanotechnol., 2015, 6(1), 404–413 CrossRef PubMed.
- K. L. Lee, C. W. Lee, W. S. Wang and P. K. Wei, J. Biomed. Opt., 2007, 12(4), 044023 CrossRef PubMed.
- A. J. Haes and R. P. Van Duyne, J. Am. Chem. Soc., 2002, 124, 10596–10604 CrossRef CAS PubMed.
- H. Huang, C. Tang, Y. Zeng, X. Yu, B. Liao, X. Xia, P. Yi and P. K. Chu, Colloids Surf., B, 2009, 71, 96–101 CrossRef CAS PubMed.
- E. A. Terenteva, V. V. Arkhipova, V. V. Apyari, P. A. Volkov and S. G. Dmitrienko, Sens. Actuators, B, 2017, 241, 390–397 CrossRef CAS.
- D. D. Evanoff and G. Chumanov, J. Phys. Chem. B, 2004, 108, 13957–13962 CrossRef CAS.
- J. J. Mock, M. Barbic, D. R. Smith, D. A. Schultz and S. Schultz, J. Chem. Phys., 2002, 116, 6755–6759 CrossRef CAS.
- N. G. Khlebtsov, L. A. Trachuk and A. G. Mel'nikov, Opt. Spectrosc., 2005, 98(1), 77–83 CrossRef CAS.
- P. K. Jain and M. A. El-Sayed, J. Phys. Chem. C, 2007, 112(13), 4954–4960 CrossRef.
- J. Zhu, F. Zhang, J. J. Li and J. W. Zhao, Sens. Actuators, B, 2013, 183(13), 556–564 CrossRef CAS.
- Y. Sun and Y. Xia, Anal. Chem., 2002, 74(20), 5297–5305 CrossRef CAS PubMed.
- A. Steinbrück, O. Stranik, A. Csaki and W. Fritzsche, Anal. Bioanal. Chem., 2011, 401(4), 1241 CrossRef PubMed.
- J. Zhu and X. Deng, Sens. Actuators, B, 2011, 155(2), 843–847 CrossRef CAS.
- E. A. Chaffin, S. Bhana, R. T. O'Connor, X. Huang and Y. Wang, J. Phys. Chem. B, 2014, 118(49), 14076–14084 CrossRef CAS PubMed.
- H. Zhang, P. Cao, J. Dou, L. Cheng, T. Niu and G. o. Zhang, RSC Adv., 2018, 8(3), 1700–1705 RSC.
- J. M. Luther, P. K. Jain, T. Ewers and A. P. Alivisatos, Nat. Mater., 2011, 10(5), 361 CrossRef CAS PubMed.
- J. Yu, Y. Ma, C. Yang, H. Zhang, L. Liu, J. Su and Y. Gao, Sens. Actuators, B, 2018, 254, 182–188 CrossRef CAS.
- A. Yin, Q. He, Z. Lin, L. Luo, Y. Liu, S. Yang, H. Wu, M. Ding, Y. Huang and X. Duan, Angew. Chem., Int. Ed., 2016, 55(2), 583–587 CrossRef CAS PubMed.
- P. B. Johnson and R. W. Christy, Phys. Rev. B: Solid State, 1972, 6(12), 4370 CrossRef CAS.
- J. Cao, T. Sun and K. T. V. Grattan, Sens. Actuators, B, 2014, 195, 332–351 CrossRef CAS.
- J. Zhu, F. Zhang, J. J. Li and J. W. Zhao, Gold Bull., 2014, 47(1–2), 47–55 CrossRef CAS.
- E. Prodan, C. Radloff, N. J. Halas and P. Nordlander, Science, 2003, 302(5644), 419–422 CrossRef CAS PubMed.
- R. Jiang, H. Chen, L. Shao, Q. Li and J. Wang, Adv. Mater., 2012, 24(35), OP200–OP207 CAS.
- P. K. Jain, S. Eustis and M. A. El-Sayed, J. Phys. Chem. B, 2006, 110(37), 18243–18253 CrossRef CAS PubMed.
- K. Lee and M. A. El-Sayed, J. Phys. Chem. B, 2006, 110(39), 19220–19225 CrossRef CAS PubMed.
- K. S. Lee and M. A. El-Sayed, J. Phys. Chem. B, 2005, 109(43), 20331–20338 CrossRef CAS PubMed.
- Q. Fu, D. G. Zhang, M. F. Yi, X. X. Wang, Y. K. Chen, P. Wang and H. Ming, J. Opt., 2012, 14(8), 085001 CrossRef.
- X. Xu, Q. Du, B. Peng, Q. Xiong, L. Hong, H. V. Demir, T. K. S. Wong, A. K. K. Kyaw and X. W. Sun, Appl. Phys. Lett., 2014, 105(11), 148 CrossRef.
- L. J. Sherry, S. H. Chang, G. C. Schatz, R. P. Van Duyne, B. J. Wiley and Y. Xia, Nano Lett., 2005, 5(10), 2034–2038 CrossRef CAS PubMed.
- N. Verellen, P. Van Dorpe, C. Huang, K. Lodewijks, G. A. E. Vandenbosch, L. Lagae and V. V. Moshchalkov, Nano Lett., 2011, 11(2), 391–397 CrossRef CAS PubMed.
- T. Wenger, G. Viola, J. Kinaret, M. Fogelström and P. Tassin, 2D Mater., 2017, 4(2), 025103 CrossRef.
- S. Hsu, W. Bryks and A. R. Tao, Chem. Mater., 2012, 24, 3765–3771 CrossRef CAS.
- H. Matsui, S. Furuta and H. Tabata, Appl. Phys. Lett., 2014, 104, 211903 CrossRef.
- M. L. McWright, T. E. Batchman and R. F. Carson, Integrated Optical Circuit Engineering II, International Society for Optics and Photonics, 1985, vol. 578, pp. 52–58 Search PubMed.
|
| This journal is © The Royal Society of Chemistry 2018 |
Click here to see how this site uses Cookies. View our privacy policy here.  Open Access Article
 *,
Huizhen Chen,
Hailong Zhang,
Lin Cheng and
Tiaoming Niu


