
 Open Access Article
 This Open Access Article is licensed under a Creative Commons Attribution-Non Commercial 3.0 Unported Licence
Novel hard carbon/graphite composites synthesized by a facile in situ anchoring method as high-performance anodes for lithium-ion batteries†
Chuanzhang Ge *ab,
Zhenghua Fanab,
Jie Zhangab,
Yongmin Qiaoab,
Jianming Wangc and
Licheng Lingd
*ab,
Zhenghua Fanab,
Jie Zhangab,
Yongmin Qiaoab,
Jianming Wangc and
Licheng Lingd
aDepartment of Research and Development, Shanghai Shanshan Technology Co., Ltd., Shanghai 201209, China. E-mail: chuanzhang0012@126.com; Fax: +86-021-58564661; Tel: +86-021-58569033
bDepartment of Research and Development, Ningbo Shanshan New Material Science & Technology Co., Ltd., Ningbo 315177, Zhejiang, China
cDepartment of Chemistry, Zhejiang University, Hangzhou 310027, China
dState Key Laboratory of Chemical Engineering, East China University of Science and Technology, Shanghai, 200237, China
First published on 8th October 2018
Abstract
In this report, novel hard carbon/graphite composites are prepared by a simple in situ particle anchoring method, followed by carbonization. The effects of loading content of hard carbon on the structure and electrochemical performance of the composites are investigated. The SEM results show that the hard carbon particles are anchored randomly on the surface of graphite. The electrochemical measurements demonstrate that an appropriate loading content of hard carbon can remarkably increase the specific reversible capacity of graphite, which is mainly contributed by lithiation in hard carbon, whereas excessive loading leads to the formation of a thick particle shell onto the surface of graphite, which deteriorates the initial coulombic efficiency drastically. Kinetic tests further show that excessive loading of hard carbon is unfavorable for lithium-ion diffusion probably due to the increased interface distance and decreased electroconductivity. The composite loaded with 10 wt% hard carbon exhibits balanced lithium storage performance with high reversible capacity of 366 mA h g−1, high initial coulombic efficiency (∼91.3%), and superior rate capability and cycling performance. Thus, in this study, we suggest a facile and effective strategy to fabricate a promising graphite anode material for high-performance lithium-ion batteries.
1. Introduction
Lithium-ion batteries (LIBs) are considered to be one of the most promising power sources for portable digital devices, energy storage systems, and electric vehicles due to the advantages of high energy density and long cycle stability.1,2 One of the key parameters that determine the performance of LIBs is the type of anode material used.3 Thus, high-capacity and high-rate anode materials are in high demand for LIBs in complex practical applications. Among various anode materials, graphite is the most widely used material because of its high chemical stability, good electrical conductivity, low cost and high working voltage.4 However, inherent drawbacks such as low theoretical capacity (372 mA h g−1, corresponding to stoichiometric LiC6 compound), inferior rate performance and poor electrolyte compatibility impede its further development in the next-generation LIBs with high energy and high power density. Therefore, intense efforts are needed to find new ways of improving the performance of this commercialized anode material.To meet the increasing need for high-performance graphite, various materials, such as carbonaceous materials (soft carbon and hard carbon),5–7 ion-functional groups,8 silicons,9–11 and metal compounds,12,13 have been coated onto the graphite surface to suppress the irreversible solvated lithium intercalation into graphite layers as well as to improve the rate capability. Among these materials, hard carbon-based materials have been proven to be the most effective modifiers for graphite due to their highly disordered and porous structure, which can not only shorten the transport distance for Li+ but also offer large electrode–electrolyte interface for charge-transfer reaction.14 Generally, hard carbon is composited to graphite by directly mixing or through surface coating by pyrolyzing adequate precursors in the practical production.15,16 However, the traditional coating method has the limitation of low carbon loading,17 as high carbon loading can easily cause serious particle agglomeration, thus resulting in low production yield. While direct mixing of graphite and hard carbon can cause phase separation due to different true densities and tap densities. Thus, scalable preparation of low-cost hard carbon/graphite composites with high hard carbon ratio, controllable structure and excellent lithium storage performance is still a challenge.
In this study, a facile method is reported for large-scale fabrication of a novel hard carbon/graphite composite with unique morphology by in situ anchoring of bare graphite with hard carbon particles of smaller size. To achieve this goal, a low-cost pitch with high softening point was used as the precursor for the production of hard carbon through surface solidification by phosphoric anhydride and carbonization. The microstructures of the obtained composites were characterized, and the corresponding anode performances were investigated and optimized. The results showed that the composite with an optimal loading of hard carbon displays promising electrochemical performance with high reversible capacity, good rate capability, and desirable cycling stability.
2. Experimental
2.1. Material preparation
For the purpose of this study, artificial graphite (AG, Shanghai Shanshan Tech Co., Ltd.) with D50 size of about 18.6 μm was used as the raw material. An isotropic petroleum pitch (Dalian Mingqiang Chemical Materials Co., Ltd., China) with a softening point of 250 °C was used as the carbon source for developing hard carbon. The pitch was milled and classified to adjust the median diameter D50 to ca. 3–4 μm before usage. Then, the hard carbon/graphite (HC/G) composite was synthesized by the following procedure: AG and pitch were first dispersed in distilled water to form a homogeneous suspension with total solid content of 50%. The ratio of the pitch was in the range of 10–30 wt% against the amount of AG. Then, the oxidizing agent P2O5 (PO) was added into the above suspension under vigorous stirring at room temperature to reach a concentration of 20 wt% (against the pitch). After that, the obtained slurry was oxidized and dried at 100 °C for 12 h in an oven to avoid pitch remelting during the following carbonization process. Thus, the obtained mixture was carbonized at 1000 °C for 2 h under flowing argon in a tube furnace at a heating rate of 5 °C min−1. The resulting samples were noted as HC/G-10 and HC/G-30 according to the amount of pitch used. Before use, AG was also annealed at 1000 °C. The schematic diagram of the preparation process for HC/G is illustrated in Fig. 1.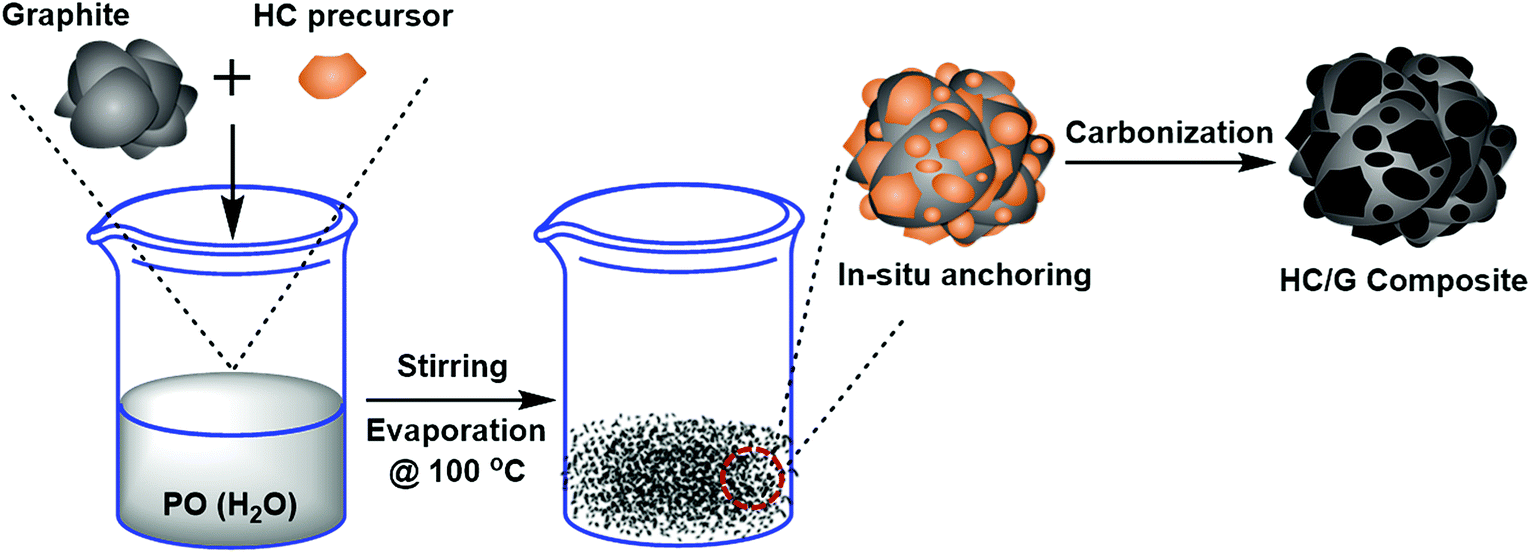 | ||
| Fig. 1 Schematic presentation of the process for HC/G composites. | ||
2.2. Material characterization
The surface groups of the samples were determined by XPS with a Thermo K-Alpha+ system and a monochromatic Al-Kα X-ray source. The spectra were analyzed and processed by using the XPSPEAK software (version 4.1). Peaks were deconvoluted using mixed Gauss–Lorentz sum function line shape and a Shirley-type background line. The morphology of the samples was obtained using scanning electron microscopy (SEM, FEI Quanta-200). Particle size distribution of the prepared samples was determined with Malvern 2000 Instruments. The crystal phase composition of the obtained samples was characterized by X-ray diffraction (XRD) analysis using a Bruker D8 Advance diffractometer with Cu Kα radiation (λ = 0.1.54056 nm). Data were collected for scattering angles (2θ) from 10 to 80° with a scan rate of 2° min−1. The results of XRD analysis were processed using the Bragg and Scherrer equations. Raman spectra were recorded by a Raman spectrometer system (inVia-Reflex) using a laser with 532 nm excitation at room temperature. Nitrogen adsorption and desorption isotherms were measured using an automatic specific surface area of microporous/mesoporous physical adsorption analyzer (ASAP 2460 V2.01) at 77 K. Surface areas were determined by the BET method.2.3. Electrochemical measurements
The working electrodes were prepared by coating a mixture of the as-prepared material with Super P conductive agent and poly (vinylidene fluoride) (PVDF) binder at a weight ratio of 91.6![[thin space (1/6-em)]](https://www.rsc.org/images/entities/char_2009.gif) :6.6:1.8 dissolved in N-methyl-2-pyrrolidone (NMP) on a copper foil. Electrochemical tests were carried out using CR2430 with a lithium metal foil as the counter electrode. To form the anode, the mixed slurry was coated on a copper foil, dried at 120 °C under vacuum for 12 h, pressed using a roll-type mill under 100 MPa of pressure, cut into discs (16 mm in diameter), and then weighed using an ultra-fine balance to adjust the amount of active material. Coin-type cells were assembled in an Ar-filled glove box using a polyethylene film as a separator and lithium hexafluorophosphate (LiPF6) solution (1 M) in a mixture of ethylene carbonate/diethyl carbonate/ethyl methyl carbonate (EC/DEC/EMC, 1:1:1, v/v/v, Shanshan Tech Co., Ltd) as an electrolyte. Galvanostatic charge/discharge measurements were carried out using a Land Battery Measurement System (LAND CT2001A, China) in a fixed voltage range of 0–2.5 V vs. Li/Li+ at room temperature. Cyclic voltammetry (CV) and electrochemical impedance spectroscopy (EIS) measurements were performed using an electrochemical working station (Zahner IM6ex) at room temperature. All the electrochemical tests were carried out at ambient temperature.
:6.6:1.8 dissolved in N-methyl-2-pyrrolidone (NMP) on a copper foil. Electrochemical tests were carried out using CR2430 with a lithium metal foil as the counter electrode. To form the anode, the mixed slurry was coated on a copper foil, dried at 120 °C under vacuum for 12 h, pressed using a roll-type mill under 100 MPa of pressure, cut into discs (16 mm in diameter), and then weighed using an ultra-fine balance to adjust the amount of active material. Coin-type cells were assembled in an Ar-filled glove box using a polyethylene film as a separator and lithium hexafluorophosphate (LiPF6) solution (1 M) in a mixture of ethylene carbonate/diethyl carbonate/ethyl methyl carbonate (EC/DEC/EMC, 1:1:1, v/v/v, Shanshan Tech Co., Ltd) as an electrolyte. Galvanostatic charge/discharge measurements were carried out using a Land Battery Measurement System (LAND CT2001A, China) in a fixed voltage range of 0–2.5 V vs. Li/Li+ at room temperature. Cyclic voltammetry (CV) and electrochemical impedance spectroscopy (EIS) measurements were performed using an electrochemical working station (Zahner IM6ex) at room temperature. All the electrochemical tests were carried out at ambient temperature.
3. Results and discussion
3.1. Physical properties of the HC/G composites
HC/G composites are successfully prepared by co-blending AG, pitch powder and oxidizing agent PO in water, followed by successive drying and carbonization. Generally, the PO converts to H3PO4 firstly after dissolving in water and then connects with the superficial pitch molecules through an addition reaction during the drying process, by which the P![[double bond, length as m-dash]](https://www.rsc.org/images/entities/char_e001.gif) O bonds are opened and new phosphorus-containing groups of CO–P(O)(OH)2 are formed. Such phosphorus-containing hydroxyl groups extensively condense with other pitch molecules by releasing H2O and forming intermolecular cross-linked structures and thus realize the in situ solidification of the pitch precursor.18 During the high-temperature carbonization process, the released volatiles make the pitch particles stably cohere to the surface of AG. The pyrolysis behaviour of the samples after drying is first investigated by thermogravimetric analysis, as shown in Fig. S1.† Compared with the results for pristine AG, the first remarkable weight loss stages at 400 °C (for HC/G-3) and at 450 °C (for HC/G-1) are mainly due to multiple and complex reactions (cracking, polymerization, condensation, etc.) of low-molecular-weight compounds in the pitch.19 The second weight loss stage at about 850 °C can be mainly due to the decomposition of some aromatic rings and escape of small phosphorus-containing groups.
O bonds are opened and new phosphorus-containing groups of CO–P(O)(OH)2 are formed. Such phosphorus-containing hydroxyl groups extensively condense with other pitch molecules by releasing H2O and forming intermolecular cross-linked structures and thus realize the in situ solidification of the pitch precursor.18 During the high-temperature carbonization process, the released volatiles make the pitch particles stably cohere to the surface of AG. The pyrolysis behaviour of the samples after drying is first investigated by thermogravimetric analysis, as shown in Fig. S1.† Compared with the results for pristine AG, the first remarkable weight loss stages at 400 °C (for HC/G-3) and at 450 °C (for HC/G-1) are mainly due to multiple and complex reactions (cracking, polymerization, condensation, etc.) of low-molecular-weight compounds in the pitch.19 The second weight loss stage at about 850 °C can be mainly due to the decomposition of some aromatic rings and escape of small phosphorus-containing groups.
To confirm the existence of phosphorus and its chemical bonding state in the carbonized samples, XPS analysis is also conducted, as shown in Fig. 2a. Compared with the results for AG (Fig. 2b), P 2p peaks are detected in XPS of HC/G-1 (Fig. 2c) and HC/G-3 (Fig. 2d), indicating the existence of phosphorus functional groups in the obtained composites. The bonding energies of P 2p at 133.9 eV, 133.0 eV, 132.2 eV and 130.4 eV are assigned to the linkages of C–O–P, C–P–O, C3–PO and C3–P, respectively,18 indicating strong evolution of the phosphorus structures during the high-temperature treatment. The presence of C–P bonds is a result of an effective bonding reaction between the pitch precursor and phosphoric acid on a molecular scale. In addition, O 1s spectra are also analysed in Fig. S2.† Based on calculations, the relative contents of phosphorus and oxygen species are summarized in Table S2.† It can be found that the content of P and O-containing groups varies with the increase in the pitch precursor and PO.
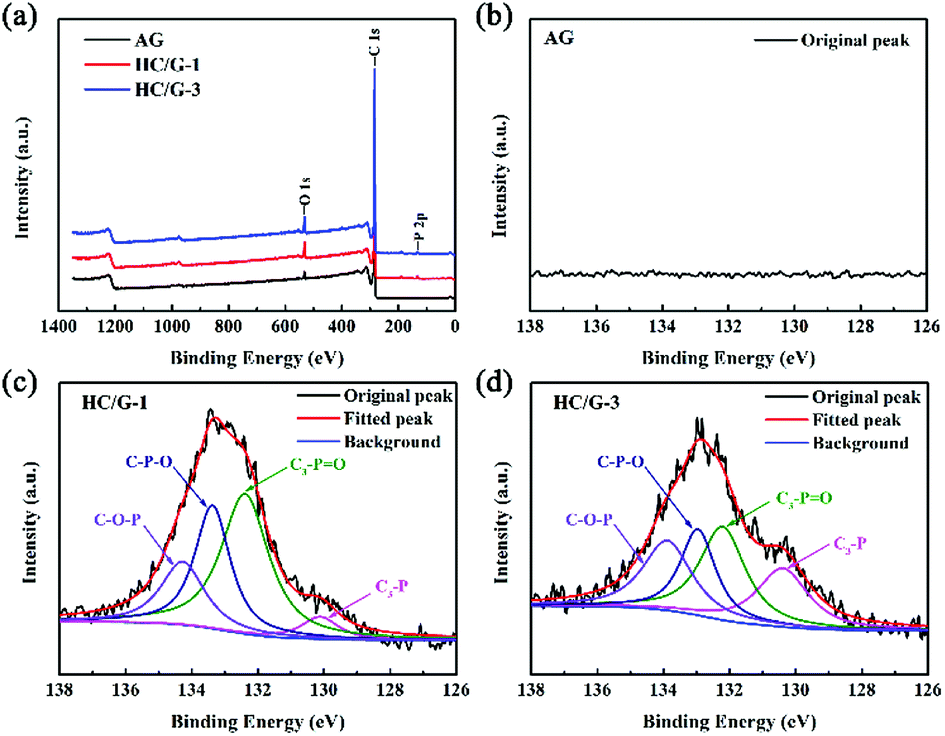 | ||
| Fig. 2 (a) XPS spectra of the samples; (b) P 2p peak of AG; (c) P 2p peak of HC/G-1; (d) P 2p peak of HC/G-3. | ||
Fig. 3 displays the SEM images of pristine AG and the obtained composite HC/Gs. As can be seen, AG presents (Fig. 3a and b) an original irregular multi-particle morphology with smooth surface. After the in situ anchoring process, the morphology of obtained HC/G-1 (Fig. 3c and d) does not change appreciably as compared to that of the original one except that many hard carbon particles (marked with red arrows) are homogeneously present on the surface and gaps of AG. However, the surface of this composite appears to be rough, especially when the amount of anchored hard carbon increases (HC/G-3), as shown in Fig. 3e and f. The in situ-anchored hard carbon particles exhibit sharp-edged morphologies, which can be the main reason for the rough appearance. Such a unique structure might be beneficial to reduce the electrolyte sensitivity of the inner graphite.20,21
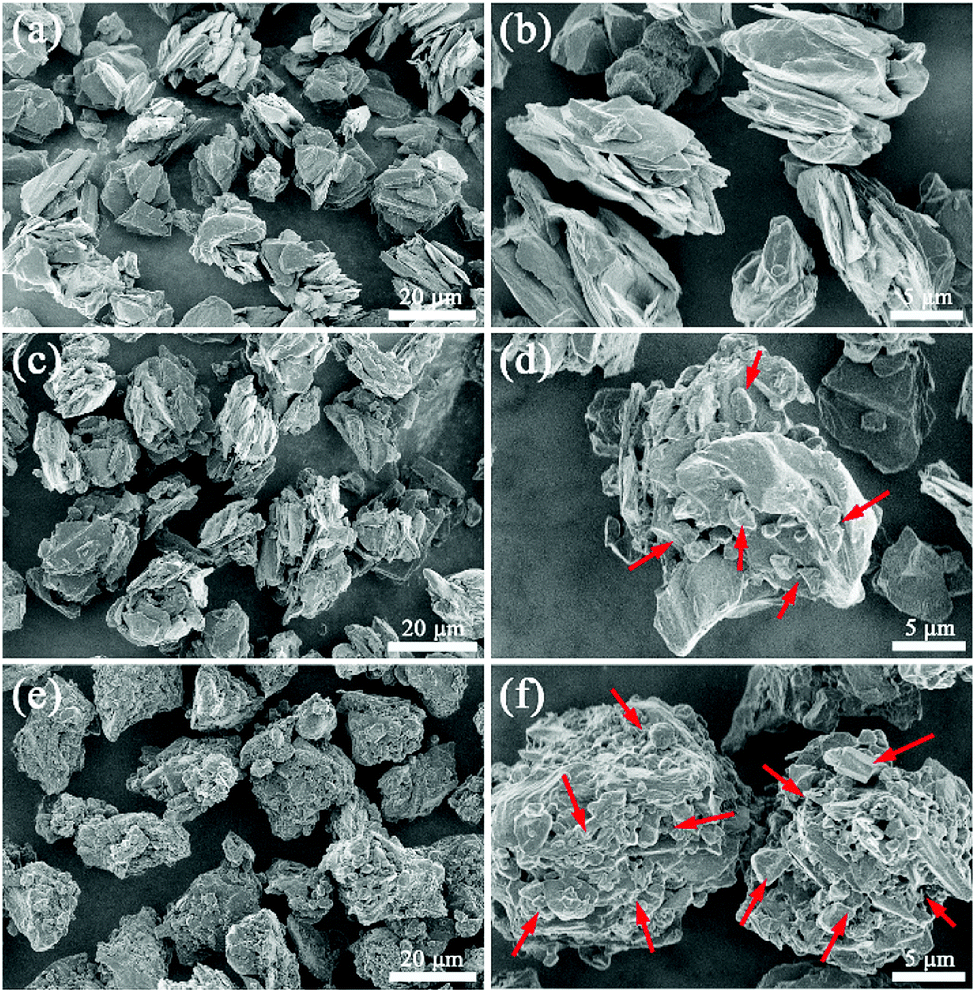 | ||
| Fig. 3 SEM images of sample (a) and (b) AG, (c) and (d) HC/G-1 and (e) and (f) HC/G-3. | ||
Moreover, the SEM mapping results in Fig. S3† further verify the existence and uniform distribution of elemental P and O on the surface of the composites. No clear agglomeration of the graphite particles is found after the carbonization process, suggesting that the pitch precursor has been well-oxidized under low temperature by PO. Such results can be further demonstrated by the particle size distributions presented in Fig. S4.† The average particle diameters (D50) of AG, HC/G-1 and HC/G-3 are measured to be 18.6, 19.3, 20.4 μm, respectively, suggesting that the pitch based on hard carbon particles is adhered to the surface of the graphite. The nanostructure of the pitch based on hard carbon is further characterized by TEM (Fig. S5†). The obtained TEM images reveal a typical turbostratic structure of the sample, which matches the “house of cards” model for hard carbons.22
X-ray diffraction (XRD) patterns are obtained to further confirm the structural features of the obtained samples. As shown in Fig. 4a, both original AG and HC/G composites show sharp diffraction peaks at 2θ of around 26°, 44° and 54°, which are ascribed to the (002), (101) and (004) planes in graphitic carbon,23 respectively. The diffraction peak intensities of HC/G-1 and HC/G-3 decrease with the increase in hard carbon loading, indicating that a well-designed disordered carbon layer is formed on the graphite surface.24 No peak that belongs to any impurity or secondary phase is detected in the XRD patterns, suggesting that the used oxidizing agent PO is homogenously consumed in the final composites after carbonization. Based on the Bragg equation,25 the interlayer space d(002) values are calculated to be 0.3368 and 0.3370 nm (Table 1) for HC/G-1 and HC/G-3, respectively, which are larger than that of original AG (d(002) = 0.3358 nm). Moreover, the average crystal sizes Lc and La both decrease with the increase in hard carbon loading. The powder resistivities of AG and HC/G composites are also estimated and listed in Table 1. As can be seen, the powder resistivity increases significantly with the increase in HC content from 0.25 mΩ mm (AG) to 0.37 mΩ mm (HC/G-1) and then to 0.44 mΩ mm (HC/G-3). This considerable increase in powder resistivity is due to the low conductivity of the introduced hard carbon in the HC/G composites.
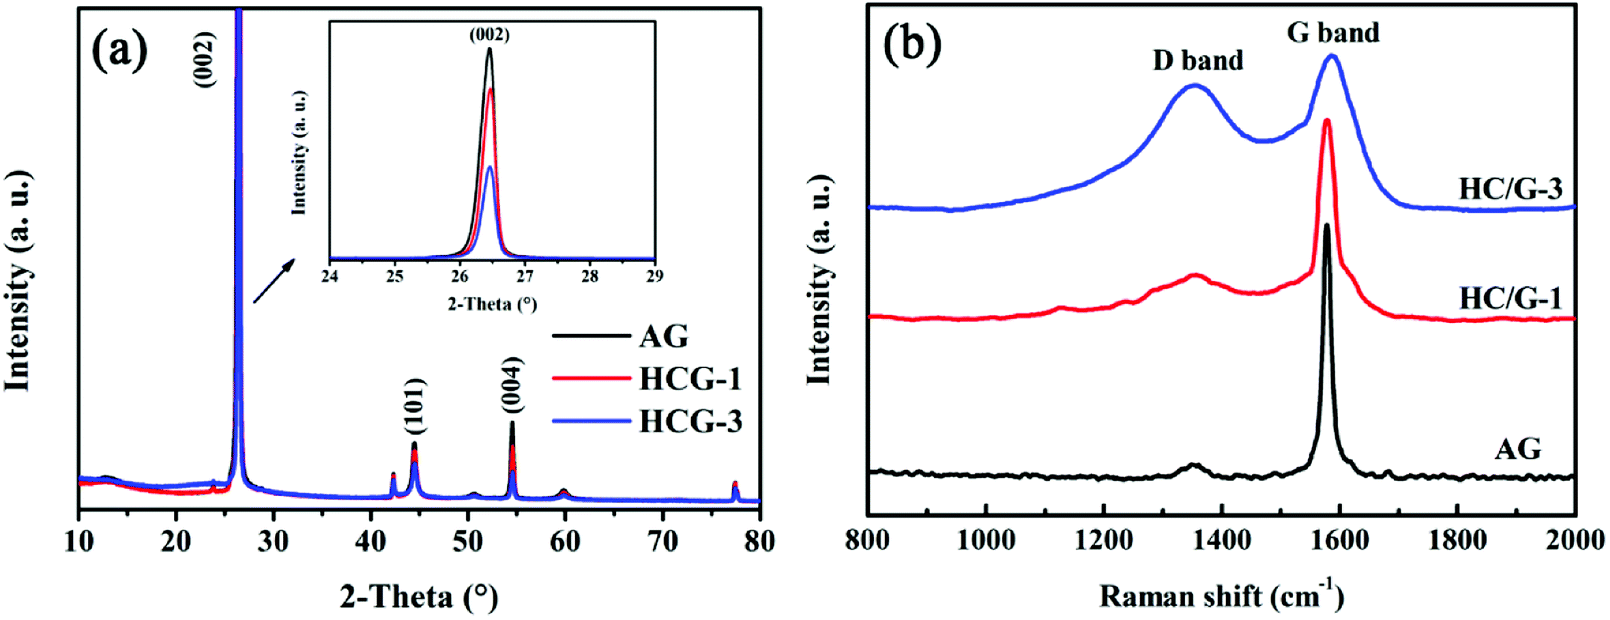 | ||
| Fig. 4 XRD patterns (a) and Raman spectra (b) of AG, HC/G-1 and HC/G-3. | ||
Raman spectra are also obtained to further probe the microstructure of the obtained composites. As shown in Fig. 4b, all the Raman spectra show clear D-band at ∼1360 cm−1 and G-band peak at ∼1580 cm−1, corresponding to the disordered sp2 carbons and E2g mode (in-plane stretching vibration) graphitic carbons.26,27 The integral intensity ratio of D to G band, ID/IG, is well-established as an indicator of crystallinity for the local carbon in carbon materials.28 The numerical values of ID/IG are calculated to be 0.10, 0.28 and 0.83 for AG, HC/G-1 and HC/G-3, respectively (Table 1). Clearly, the ID/IG value increases with the increase in loaded hard carbon, further suggesting the increase in defects and the growth of local disordered structures in the composites. This result agrees well with the XRD data illustrated in Fig. 4a.
Fig. 5 shows the nitrogen adsorption–desorption isotherms of the obtained composites. It can be found that a typical IV isotherm with a distinct hysteresis loop at relative pressure P/P0 between 0.45 and 0.95 is observed for original AG, indicating the presence of some open mesopores.29 However, the hysteresis loop gradually shrinks with the increase in hard carbon loading, suggesting clear change in nanopores of the composites after the anchoring process. Especially for sample HC/G-3, the hysteresis loop nearly disappears, and the total nitrogen absorption volume decreases to the minimum. The specific surface areas (SBET) of AG, HC/G-1 and HC/G-3 are calculated to be 1.8, 1.6 and 1.2 m2 g−1 (Table 1), respectively. Such low SBET values indicate that the nanopores are closed or that their entrances are smaller than those of the nitrogen molecules. Combined with SEM results (Fig. 3), the gradual decrease in SBET is possibly caused by the thermal deposition of the volatiles (released from the oxidized pitch) into the defective nanopores, which acts as a pore healing process during carbonization. Additionally, the increased quantity of doped PO within the composite also has strong effect on the carbon structure, which might destroy the pores.30
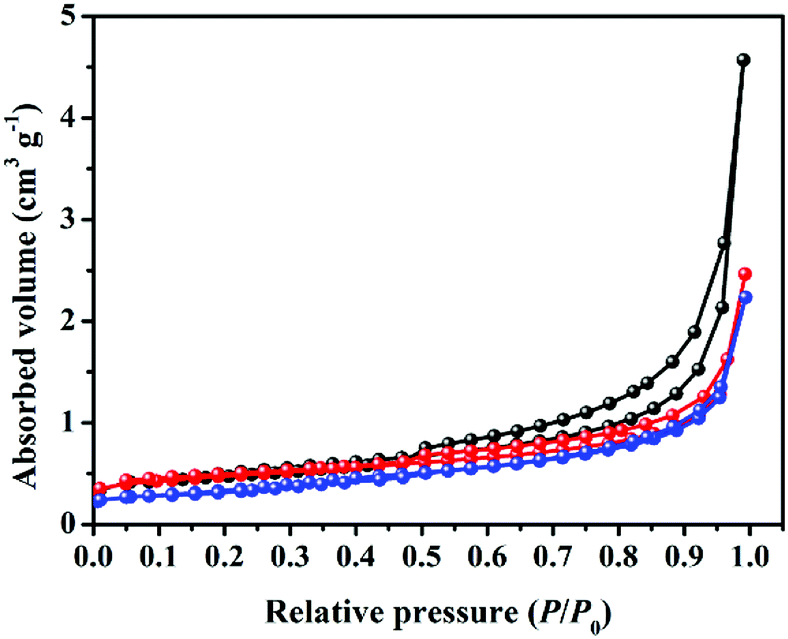 | ||
| Fig. 5 N2 absorption/desorption isotherms of the samples. | ||
3.2. Electrochemical properties of the HC/G composites
The electrochemical properties are further investigated by coin-type half-cells (CR2430 R-type) to understand the Li+ storage behavior in the obtained samples. Fig. 6 shows the cyclic voltammetry (CV) curves of the samples for the first three cycles from 0 to 2.5 V at a scanning rate of 0.5 mV s−1. Clearly, two stages of lithium-ion intercalation/deintercalation occurring below 1.3 V can be observed during scanning. Generally, the reduction peak at about 0.01 V is assigned to the distinct lithiation process, whereas the oxidation peak around 0.38 V corresponds to delithiation from graphitic structure. To be noted, the small reduction peak at around 0.57 V in the first cathodic scan is ascribed to the formation of a solid electrolyte interphase (SEI) layer,31 which causes major irreversible capacities in the first cycle. Compared with the results for pristine AG, the intersection of oxidation and reduction curves for the composites increases from ca. 0.8 V to ca. 1.3 V, thus corresponding to higher capacity. Moreover, the oxidation peaks gradually shift to a lower potential with the increase in loading amount of hard carbon, indicating reduced electrode polarization; this might suggest improved rate capability of the composites.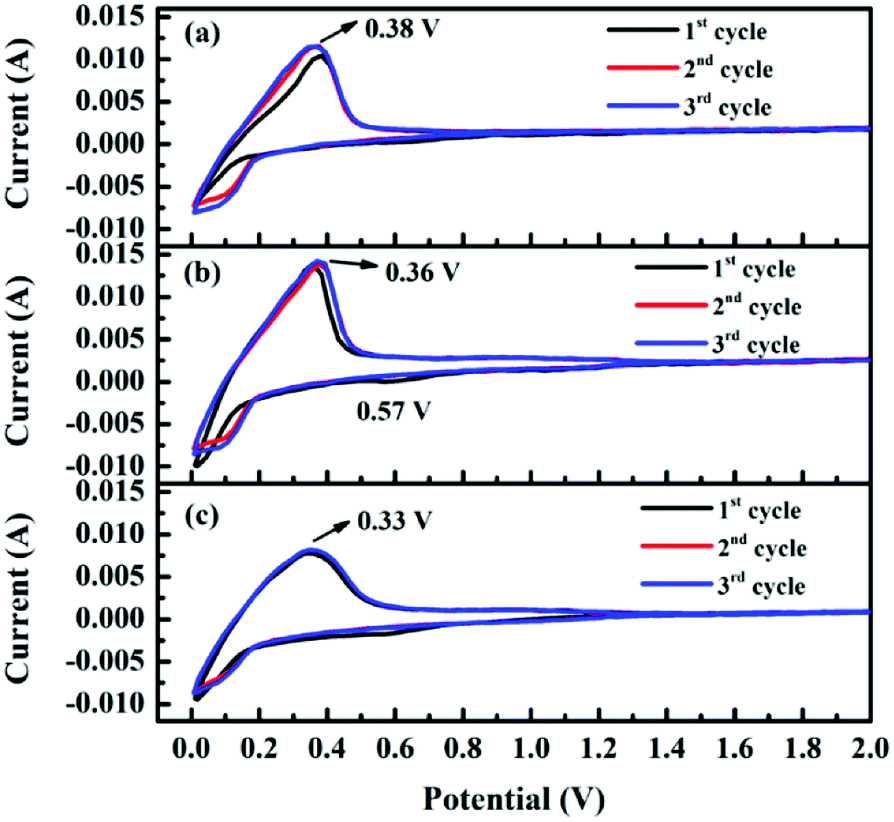 | ||
| Fig. 6 Cyclic voltammetric profiles of (a) AG, (b) HC/G-1 and (c) HC/G-3 electrodes at a scan rate of 0.5 mV s−1. | ||
Fig. 7 illustrates the charge and discharge profiles of the first cycle for the electrodes in the voltage range of 0.005–2.0 V at a rate of 0.1C (corresponding to 35 mA g−1). Clearly, sloping region (from 1.25 to 0.15 V) and plateau region (under 0.1 V) corresponding to lithiation at amorphous carbons and graphitic carbons32 can be found for the composites. Moreover, with the increase in hard carbon ratio, the capacity contributed by the sloping region increases significantly, resulting in high total capacity. The galvanostatic test results of the initial cycle are summarized in Table 2. Notably, pristine AG exhibits charge/discharge capacity (CC/DC) of 356.8/381 mA h g−1 with initial coulombic efficiency (ICE) of 93.6%, whereas HC/G-1 and HC/G-3 deliver CC/DC values of 365.9/401 and 374.7/418 mA h g−1 with ICE values of 91.2% and 89.6%, respectively. This improvement in reversible capacity of the novel composites is mostly due to the in situ anchoring of hard carbons and the minor P-doped structures.33
 | ||
| Fig. 7 Initial charge and discharge of AG, HC/G-1 and HC/G-3 at current of 0.1C. | ||
| Samples | RCa | ICEb | RE1c | RE2d |
|---|---|---|---|---|
| (mA h g−1) | (%) | % | % | |
| a The first cycle discharge capacity.b The initial coulombic efficiency.c The retention ratio of charge capacity of the first cycle at 3C against the charge capacity of the second cycle at initial 0.1C.d The recovery ratio of the first cycle charge capacity of final 0.1C against the charge capacity of the second cycle at initial 0.1C. | ||||
| AG | 356.8 | 93.6 | 4.2 | 88.0 |
| HC/G-1 | 365.9 | 91.2 | 12.1 | 97.1 |
| HC/G-3 | 374.7 | 89.6 | 14.5 | 91.4 |
Rate capability and cycling performance are also tested for HC/G composites to reveal the relationship between anode composition and electrochemical performance. As shown by the rate performance of AG and HC/G composites from 0.1C to 3C in Fig. 8a, the capacities of HC/G composites are higher than that of AG at all current densities, indicating that the introduction of hard carbon onto AG successfully improves its rate capability. This is mainly because hard carbon commonly exhibits larger interlayer spacing and some nanopores, which can provide more equivalent channels for lithium-ion diffusion.34 However, for the obtained composites, HC/G-1 shows higher charge capacities than HC/G-3 from 0.5 to 2C; this is probably due to the greater amount of hard carbon in HC/G-3, which leads to poor conductivity. Under 3C, a higher charge capacity is found for HC/G-3, indicating that a high loading amount of hard carbon is critical to obtain high-rate performance of the HC/G composite. As indicated by Table 2, capacity retention ratios (RE1) of 4.2, 12.1 and 14.5% are achieved at 3C for AG, HC/G-1 and HC/G-3, respectively. When the C-rate is switched back to 0.1C, the charge capacities return to 312.3, 354.3 and 342.7 mA h g−1 with capacity recovery ratios (RE2) of 88.0, 97.1 and 91.4% for AG, HC/G-1 and HC/G-3, respectively, demonstrating good stability of the HC/G-1 electrode at various current densities.
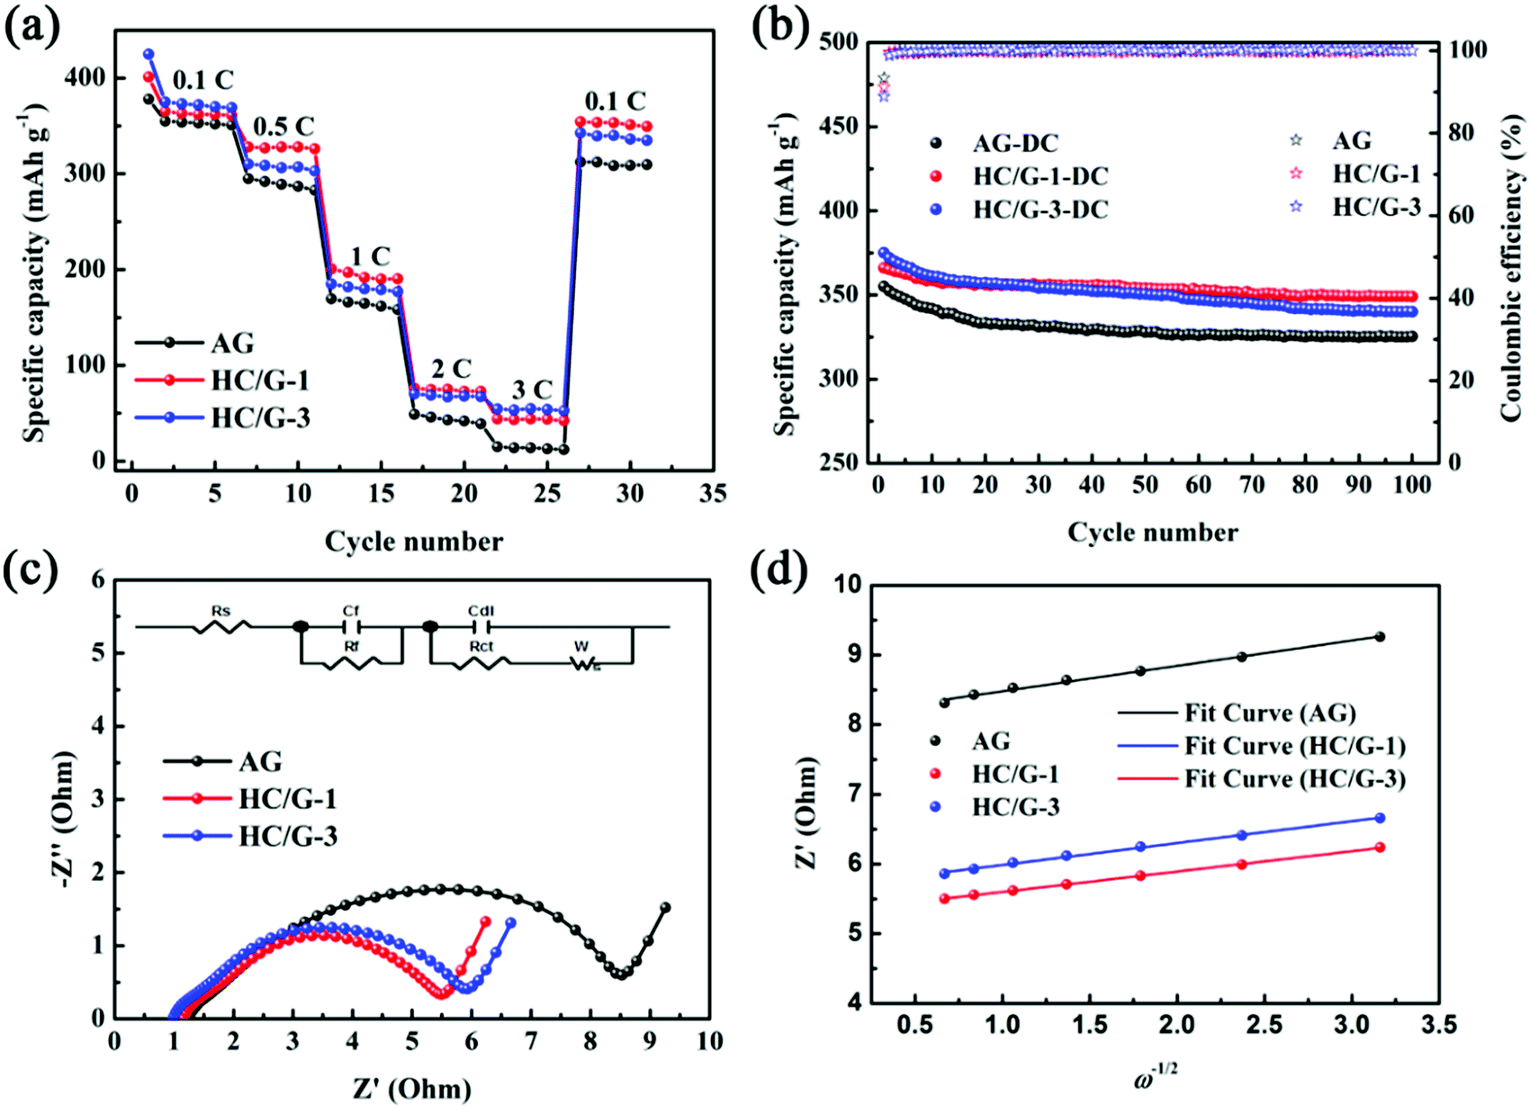 | ||
| Fig. 8 Electrochemical performances of AG, HC/G-1 and HC/G-3 samples: (a) rate capability from 0.1C to 3C; (b) cycle performance at a current rate of 0.3C; (c) Nyquist plots before cycling and (d) the relationship curves between Z′ and ω−1/2 in the low-frequency region. | ||
Fig. 8b shows the cycling performance of the obtained samples tested at 0.3C. During all the cycles, HC/G-1 and HC/G-3 exhibit higher cycling reversible capacities and better cyclabilities than pristine AG. Additionally, both composites display a considerable capacity loss in the initial 20 cycles due to lithium consumption by active sites in the anchored hard carbon. However, in the following cycles, HC/G-1 exhibits a relatively stable charge/discharge process, whereas HC/G-3 suffers continuous capacity fading. After 100 cycles, HC/G-1 still exhibits capacity of 349 mA h g−1, which is much higher than those of HC/G-3 (340 mA h g−1) and AG (325 mA h g−1). The better cycling performance of HC/G-1 can be due to its proper HC-to-AG ratio, which is conducive to electrolyte infiltration;35 this can help improve ion-diffusion and maintain interfacial stability during cycling.
The dynamic processes of AG, HC/G-1 and HC/G-3 electrodes before cycling can be revealed by electrochemical impedance spectroscopy (EIS, as shown in Fig. 8c). The depressed semicircles in the high- and medium-frequency regions represent the total interfacial resistance from SEI (Rf) and the charge-transfer resistance (Rct).36 The smaller the semicircle, the lower the total Rf and Rct.37 The EIS curves are fitted by an equivalent circuit composed of “R(C(R))(C(RW))” using the ZSimpWin program (inset of Fig. 8c), and the fitting results are shown in Table 3. Among the samples, HC/G-1 has the lowest Rf and Rct values, which can verify its better rate performance mentioned above.
| Sample | Rf (Ω) | Rct (Ω) | δ (Ω s−1/2) | DLi+ (cm2 s−1) |
|---|---|---|---|---|
| AG | 1.8 | 4.0 | 0.381 | 1.03 × 10⁻⁷ |
| HC/G-1 | 1.1 | 2.4 | 0.297 | 1.71 × 10⁻⁷ |
| HC/G-3 | 1.3 | 2.6 | 0.321 | 1.47 × 10⁻⁷ |
To further study the initial reaction kinetics of HC/G, Li+ diffusion coefficient (DLi+) is calculated using the following equation:38
| DLi+ = R2T2/2A2n4F4CLi+2δ2 | (1) |
| Z′ = Rc + Rct + δω−1/2 | (2) |
4. Conclusions
Novel hard carbon/graphite composites are successfully synthesized by a facile in situ particle anchoring method. The obtained samples are evaluated in detail with the assistance of SEM, XRD, Raman and nitrogen adsorption and applied as high-performance graphitic anode materials for lithium-ion batteries. The results show that the specific surface area of the obtained composites gradually decreases with the increase in hard carbon amount. Among the samples tested in this study, HC/G-1 with an optimal HC-to-AG ratio displays the most favorable initial reversible capacity (366 mA h g−1), cyclic capacity retention (349 mA h g−1 after 100 cycles at 0.3C), and rate capability (capacity retention of 12.1% at 3C). The improved electrochemical performance is due to the presence of a proper ratio of isotropic and porous hard carbon, which can offer fast transport channels for lithium ions and help electrolyte permeation, thus alleviating capacity fading during long cycling. In conclusion, this HC/G composite has great potential to be an excellent candidate for anodes in high-energy and high-power-density lithium-ion batteries.Conflicts of interest
There are no conflicts to declare.Acknowledgements
This work was supported by China Ministry of Science and Technology (No. 2016YFB0100400).References
- F. Wang, W. Li, M. Hou, C. Li, Y. Wang and Y. Xia, J. Mater. Chem. A, 2015, 3, 1703–1708 RSC.
- Y. Wang, X. Zheng, Q. Qu, G. Liu, V. S. Battglia and H. Zheng, Carbon, 2018, 132, 420–429 CrossRef CAS.
- J. Lu, Z. Chen, F. Pan, Y. Cui and K. Amine, Electrochemical Energy Reviews, 2018, 1, 1–19 CrossRef.
- Y. J. Han, J. Kim, J. S. Yeo, J. C. An, I. P. Hong, K. Nakabayashi, J. Miyawaki, J. D. Jung and S. H. Yoon, Carbon, 2015, 94, 432–438 CrossRef CAS.
- C. Wan, H. Li, M. Wu and C. Zhao, J. Appl. Electrochem., 2009, 39, 1081–1086 CrossRef CAS.
- H. L. Zhang, S. H. Liu, F. Li, S. Bai, C. Liu, J. Tan and H. M. Cheng, Carbon, 2006, 44, 2212–2218 CrossRef CAS.
- B. Veeraraghavan, J. Paul, B. Haran and B. Popov, J. Power Sources, 2002, 109, 377–387 CrossRef CAS.
- J. S. Yeo, T. H. Park, M. H. Seo, J. Miyawaki, I. Mochida and S. H. Yoon, Int. J. Electrochem. Sci., 2013, 8, 1308–1315 CAS.
- S. Y. Kim, J. Lee, B. H. Kim, Y. J. Kim, K. S. Yang and M. S. Park, ACS Appl. Mater. Interfaces, 2016, 8, 12109–12117 CrossRef CAS PubMed.
- Z. Yi, N. Lin, Y. Zhao, W. Wang, Y. Qian, Y. Zhu and Y. Qian, Energy Storage Mater., 2018 DOI:10.1016/j.ensm.2018.07.025.
- Z. Yi, N. Lin, T. Xu and Y. Qian, Chem. Eng. J., 2018, 347, 214–222 CrossRef CAS.
- A. Ulus, Y. Rosenberg, L. Burstein and E. Peled, J. Electrochem. Soc., 2002, 149, A635–A643 CrossRef CAS.
- J. Y. Lee, R. Zhang and Z. Liu, J. Power Sources, 2000, 90, 70–75 CrossRef CAS.
- K. J. Kim, T. S. Lee, H. G. Kim, S. H. Lim and S. M. Lee, Electrochim. Acta, 2014, 135, 27–34 CrossRef CAS.
- Y. S. Ding, W. N. Li, S. Iaconetti, X. F. Shen, J. D. Carlo, F. S. Galasso and S. L. Suib, Surf. Coat. Technol., 2006, 200, 3041–3048 CrossRef CAS.
- C. Wang, H. Zhao, J. Wang and P. Lv, Ionics, 2013, 19, 221–226 CrossRef CAS.
- H. Nozaki, K. Nagaoka, K. Hoshi, N. Ohta and M. Inagaki, J. Power Sources, 2009, 194, 486–493 CrossRef CAS.
- Y. Wang, S. Zuo, J. Yang and S. H. Yoon, Langmuir, 2017, 33, 3112–3122 CrossRef CAS PubMed.
- C. S. Wu, Y. L. Liu, Y. C. Chiu and Y. S. Chiu, Polym. Degrad. Stab., 2002, 78, 41–48 CrossRef CAS.
- N. Ohta, H. Nozaki, K. Nagaoka, K. Hoshi, T. Tojo, T. Sogabe and M. Inagaki, New Carbon Mater., 2002, 17, 61–63 CAS.
- M. Yoshio, H. Wang, K. Fukuda, Y. Hara and Y. Adachi, J. Electrochem. Soc., 2000, 147, 1245–1250 CrossRef CAS.
- T. Zheng, J. S. Xue and J. R. Dahn, Chem. Mater., 1996, 8, 389–393 CrossRef CAS.
- Z. Q. Li, C. J. Lu, Z. P. Xia, Y. Zhou and Z. Luo, Carbon, 2007, 45, 1686–1695 CrossRef CAS.
- X. Jiang, H. C. Fang, P. Xiao, T. Liu, J. M. Zhu, Y. C. Wang, P. F. Liu and Y. Li, J. Alloys Compd., 2018, 744, 165–173 CrossRef CAS.
- H. Takagi, K. Maruyama, N. Yoshizawa, Y. Yamada and Y. Sato, Fuel, 2004, 83, 2427–2433 CrossRef.
- K. Hoshi, N. Ohta, K. Nagaoka, S. Bitoh, A. Yamanaka, H. Nozaki, T. Okuni and M. Inagaki, Tanso, 2009, 2009, 213–220 CrossRef.
- L. G. Cançado, K. Takai, T. Enoki, M. Endo, Y. A. Kim, H. Mizusaki, N. L. Speziali, A. Jorio and M. A. Pimenta, Carbon, 2008, 46, 272–275 CrossRef.
- D. A. Stevens and J. R. Dahn, J. Electrochem. Soc., 2001, 148, A803–A811 CrossRef CAS.
- M. J. Lázaro, L. Calvillo, E. G. Bordejé, R. Moliner, R. Juan and C. R. Ruiz, Microporous Mesoporous Mater., 2007, 103, 158–165 CrossRef.
- H. Fujimoto, K. Tokumitsu, A. Mabuchi, N. Chinnasamy and T. Kasuh, J. Power Sources, 2010, 195, 7452–7456 CrossRef CAS.
- J. S. Park, J. Lee, J. W. Lee, K. J. Kim, Y. N. Jo, S. G. Woo and Y. J. Kim, Carbon, 2013, 62, 278–287 CrossRef.
- R. Imamura, K. Matsui, S. Takeda, J. Ozaki and A. Oya, Carbon, 1999, 37, 261–267 CrossRef CAS.
- H. Tao, S. Du, F. Zhang, L. Xiong, Y. Zhang, H. Ma and X. L. Yang, ACS Appl. Mater. Interfaces, 2018 DOI:10.1021/acsami.8b11243.
- J. Yang, X. Y. Zhou, J. Li, Y. I. Zou and J. J. Tang, Mater. Chem. Phys., 2012, 135, 445–450 CrossRef CAS.
- Y. Bai, Y. Liu, Y. Li, L. Ling, F. Wu and C. Wu, RSC Adv., 2017, 7, 5519–5527 RSC.
- V. S. Kolosnitsyn, E. V. Kuzmina, E. V. Karaseva and S. E. Mochalov, J. Power Sources, 2011, 196, 1478–1482 CrossRef CAS.
- X. Wu, X. Yang, F. Zhang, L. Cai, L. Zhang and Z. Wen, Ceram. Int., 2017, 43, 9458–9464 CrossRef CAS.
- L. L. Zhang, H. B. Sun, X. L. Yang, Y. W. Wen, Y. H. Huang, M. Li, G. Peng, H. C. Tao, S. B. Ni and G. Liang, Electrochim. Acta, 2015, 152, 496–504 CrossRef CAS.
- L. C. Zou and C. Hunt, J. Electrochem. Soc., 2009, 156, 8–15 CrossRef.
- X. L. Wu, Y. G. Guo, J. Su, J. W. Xiong, Y. L. Zhang and L. J. Wan, Adv. Energy Mater., 2013, 3, 1155–1160 CrossRef CAS.
Footnote |
| † Electronic supplementary information (ESI) available. See DOI: 10.1039/c8ra07170e |
| This journal is © The Royal Society of Chemistry 2018 |