 Open Access Article
Influence of citrate on phase transformation and photoluminescence properties in LaPO4 and LaPO4:Eu†
An-Ping Wua,
He Baia,
Jin-Rong Bao *a,
Kui-Suo Yanga,
Li-Na Fenga,
Yang-Yang Maa,
Yan Qiaoa,
Wen-Xian Lia,
Ying Liu
 a and
Xiao-Wei Zhu*b
aSchool of Chemistry and Chemical Engineering, Inner Mongolia University, Hohhot 010021, China. E-mail: jinrongbao@imu.edu.cn; Tel: +86-0471-4992981
bCollege of Pharmacology, Inner Mongolia Medical University, Hohhot 010059, China. E-mail: zxwtxwd@sina.com
First published on 19th October 2018
Abstract
The hexagonal and monoclinic phase LaPO4 and LaPO4:Eu nanostructures have been controllably synthesized by a citrate-induced hydrothermal process at 100 °C. The crystal growth of LaPO4 nanostructures was investigated, and the phase transformation of nanostructured LaPO4 was systematically studied by varying the citrate concentration, pH value and reaction temperature. When 0.8 mmol of citrate was added into the reaction system, the hexagonal phase LaPO4 transformed into the monoclinic phase. High concentrations of citrate would lead to the formation of hexagonal phase LaPO4. The photoluminescence properties of the monoclinic phase LaPO4:Eu prepared using a citrate-induced process demonstrate that the electric dipole transition (5D0 → 7F2) is stronger than the magnetic dipole transition (5D0 → 7F1), which indicated that Eu3+ is in a site with no inversion center. The strongest emission peak of hexagonal phase LaPO4:Eu comes from 5D0 → 7F1. Furthermore, the citrate-induced hexagonal phase LaPO4:Eu has a stronger emission intensity than the hexagonal phase LaPO4:Eu prepared not using a citrate-induced process.
1 Introduction
In recent years, the rare earth orthophosphates have received much attention, due to their electronic, optical, and chemical characteristics.1 For example, they are used as phosphors, light sources, high-performance luminescent devices, field-effect transistors, solar cells, and biomedical labels.2–7 Rare earth orthophosphates are rich in polymorphs, which usually include monazite (monoclinic), xenotime (tetragonal), rhabdophane (hexagonal), weinschenkite (monoclinic).8 Phase transformation is very common in these polymorphs. The hexagonal phase rare earth orthophosphates are obtained at low temperature, and can transform into the monoclinic phase at high temperature.9 As important photoluminescent host materials, the hexagonal structured lanthanum orthophosphates are usually prepared from a sol–gel method10 and hydrothermal method11 at low-temperature, while the monoclinic phase lanthanum orthophosphates can be prepared at high temperature. For example, the monoclinic phase LaPO4 could be synthesized through hydrothermal reaction at 180 °C;12 the monoclinic phase LaPO4:Er was obtained via solid state reaction at 1200 °C;13 and the monoclinic phase LaPO4:Eu could also be formed in high boiling coordinating solvents at 200 °C.14 Recently, the low temperature synthesis method of the monoclinic phase REPO4 has received much attention. Several pressure-induced phase transformations of ABO4 (A = Ba, Ca, Sr, Tb, Dy; B = Cr, W, P) compounds have been discovered.15–18 In particular, the organic ligand-induced phase transformation of REPO4 compounds at low temperature has been studied. Yan et al.19 reported an ethylenediaminetetraacetic acid (EDTA)-mediated hydrothermal route to synthesize different phase cerium orthovanadate (CeVO4) microcrystals. In our previous study, we found that nanostructured CePO4:Tb with hexagonal and monoclinic phases could be controllably synthesized through a hydrothermal route at 150 °C by simply varying the reactant C2O42−/Ce molar ratio.20 Nuria et al.21 have synthesized monazite LnPO4 (Ln = La, Ce) and LaPO4:Ln (Ln = Eu, Ce, Ce + Tb) through the controlled release of La3+ cations from lanthanide–citrate complexes using ethylene glycol (EG) as solvent. Among a variety of organic additives, trisodium citrate (Cit3−) is one of the most common and important organic molecules.22,23 Actually, citrate is often used as a structure-directing agent to control the nucleation, growth and alignment of REPO4 crystals.24,25 In order to achieve the phase transformation of REPO4 compounds at low temperature, the organic ligand-induce might be a feasible method.In this paper, we developed an effective method to synthesis the LaPO4 and LaPO4:Eu with hexagonal phase and monoclinic phase by the citrate-induced hydrothermal process at low temperature. Furthermore, the function of citrate-induce on the phase transformation of LaPO4 was systematically investigated. It is interesting to note that monoclinic phase LaPO4 nanoparticles grow better if 0.8 mmol of citrate is used. Similarly, the monoclinic phase and hexagonal phase CePO4 can be obtained, respectively. The monoclinic phase CePO4 can be obtained while citrate concentration increased to 1.2 mmol. High concentration of citrate would result in the formation of hexagonal phase rare earth orthophosphates. We also discussed the effect of high concentration citrate on the phase transformation, and the photoluminescence properties of the LaPO4:Eu with different phase and size.
2 Experimental
2.1 Material and reagents
All chemicals were of analytical grade and were used as received without further purification. H3PO4 (A.R.), HNO3 (A.R.), NH3·H2O (A.R.), La(NO3)3·6H2O (A.R.), sodium citrate dihydrate, Ce(NO3)3·6H2O (A.R.) and Eu2O3 (purity > 99.99%) were all supplied by Sinopharm Chemical Reagent Limited Corporation. The europium nitrate was prepared by dissolving Eu2O3 in 10% nitric acid, and then evaporated and dried in vacuum.2.2 Synthesis
In a typical procedure using citrate as ligand, 0.0–3.0 mmol sodium citrate dihydrate was added to 0.1 mol L−1 of La(NO3)3 solution while kept under stirring. The solution turned turbid due to the formation of lanthanum citrate complex under vigorous stirring for 20 min. Subsequently, 0.1 mol L−1 H3PO4 was added slowly while kept under stirring at 10 min. The obtained turbid solution was transferred into a stainless steel autoclave with an inner Teflon vessel (volume, 50 mL). It was sealed and maintained at 100 °C for 12 h. After cooling to room temperature, the precipitation was separated by centrifugation, washed with deionized water and ethanol absolute three times, and finally dried at 60 °C for 8 h. In this way, the La0.95PO4:Eu0.05 and CePO4 were synthesized.2.3 Characterization
The size and morphology of the products were characterized by scanning electronic microscopy (SEM, Hitachi S-4800, Japan) and transmission electron microscopy (TEM, FEI Tecnai F20, USA). XRD patterns were measured by a 21 kW extra power X-ray diffractometer (Model M21XVHF22, MAC science Co. Ltd., Japan) using Cu Kα radiation (k = 0.1541 nm) over a 2θ range of 10–60° at room temperature. The photoluminescence spectra of powders were recorded on FL Spectrophotometer (FLS-980) with the slit width of 1.0 nm at room temperature.3 Result and discussion
3.1 Structure of LaPO4 and CePO4
In this study, the different crystalline phases of LaPO4 were prepared using different concentration of citrate as ligand. The phase structures of the products were identified by X-ray diffraction (Fig. 1). The typical XRD pattern of the product prepared with 0.8 mmol citrate is shown in Fig. 1a, all diffraction peaks agree well with monoclinic phase LaPO4 (JCPDS 32-0493). The diffraction peaks were very strong and sharp, indicating that the sample has a good crystallinity. While citrate concentration is 3.0 mmol, all the peaks can be indexed to the hexagonal phase LaPO4, which was in good agreement with the JCPDS 75-1881 (Fig. 1b). Therefore, the phase transformation of LaPO4 can be controlled by varying citrate concentration.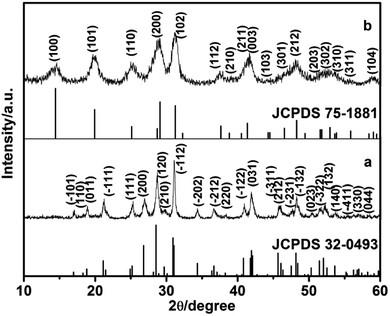 | ||
| Fig. 1 XRD patterns of LaPO4 nanostructures prepared with citrate-induced (a) the monoclinic phase and (b) the hexagonal phase. | ||
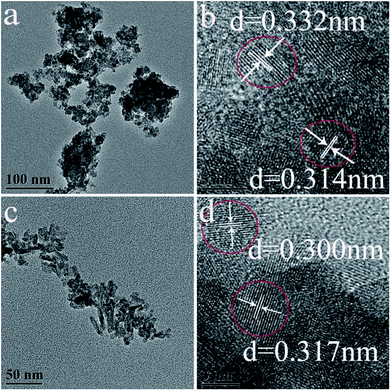
TEM images of as-synthesized hexagonal and monoclinic phase products were shown in Fig. 2. Fig. 2a presents the TEM images of the product synthesized with 0.8 mmol citrate. The as-synthesized monoclinic phase LaPO4 was composed of nanoparticles, its average grain size was about 40 nm by using the formula of Debye–Scherrer to calculate. A high-resolution TEM image (Fig. 2b) showed that the spacing of the sample between two adjacent horizontal and vertical lattice planes is 3.32 Å and 3.14 Å (Fig. 2b), close to the d200 (3.326 Å) and d120 (3.127 Å), respectively. When citrate concentration was 3.0 mmol, the as-obtained hexagonal phase product has rod-like morphology, and its diameter was 5–10 nm (Fig. 2c). The high-resolution TEM image of LaPO4 indicated that the spacing of the sample between two adjacent horizontal and vertical lattice planes is 3.00 Å and 3.17 Å (Fig. 2d), close to the d200 (3.0662 Å) and d111 (3.1057 Å), respectively.
Comparative experiments were carried out to investigate the effects of the ligand citrate on the structure and morphology of the products. The citrate concentration was changed from 0.0 to 3.0 mmol. Fig. 3 showed the XRD pattern of the products synthesized with different citrate concentration. XRD pattern of the product prepared without citrate was shown in Fig. 3a. All the diffraction peaks agree well with hexagonal phase LaPO4 (JCPDS 75-1881). When the citrate concentration was 0.2 mmol, the monoclinic phase appeared but the majority phase was hexagonal phase (Fig. 3b). When the citrate concentration was 0.5 mmol, the diffraction intensity of monoclinic phase enhanced (Fig. 3c). While citrate concentration was reaching 0.8 mmol, all diffraction peaks of the product fit well with the diffraction peaks of pure monoclinic phase LaPO4 (JCPDS 32-0493), and no hexagonal phase was observed (Fig. 3d). However, when citrate concentration increased to 0.9 mmol, the diffraction peak of the hexagonal phase appeared again (Fig. 3e). With the citrate concentration increasing to 1.0 mmol, the diffraction intensity of the hexagonal phase enhanced gradually (Fig. 3f). When the citrate concentration was reaching to 3.0 mmol, the products transform into a hexagonal phase again (Fig. 3g and h).
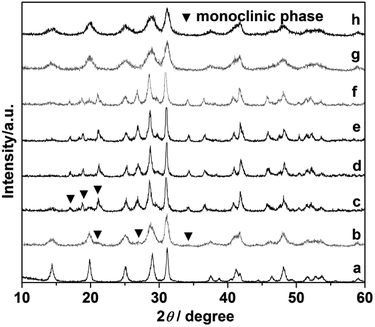 | ||
| Fig. 3 XRD pattern of the LaPO4 prepared with different citrate concentration: (a) 0, (b) 0.2, (c) 0.5, (d) 0.8, (e) 0.9, (f) 1.0, (g) 2.0, (h) 3.0 mmol. | ||
The above comparative experiments showed that the citrate-induced the phase transformation of LaPO4. The corresponding SEM images were showed in Fig. 4. Fig. 4a indicated the image of product prepared without citrate. The product was composed with nanowires with a diameter about 20–30 nm and length of 300–500 nm. A large number of uniform nanorods with a length of 80–100 nm and a diameter of 10–20 nm were observed in the product, when the citrate concentration was 0.2 mmol (Fig. 4b). While the citrate concentration was changed from 0.5 to 1.0 mmol, the morphology of the products was rod-like nanoparticles and nanoparticles (Fig. 4c–e). As the citrate concentration increased to 3.0 mmol, the product was composed of nanorods with a diameter of 5–10 nm and length about 20–30 nm (Fig. 4f).
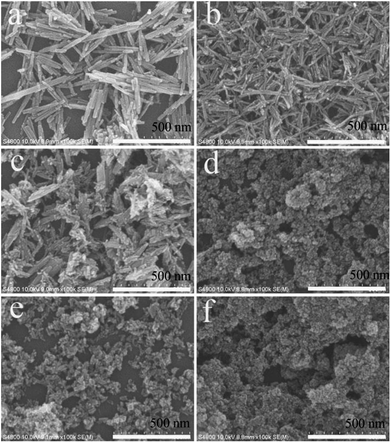 | ||
| Fig. 4 SEM images of the LaPO4 nanostructures prepared with different citrate concentration: (a) 0, (b) 0.2, (c) 0.5, (d) 0.8, (e) 1.0, (f) 3.0 mmol. | ||
In our reaction system, the monoclinic phase LaPO4 could be successfully prepared with citrate-induced at low temperature. When the citrate concentration was 0.8 mmol, the monoclinic phase LaPO4 was obtained. Citrate served as ligand and chelating agent of the La3+ ions, it might result in the growth of initial monoclinic LaPO4 particles.21 However, when the citrate concentration was increased to 0.9 mmol, the mixed hexagonal and monoclinic phase was obtained. The citrate concentration was further increased to 1.5 mmol, the hexagonal phase LaPO4 was formed, the phase transformation cannot complete. In addition, we also investigated the effect of citrate concentration on the phase transformation of CePO4. Firstly, we found that the hexagonal phase CePO4 was prepared when the reaction temperature was 100 °C and the citrate concentration varying from 0.0 mmol to 3.0 mmol (Fig. S1†). Subsequently, when the reaction temperature was increased to 150 °C and the citrate concentration was increased from 0.0 mmol to 3.0 mmol, XRD patterns of the CePO4 was showed in Fig. 5. If the CePO4 was prepared without citrate, all the diffraction peaks would agree well with hexagonal CePO4 (JCPDS 34-1380). With the citrate concentration increasing to 0.2 mmol, the mixed hexagonal and monoclinic phase appeared (Fig. 5b). Fig. 5c showed that the diffraction of monoclinic phase enhanced gradually while citrate was 1.0 mmol. Furthermore, the citrate concentration increased to 1.2 mmol, all diffraction peaks can be indexed to monoclinic CePO4 (JCPDS 32-0199), with no hexagonal phases being observed (Fig. 5d). When citrate increased to 2.0 mmol, diffraction peaks of the mixed hexagonal and monoclinic phase appeared again (Fig. 5e). Up to 3.0 mmol citrate concentration, the product completely transformed into pure hexagonal phase (Fig. 5f). The experimental result showed that the monoclinic phase CePO4 prepared with 1.2 mmol citrate-induced at 150 °C. However, if the citrate concentration was higher than 1.2 mmol, the monoclinic phase CePO4 cannot be obtained. It further confirms that the citrate concentration have remarkable impact on CePO4 transformation. While the citrate concentration was increased, it was possible to increase pH value of the solution. The phase transformation will be influenced by pH value of reaction solution. Therefore, pH values of the reaction solution were further measured at different reaction stages times (Table 1). It can be seen that pH values of reaction solution increased with increasing the citrate concentration. The reaction environment of La3+ ions and PO43− began changing when the citrate concentration was higher. When the citrate concentration was 0.8 mmol, pH (2) value was 1.69, the monoclinic phase LaPO4 was synthesized by a citrate-induced at 100 °C. Interestingly, as the citrate concentration was 0.9 mmol, pH (2) value was 1.88, the mixed hexagonal and monoclinic phase LaPO4 could be obtained. Then the pure hexagonal phase was synthesized when the citrate concentration was 1.5 mmol and pH (2) value was 3.57. Therefore, pH values of reaction solution increases with increasing the citrate concentration, which disturb the citrate-induced function, and the phase transformation cannot complete.
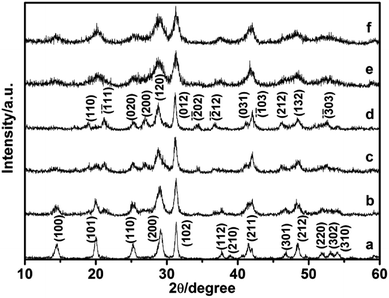 | ||
| Fig. 5 XRD pattern of the CePO4 prepared with different citrate concentration: (a) 0, (b) 0.2, (c) 1.0, (d) 1.2, (e) 2.0, (f) 3.0 mmol. | ||
| Samples | La3+(mol L−1) | Citrate (mmol) | pH (1) | pH (2) | Samples structure |
|---|---|---|---|---|---|
| a pH (1) was the pH value of the reaction solution after citrate added to La(NO3)3 solution, and pH (2) was the pH value of the reaction solution after added H3PO4. | |||||
| SM1 | 1.0 | 0.0 | 4.92 | 1.08 | Hexagonal phase |
| SM2 | 1.0 | 0.2 | 4.47 | 1.14 | Mixed hexagonal and monoclinic phase |
| SM3 | 1.0 | 0.5 | 4.25 | 1.34 | Mixed hexagonal and monoclinic phase |
| SM4 | 1.0 | 0.8 | 4.28 | 1.69 | Monoclinic phase |
| SM5 | 1.0 | 0.9 | 4.36 | 1.88 | Mixed hexagonal and monoclinic phase |
| SM6 | 1.0 | 1.0 | 4.70 | 2.20 | Mixed hexagonal and monoclinic phase |
| SM7 | 1.0 | 1.2 | 4.93 | 2.32 | Mixed hexagonal and monoclinic phase |
| SM8 | 1.0 | 1.5 | 5.82 | 3.57 | Hexagonal phase |
| SM9 | 1.0 | 2.0 | 6.25 | 4.24 | Hexagonal phase |
To further understand the pH values influence on the phase transformation of the products, the comparative experiments were employed using ammonia or nitric acid to adjust the pH value without citrate-induced. If the products prepared without citrate-induced, the hexagonal phase LaPO4 could be obtained at 100 °C (Fig. S2a†), and the mixed hexagonal and monoclinic phase was prepared at 150 °C (Fig. S2b†). At 170 °C, the product was monoclinic phase (Fig. S2c†). Subsequently, when the reaction temperature was 100 °C and 170 °C, the products prepared with hydrothermal route using 0.1 mol dm−3 H3PO4 and La(NO3)3 as reactant using ammonia or nitric acid to adjust the pH value of the reaction solution. Fig. S3 and S4† showed XRD pattern of LaPO4 obtained at 100 °C and 170 °C with different pH value. When the reaction temperature was 100 °C, and pH values were 1.0, 5.0, 7.0, and 9.0, all diffraction peaks of the products coincided with hexagonal phase (Fig. S3†). With the reaction temperature increasing to 170 °C and pH = 1.0, the monoclinic phase LaPO4 was synthesized (Fig. S4a†). However, if the pH values of reaction system were greater than 2.0, all products would exhibit hexagonal phase structure (Fig. S4b–e†). The monoclinic phase LaPO4 could be synthesized without citrate-induced at 170 °C, but pH value of the reaction system should be smaller than 2.0. The pH value would be higher than 1.69 when the concentration of citrate was greater than 0.8 mmol. Furthermore, We found that the citrate-induced function would become unavailable under this condition. That is, the pure monoclinic phase LaPO4 cannot be obtained and the hexagonal phase LaPO4 was synthesized.
Therefore, we suggest a possible formation mechanism of the influence of citrate on phase transformation based on the above results (Fig. 6). First, when the citrate concentration increased to 0.8 mmol, the hexagonal phase LaPO4 transformed into monoclinic phase. During the process of synthesis, pH value was 1.69. The citrate possesses three carboxylic functional groups, which chelated with RE3+ ions to form RE-citrate complex. Then RE-citrate complex reacted with PO43− to produce REPO4 via the substitution reaction after adding the phosphorus source H3PO4. In the reaction procedure, the presence of citrate complexes caused the RE3+ to be slowly released.21 It is quite possible that the substituted citrate ions are adsorbed onto the surface of the initially formed tiny hexagonal REPO4 nanoparticles around RE3+ cation, which might result in the growth of initial monoclinic REPO4 particles.20 Second, if the citrate concentration increasing higher than 0.8 (pH > 1.69), the condition would not conducive to the preferential growth of monoclinic phase nanoparticles. Third, with the citrate concentration increased from 0.9 mmol to 1.2 mmol (pH = 1.88–2.32), the mixed hexagonal phase and monoclinic phase LaPO4 was obtained. Finally, when the citrate concentration was higher than 1.5 mmol (pH > 3.57), the hexagonal phase LaPO4 was synthesized but the monoclinic phase LaPO4 could not be obtained.
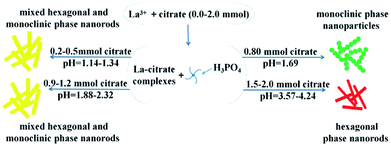 | ||
| Fig. 6 The crystal growth mechanism of the LaPO4 nanostructures with hexagonal and monoclinic phase. | ||
3.2 Photoluminescence properties
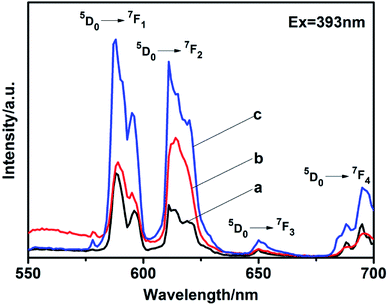
5% Eu3+-doped LaPO4 with different phase prepared by citrate-induced. We found that the addition of 5% Eu3+ to the raw La3+ solution did not affect the crystalline structure (Fig. S5†). EDX analysis clearly indicated the presence of specific dopant Eu3+ ion in the synthesized product (Fig. S6†). It can be confirmed by the content of the elements shown in EDX that the synthesized product was La0.95PO4:Eu0.05.The photoluminescence (PL) spectra were measured at room temperature. The excitation peak of the products centered at 393 nm (Fig. S7†). Fig. 7 exhibits the emission spectra of LaPO4:Eu with different phase under excitation at 393 nm. The emission spectra exhibits four characteristic emission lines, which were attributed to the 5D0 → 7FJ (J = 1–4) transitions of Eu3+. The magnetic dipole transition (5D0 → 7F1) occupied a dominate position in as-synthesized hexagonal phase (Fig. 7a and c). It is known that while the Eu3+ is in the symmetry center of the lattice, the electric dipole transition is forbidden, the intensity of the 5D0 → 7F2 transition band in the emission spectra is weak, the intensity of the 5D0 → 7F1 transition band is strong.26,27 In addition, the emission peaks split to multi-peaks. It was due to that the perturbation of the crystal field and the change of the local site symmetry, the degeneracy of 7FJ (J = 1–4) energy level was resolved.28 However, the monoclinic phase prepared with citrate-induced has higher intensity at the electric dipole transition (5D0 → 7F2) than that at the magnetic dipole transition (5D0 → 7F1), which means Eu3+ is in a site with no inversion center (Fig. 7b).29–31 While the absolute quantum yield of the monoclinic phase LaPO4:Eu is 10.71%. Moreover, the emission intensity of the hexagonal phase prepared with citrate-induced is stronger than that of the hexagonal phase prepared without citrate. The absolute quantum yield of the hexagonal phase LaPO4:Eu prepared with citrate-induced is 14.73%, while the hexagonal phase LaPO4:Eu prepared without citrate is 9.24%. The size, morphology and structure maybe also influenced the photoluminescence intensities.32–35 The photoluminescence fitting curves of LaPO4:Eu with different phase were also recorded, as shown in Fig. S8.† The calculated average lifetime (τ) was 0.82 ms for the monoclinic phase LaPO4:Eu prepared with citrate-induced. Furthermore, the calculated average lifetimes (τ) were 1.83 ms and 1.51 ms for the hexagonal phase LaPO4:Eu prepared with citrate-induced and without citrate, respectively.
4 Conclusions
In this paper, we have developed a low temperature and citrate-induced hydrothermal route for the crystal growth of monoclinic phase LaPO4 and LaPO4:Eu nanostructures. The conclusions of the research were as follows: (1) when the monoclinic phase LaPO4 was synthesized through hydrothermal route at 170 °C, the pH value of reaction system should be less than or equal to 1.0. (2) The monoclinic phase LaPO4 was controlled synthesized through citrate-induced at 100 °C, when the concentration of citrate was 0.8 mmol. High concentration of citrate would result in the pH value of the reaction system higher than 1.88, which cannot synthesize the monoclinic phase LaPO4 with citrate-induced. The hexagonal phase LaPO4 was obtained. (3) Significantly, the photoluminescence properties demonstrate that the electric dipole transition (5D0 → 7F2) is stronger than the magnetic dipole transition (5D0 → 7F1) for the monoclinic phase LaPO4:Eu prepared with citrate-induced. The hexagonal phase LaPO4:Eu with citrate-induced have stronger emission intensity than the hexagonal phase LaPO4:Eu without citrate-induced. Due to low temperature synthesis method of this system and the effective control over the phase transformation it has achieved, we suppose this study may have broad application prospects in exploring crystal growth process.Conflicts of interest
There are no conflicts to declare.Acknowledgements
This work was supported by the National Natural Science Foundations of China (21766021); the Major projects of Natural Science Foundations of Inner Mongolia Science Foundation (2015ZD01); and the Natural Science Foundations of Inner Mongolia Science Foundation (2015MS0502).Notes and references
- S. Heer, O. Lehmann, M. Haase and H. U. Güdel, Angew. Chem., Int. Ed., 2003, 42, 3179–3182 CrossRef CAS PubMed.
- A. I. Becerro, S. Rodríguez-Liviano, A. J. Fernández-Carrión and M. Ocaña, Cryst. Growth Des., 2013, 13, 526–535 CrossRef CAS.
- G. F. Ju, Y. H. Hu, L. Chen, X. J. Wang, Z. F. Mu, H. Y. Wu and F. W. Kang, J. Alloys Compd., 2011, 509, 5655–5659 CrossRef CAS.
- K. Park and M. H. Heo, J. Alloys Compd., 2011, 509, 9111–9115 CrossRef CAS.
- S. H Lee, K. Teshima, S. Mori, M. Endo and S. J. Oishi, Cryst. Growth Des., 2010, 10, 1693–1698 CrossRef.
- B. Sun and H. Sirringhaus, Nano Lett., 2005, 5, 2408–2413 CrossRef CAS PubMed.
- M. F. Dumont, C. Baligand, Y. C. Li, E. S. Knowles, M. W. Meisel, G. A. Walter and D. R. Talham, Bioconjugate Chem., 2012, 23, 951–957 CrossRef CAS PubMed.
- R. X. Yan, X. M. Sun, X. Wang, Q. Peng and Y. D. Li, Chem.–Eur. J., 2005, 11, 2183–2195 CrossRef CAS PubMed.
- Y. P. Fang, A. W. Xu, R. Q. Song, H. X. Zhang, L. P. You, J. C. Yu and H. Q. Liu, J. Am. Chem. Soc., 2003, 125, 16025–16034 CrossRef CAS PubMed.
- K. S. Gavrichev, M. A. Ryumin, A. V. Tyurin, A. V. Khoroshilov, L. P. Mezentseva, A. V. Osipov, V. L. Ugolkov and V. V. Gusarov, J. Therm. Anal. Calorim., 2010, 102, 809–811 CrossRef CAS.
- Y. J. Zhang and H. M. Guan, J. Cryst. Growth, 2003, 256, 156–161 CrossRef CAS.
- S. Z. Lin, X. T. Dong, R. K. Jia and Y. L. Yuan, J. Mater. Sci.: Mater. Electron., 2010, 21, 38–44 CrossRef CAS.
- C. R. Kesavulu, C. Basavapoornima, C. S. Dwaraka Viswanath and C. K. Jayasankar, J. Lumin., 2016, 171, 51–57 CrossRef CAS.
- K. Riwotzki, H. Meyssamy, A. Kornowski and M. Haase, J. Phys. Chem. B, 2000, 104, 2824–2828 CrossRef CAS.
- T. Huang, S. R. Shieh, A. Akhmetov, X. Liu, C. M. Lin and J. S. Lee, Phys. Rev. B: Condens. Matter Mater. Phys., 2010, 81, 214117 CrossRef.
- D. Errandonea, J. Pellicer-Porres, F. J. Manjón, A. Segura, Ch. Ferrer-Roca, R. S. Kumar, O. Tschauner, P. Rodríguez-Hernández, J. López-Solano, S. Radescu, A. Mujica, A. Muñoz and G. Aquilanti, Phys. Rev. B: Condens. Matter Mater. Phys., 2005, 72, 174106 CrossRef.
- J. M. Heuser, R. I. Palomares, J. D. Bauer, M. J. Lozano Rodriguez, J. Cooper, M. Lang, A. C. Scheinost, H. Schlenz, B. Winkler, D. Bosbach, S. Neumeier and G. Deissmann, J. Eur. Ceram. Soc., 2018, 38, 4070–4081 CrossRef CAS.
- M. A. Musselman, T. M. Wilkinson, B. Haberl and C. E. Packard, J. Am. Ceram. Soc., 2018, 101, 2562–2570 CrossRef CAS.
- F. Luo, C. J. Jia, W. Song, L. P. You and C. H. Yan, Cryst. Growth Des., 2005, 5, 137–142 CrossRef CAS.
- J. R. Bao, R. B. Yu, J. Y. Zhang, D. Wang, J. X. Deng, J. Chen and X. R. Xing, Scr. Mater., 2010, 62, 133–136 CrossRef CAS.
- N. O. Nuñez, S. R. Liviano and M. Ocaña, J. Colloid Interface Sci., 2010, 349, 484–491 CrossRef PubMed.
- J. Q. Hu, Q. Chen, Z. X. Xie, G. B. Han, R. H. Wang, B. Ren, Y. Zhang, Z. L. Yang and Z. Q. Tian, Adv. Funct. Mater., 2004, 14, 183–189 CrossRef CAS.
- X. H. Ji, X. N. Song, J. Li, Y. B. Bai, W. S. Yang and X. G. Peng, J. Am. Chem. Soc., 2007, 129, 13939–13948 CrossRef CAS PubMed.
- W. H. Di, M. G. Willinger, R. A. S. Ferreira, X. G. Ren, S. Z. Lu and N. Pinna, J. Phys. Chem. C, 2008, 112, 18815–18820 CrossRef CAS.
- L. Zhang, L. L. Fu, X. X. Yang, Z. L. Fu, X. D. Qi and Z. J. Wu, J. Mater. Chem. C, 2014, 2, 9149–9158 RSC.
- Y. G. Yang, Mater. Sci. Eng., B, 2013, 178, 807–810 CrossRef CAS.
- C. Zollfrank, H. Scheel, S. Brungs and P. Greil, Cryst. Growth Des., 2008, 8, 766–770 CrossRef CAS.
- Y. H. Zheng, H. P. You, G. Jia, K. Liu, Y. H. Song, M. Yang and H. J. Zhang, Cryst. Growth Des., 2009, 9, 5101–5107 CrossRef CAS.
- X. Y. Huang, H. Guo and B. Li, J. Alloys Compd., 2017, 720, 29–38 CrossRef CAS.
- X. Y. Huang, B. Li, H. Guo and D. Q. Chen, Dyes Pigm., 2017, 143, 86–94 CrossRef CAS.
- P. Du, X. Y. Huang and J. S. Yu, Chem. Eng. J., 2018, 337, 91–100 CrossRef CAS.
- M. Wang, Q. L. Huang, J. M. Hong, X. T. Chen and Z. L. Xue, Cryst. Growth Des., 2006, 6, 1972–1974 CrossRef CAS.
- J. Geng, Y. N. Lv, D. J. Lu and J. J. Zhu, Nanotechnology, 2006, 17, 2614–2620 CrossRef CAS PubMed.
- X. C. Wu, Y. R. Tao, C. Y. Song, C. J. Mao, L. Dong and J. J. Zhu, J. Phys. Chem. B, 2006, 110, 15791–15796 CrossRef CAS PubMed.
- L. M. Chen, Y. N. Liu and K. L. Huang, Mater. Res. Bull., 2006, 41, 158–166 CrossRef CAS.
Footnote |
| † Electronic supplementary information (ESI) available. See DOI: 10.1039/c8ra07260d |
| This journal is © The Royal Society of Chemistry 2018 |

