 Open Access Article
Mechanistic study of 1,1-dimethylhydrazine transformation over Pt/SiO2 catalyst†
Andrei V. Smirnov *ab,
Pavel A. Kots
 a,
Maksim A. Panteleyev
 a and
Irina I. Ivanova
 ab
ab
aDepartment of Chemistry, Lomonosov Moscow State University, Leninskiye Gory 1, bld. 3, 11991, Moscow, Russia
bA.V. Topchiev Institute of Petrochemical Synthesis, Leninskiye prospect 29, 11991, Moscow, Russia
First published on 1st November 2018
Abstract
Catalytic oxidation of 1,1-dimethylhydrazine (UDMH) with molecular oxygen over Pt/SiO2 was studied by in situ FTIR spectroscopy coupled with online MS monitoring of the gas phase. An unusual two-step oxidation process was detected in experiments with the pulse UDMH feeding: initial UDMH oxidation over a fresh platinum surface quickly terminates due to the blockage of active sites; a time-separated second oxidation step corresponds to combustion of the surface residue. This residue consists of C![[triple bond, length as m-dash]](https://www.rsc.org/images/entities/char_e002.gif) N nitrile groups formed via decomposition of the products of non-oxidative UDMH conversion, such as dimethylamine. The two-step oxidation picture is observed over a broad range of reaction temperatures and oxygen to UDMH ratios.
N nitrile groups formed via decomposition of the products of non-oxidative UDMH conversion, such as dimethylamine. The two-step oxidation picture is observed over a broad range of reaction temperatures and oxygen to UDMH ratios.
Introduction
1,1-Dimethylhydrazine (unsymmetrical dimethylhydrazine, UDMH) is a highly toxic volatile compound, widely used as a component of rocket fuel. Neutralization of UDMH in air at spillages and utilization of excessive amounts of UDMH is an important ecological problem that can be solved by catalytic oxidation of UDMH by molecular oxygen with formation of non-toxic products.1Due to the exceptional reactivity of UDMH, its gas-phase catalytic oxidation is a complex process involving a number of parallel and consecutive reactions. Information about UDMH activation, transformation and interaction with the catalyst surface is not well understood in view of the enormous set of reaction products. That’s the reason why it is difficult to establish the structure and interconversion of the surface intermediates formed over oxidation catalysts.
Oxidative transformation of UDMH in water is rather well established2 while a limited number of studies are focused on gas-phase catalytic oxidation. Catalysts for conversion of hydrazine and its methyl-containing derivatives are noble metals, Fe-, Cu-, Cr-, Zr-, Mo-, W-containing oxides, nitrides, carbides and others.3–7 Among them platinum deposited on alumina showed high catalytic activity in UDMH oxidation. Also, the product distribution was found to be sensitive to the exact type of catalyst. In particular, nitrogen oxides (NOx) selectivity over Pt is higher in comparison with other catalysts. Moreover, the concentration of CO2 as a product of complete oxidation is sharply raised in the temperature range 280–300 °C from almost zero to the maximum level, while for non-platinum catalysts CO2 concentration at the outlet increased monotonically.6,7 The reason for these effects is definitely connected with peculiarities of UDMH transformation over the Pt surface but it has not been discussed in detail. However, mechanistic insights are important for understanding the oxidation processes and selectivity control.
The surface chemistry of UDMH in non-oxidative transformation on Pt in a temperature-programmed regime was studied in ref. 8. UDMH decomposition was described in terms of N–N bond breaking and formation of amino and dimethyl amino groups. Hydrogenation of amino groups led to ammonia desorption; other products detected in the gas phase were HCN, C2N2, N2 and surface C. Since reaction products were detected under ultrahigh vacuum conditions, these results cannot be directly transferred to real “working” conditions.
FTIR spectroscopy is a useful tool to investigate compounds formed on the catalyst surface and follow successive transformation of different reaction products.9–11 In situ FTIR spectroscopy was successfully used for the study of photocatalytic oxidation of UDMH in a batch reactor over TiO2 as the photocatalyst.12 Adsorbed N2O species were detected as the main surface intermediate. It was concluded that accumulation of surface nitrates was responsible for catalyst deactivation in the long-term process.
Adsorption and oxidation of UDMH on the surface of the supported spinel (20%) CuxMg1−xCr2O4/Al2O3 was studied by FTIR spectroscopy in ref. 13. An increase in the adsorption temperature from 200 to 300 °C resulted in the appearance of the bands above 2000 cm−1 attributed to C![[triple bond, length as m-dash]](https://www.rsc.org/images/entities/char_e002.gif) N bonds pointing to some surface reactions. In the presence of oxygen at 200 °C these bands along with the band characteristic for adsorbed dimethylamine (DMA) were also observed. While at 300 °C only adsorbed water as a product of complete oxidation was present on the surface. Thus, catalytic oxidation of UDMH is accompanied by formation of some intermediate products which can be detected in an adsorbed state by FTIR spectroscopy. These species may serve as spectators or catalyst poisons due to irreversible binding to metal sites, or on the contrary participate in oxidation as true reaction intermediates. The exact role of those species in oxidation catalysis and their impact on the state of Pt sites under working conditions are not well understood yet.
N bonds pointing to some surface reactions. In the presence of oxygen at 200 °C these bands along with the band characteristic for adsorbed dimethylamine (DMA) were also observed. While at 300 °C only adsorbed water as a product of complete oxidation was present on the surface. Thus, catalytic oxidation of UDMH is accompanied by formation of some intermediate products which can be detected in an adsorbed state by FTIR spectroscopy. These species may serve as spectators or catalyst poisons due to irreversible binding to metal sites, or on the contrary participate in oxidation as true reaction intermediates. The exact role of those species in oxidation catalysis and their impact on the state of Pt sites under working conditions are not well understood yet.
In the present work in situ FTIR spectroscopy coupled with MS detection of reaction products was used to study non-oxidative and oxidative UDMH conversion on Pt/SiO2 catalyst via dynamic analysis of the residue formation, transformation and degradation.
Experimental
The Pt/SiO2 sample with a platinum content of 3 wt% was prepared by incipient wetness impregnation of 3 g of silica (0.25–0.5 mm fraction, specific surface area of 110 m2 g−1) with 3 ml of 0.15 M [Pt(NH3)4]Cl2 solution followed by drying at 110 °C for 24 h and calcination at 500 °C for 3 h.Interaction of UDMH with the catalyst surface was studied by in situ FTIR-spectroscopy. The setup for spectroscopic measurements included a Thermo iS-10 FTIR-spectrometer and heated flow cell (dead volume 1 cm3) described in ref. 14. The cell was equipped with IR transparent CaF2 windows and was used simultaneously as a reactor and IR cell. Gases at the outlet of the cell were analyzed by mass-spectrometer MS7-200.
Prior to in situ FTIR experiments the sample of the catalyst was pelletized into a 2 cm2 self-supported wafer ca. 10 mg cm−2 density. The wafer was placed in the IR cell and purged in He or O2/He flows 20 ml min−1 at 260 °C. UDMH was pulsed by syringe into the gas flow at the IR cell inlet. IR spectra were registered in the 1000–4000 cm−1 range with 4 cm−1 resolution, in situ FTIR spectra were measured with a 3 s acquisition time.
Catalytic experiments with variation of reaction conditions, such as reaction temperature, oxygen concentration and amount of UDMH introduced in the pulsed mode, were performed in the tubular quartz reactor with 30 mg catalyst loading. Gas flow rate was maintained at 10 ml min−1, molar oxygen content in O2/He mixtures was varied from 2 to 20%, the volume of UDMH pulses was 0.05–2.0 μl, the influence of temperature was studied in the range of 250–450 °C. Reaction products were analyzed by an online MS detector; ion current of m/z for individual ions was continuously monitored, overlapping signals were corrected.
Results and discussion
Catalytic oxidation of UDMH on Pt/SiO2
Oxidative conversion of UDMH over Pt/SiO2 catalyst was performed at 260 °C in a flow of 3% O2 in He. UDMH was fed into the reactor in the pulse regime, which allows the provision of more detailed information about the initial stages of the reaction and intermediate products in comparison with the flow mode.This list of reaction products correlates well with results of numerous studies.1,8,15 MS detection (Fig. 1) revealed the oxygen uptake (m/z = 32) with appearance of total oxidation products as CO2 (m/z = 44) and water (m/z = 18, 17) along with nitrogen (m/z = 28) and hydrogen (m/z = 2). Then other reaction products were also detected, namely dimethylamine (DMA) (CH3)2NH (m/z = 44, 45), ammonia NH3 (m/z = 16, 17), methanol CH3OH (m/z = 31, 32, 29), formaldehyde CH2O (m/z = 28, 29, 30), nitrogen oxides NOx (m/z = 30), formaldehyde dimethylhydrazone (CH3)2NNCH2 (m/z = 72), dimethyldiazene (CH3)2NN (m/z = 43, 58) and hydrocyanic acid HCN (m/z = 27, 26). Conversion of UDMH was close to 100% (m/z = 60).
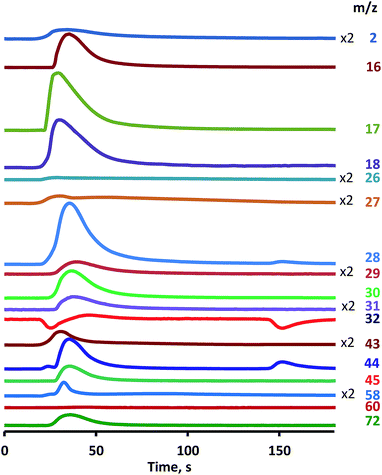 | ||
| Fig. 1 UDMH conversion over Pt/SiO2 catalyst. O2 (3%) He flow, single UDMH pulse, 260 °C, mass-spectrometric detection of reaction products. | ||
Identification of reaction products was based on evaluation of the ion current intensity ratios for different ions. So, the first and third peaks on the curve with m/z = 44 are attributed to CO2, while the second peak is associated with DMA as it totally correlates with the peak on the m/z = 45 curve having intensity ratio characteristics for DMA. Negative peaks on the curve m/z = 32 correspond to oxygen consumed for oxidation, while the appearance of a positive peak indicates the presence of methanol at the outlet as evidenced by similar changes in the concentration of the ion with m/z = 31. Ammonia was identified on m/z = 16, 17 ions taking into account that the m/z = 17 ion also corresponds to water and the m/z = 16 ion presents in the spectra of various compounds, for example, methane or oxygen.
Analysis of the main features of UDMH conversion revealed a very unusual effect of a two-step oxidation process, as was mentioned in our previous work.16 After UDMH pulsing the peak of oxygen consumption was observed, and then oxygen concentration returned to the initial level. However, after a rather extended period the second stage of oxygen consumption occurs, accompanied by the release of molecular nitrogen, NOx and CO2.
This two-peak shape oxidation indicates that complex processes occur on the surface of the catalyst. Without an understanding of these processes it is impossible to draw up a reliable scheme of UDMH oxidation on Pt-containing catalysts. More detailed information about the intermediate products can be obtained by in situ FTIR spectroscopy performed at the same reaction conditions. The role of the catalyst support as well as peculiarities of the UDMH conversion on Pt/SiO2 catalyst in non-oxidative and oxidative conditions were successively studied using this technique.
Formation of heavy residues during UDMH conversion on Pt/SiO2 under non-oxidative conditions
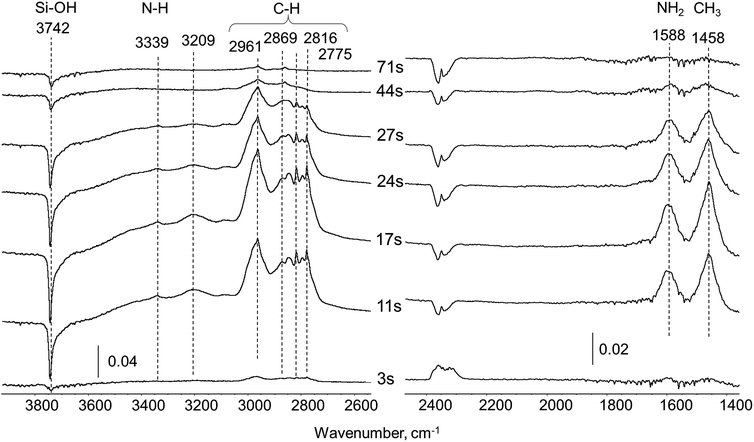 | ||
| Fig. 2 Difference in situ FTIR spectra of silica carrier exposed to UDMH pulse (0.5 μl) in 20 ml min−1 He flow at 260 °C. | ||
All bands observed in the spectra can be assigned to well-known UDMH vibrations.17 Bands at 3339 and 1588 cm−1 correspond to asymmetric stretching and deformation of the NH2 group of UDMH, respectively. The group of unresolved bands in the 3050–2700 cm−1 region are coupled with CH3 asymmetric and symmetric stretching (ν5 at 2961, ν7 at 2816 and ν8 at 2775) and overlapping combination band at 2869 cm−1. Deformation vibration of CH3 groups also appears at 1458 cm−1. The broad band at 3209 cm−1 could be explained through formation of dimeric species with hydrogen bonding (N–H⋯N)17 or by the (N–H⋯OSi) interaction between NH2-groups and surface silanols. A negative band at 3742 cm−1 due to perturbed Si–OH groups of the silica is clearly seen. The intensity of the 3742 cm−1 band changes with time in accordance with UDMH bands, indicating that Si–OH groups participate in UDMH adsorption most probably via hydrogen bonding. For the first 3–11 seconds after the pulse all UDMH bands increase in intensity due to UDMH accumulation over the silica pellet. Minor fluctuations in the CO2 vibration intensity at ca. 2350 cm−1 in this time interval lie within noise level. Then for 17–44 seconds the amount of UDMH adsorbed gradually decreases because of relatively weak interaction with the surface. Prolongation of the flushing with the helium flow for 71 second leads to complete disappearance of all bands corresponding to UDMH. This reveals no residue formation and confirms that the surface of silica remains intact after contact with UDMH in non-oxidative conditions.
Thus, there are no visible signs of UDMH transformation over silica indicating that the carrier is completely inert. In correlation with this observation, MS analysis of the gas flow at the outlet of the IR-cell revealed the presence of pure UDMH. So we assume all further UDMH transformation products over Pt/SiO2 catalyst originate through interaction with Pt sites.
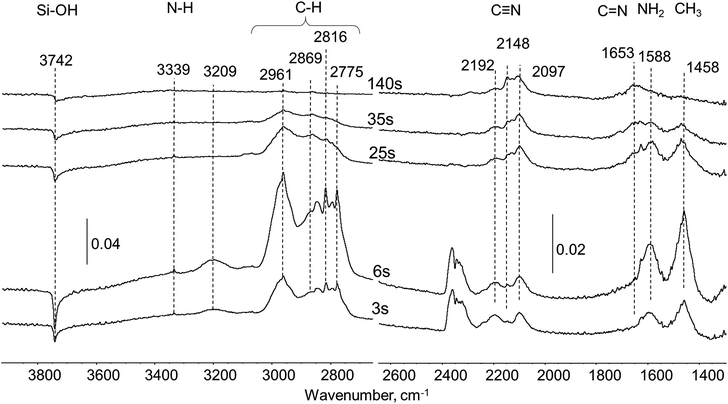 | ||
| Fig. 3 Difference in situ FTIR spectra of Pt/SiO2 sample exposed to UDMH pulse in He flow at 260 °C. | ||
Also, during the first 3–6 seconds after the UDMH pulse, the emission of CO2 was detected at ca. 2340 cm−1 (Fig. 3). As the Pt/SiO2 sample was used without preliminary reduction it could be proposed that some adsorbed oxygen can participate in UDMH oxidation as was previously observed for other molecules, in particular, HCN adsorbed onto fresh Pt-containing catalysts.18 In contrast to the experiment with pure silica, new bands due to products of UDMH transformation on Pt/SiO2 appear in the spectra already after 3 seconds. A broad and asymmetric band at 1653 cm−1 is coupled with C![[double bond, length as m-dash]](https://www.rsc.org/images/entities/char_e001.gif) N double bonds in imine-like surface species formed via dehydrogenation of UDMH.19,20 This band remains in the spectra even after the disappearance of the bands corresponding to molecularly adsorbed UDMH. A group of bands in the 2050–2250 cm−1 region have been previously observed and assigned to C
N double bonds in imine-like surface species formed via dehydrogenation of UDMH.19,20 This band remains in the spectra even after the disappearance of the bands corresponding to molecularly adsorbed UDMH. A group of bands in the 2050–2250 cm−1 region have been previously observed and assigned to C![[triple bond, length as m-dash]](https://www.rsc.org/images/entities/char_e002.gif) N groups.13 So, bands at 2192, 2148 and 2097 cm−1 could be corresponding to different nitrile species overlaying the Pt surface.8,21 The variation of the position of these bands could be explained by the diverse nature of the nitrile surface deposits. Some of them may form chains with unsaturated C
N groups.13 So, bands at 2192, 2148 and 2097 cm−1 could be corresponding to different nitrile species overlaying the Pt surface.8,21 The variation of the position of these bands could be explained by the diverse nature of the nitrile surface deposits. Some of them may form chains with unsaturated C![[double bond, length as m-dash]](https://www.rsc.org/images/entities/char_e001.gif) N and C
N and C![[triple bond, length as m-dash]](https://www.rsc.org/images/entities/char_e002.gif) N fragments.
N fragments.
Nitrile and some isomeric species were observed over transition metal surfaces with similar C![[triple bond, length as m-dash]](https://www.rsc.org/images/entities/char_e002.gif) N triple bond wavenumbers. The strong interaction of the CN group with metal sites causes a decrease in nitrile vibration from the typical 2245 cm−1 to ca. 2100 cm−1 for surface Au nitriles, observed by Bamwenda et al.22 For nitrile metal-complexes of platinum in liquid phase the typical band position lies also at relatively low wavenumbers at ca. 2192–2165 cm−1.23 It also should be noted that C
N triple bond wavenumbers. The strong interaction of the CN group with metal sites causes a decrease in nitrile vibration from the typical 2245 cm−1 to ca. 2100 cm−1 for surface Au nitriles, observed by Bamwenda et al.22 For nitrile metal-complexes of platinum in liquid phase the typical band position lies also at relatively low wavenumbers at ca. 2192–2165 cm−1.23 It also should be noted that C![[triple bond, length as m-dash]](https://www.rsc.org/images/entities/char_e002.gif) N vibration in cyanogen (C2N2) at 2168 cm−1 (ref. 23) is close to bands observed in this study.
N vibration in cyanogen (C2N2) at 2168 cm−1 (ref. 23) is close to bands observed in this study.
Considering the origin of several types of surface nitriles with corresponding band positions at 2097, 2148 and 2192 cm−1 band maxima in our case, one can assume the following two reasons: (i) differences in Pt surface atoms coordination (edge, corner atoms or various crystallographic facets) give rise to a distribution of nitrile ligands attached to those sites; (ii) different degree of conjugation within CxNy polymeric chains, so the C![[triple bond, length as m-dash]](https://www.rsc.org/images/entities/char_e002.gif) N wavenumber is decreased in longer and more conjugated species.24 Interestingly, redistribution in intensity within a group of bands in the 2050–2250 cm−1 region was observed. The band at ca. 2148 cm−1 is a minor shoulder after 3 seconds, but became a dominant feature at 140 seconds after the pulse. Another band at 2097 cm−1 remains constant during the whole time of the experiment, while the band at 2192 cm−1 decreases in intensity. These findings may represent dynamic transformations within the pool of nitrile species on the Pt surface, which could convert from less stable to more stable ones. The total intensity of this group of bands remains unchanged after 140 seconds. Thus, the group of bands at 2050–2250 (C
N wavenumber is decreased in longer and more conjugated species.24 Interestingly, redistribution in intensity within a group of bands in the 2050–2250 cm−1 region was observed. The band at ca. 2148 cm−1 is a minor shoulder after 3 seconds, but became a dominant feature at 140 seconds after the pulse. Another band at 2097 cm−1 remains constant during the whole time of the experiment, while the band at 2192 cm−1 decreases in intensity. These findings may represent dynamic transformations within the pool of nitrile species on the Pt surface, which could convert from less stable to more stable ones. The total intensity of this group of bands remains unchanged after 140 seconds. Thus, the group of bands at 2050–2250 (C![[triple bond, length as m-dash]](https://www.rsc.org/images/entities/char_e002.gif) N) and 1653 cm−1 (C
N) and 1653 cm−1 (C![[double bond, length as m-dash]](https://www.rsc.org/images/entities/char_e001.gif) N) were tentatively assigned as characteristic of deposits.
N) were tentatively assigned as characteristic of deposits.
For the spectrum after 140 seconds, analysis of C–H and N–H stretching in the 3200–2700 cm−1 region and deformation vibrations of NH2 and CH3 groups at 1588 and 1458 cm−1, respectively, indicates nearly total absence of such vibrations in residues. Definitely, strong dehydrogenating properties of Pt eliminate all hydrogen atoms from both CH3 and NH2 groups initially present in the UDMH molecule.
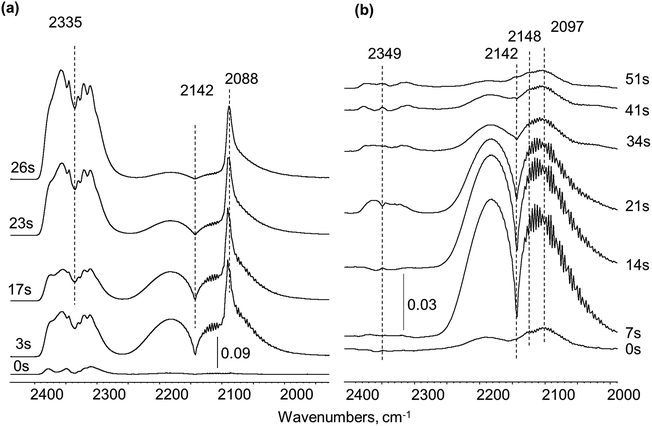 | ||
| Fig. 4 CO pulsing over Pt/SiO2 sample: (a) fresh, (b) pre-covered with residues from UDMH conversion. | ||
In order to probe the accessibility of Pt sites after UDMH treatment, the UDMH pulse was followed by CO injection with ca. 30 seconds interval. UDMH pulsing caused formation of surface debris with characteristic bands maxima at 2148 and 2097 cm−1 (Fig. 4b). Only gaseous CO molecules at 2142 cm−1 were visible in the spectra over the UDMH pre-covered surface. Thus, carbonyls could not be formed after UDMH contact with the Pt/SiO2 catalyst confirming the total platinum blockage with strongly adsorbed deposits.
Thereby, in situ experiments in He flow reveal that heavy residues are formed over Pt/SiO2 in the early stage of UDMH conversion. The concentration of these species on the Pt surface remains constant over 140 s, indicating that these deposits adsorb strongly and are unreactive in non-oxidizing media. FTIR spectroscopic investigation shows that residues contain mostly C![[double bond, length as m-dash]](https://www.rsc.org/images/entities/char_e001.gif) N conjugated bonds and C
N conjugated bonds and C![[triple bond, length as m-dash]](https://www.rsc.org/images/entities/char_e002.gif) N nitrile triple bonds.
N nitrile triple bonds.
In situ FTIR study of UDMH oxidation on Pt/SiO2
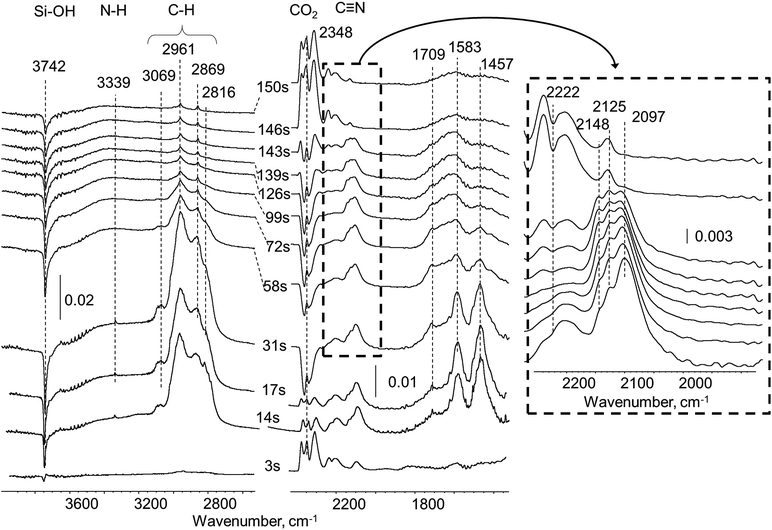
In situ FTIR experiments on UDMH oxidation were performed in helium flow with 3% oxygen. FTIR spectra of the products found on the surface of Pt/SiO2 during UDMH transformation are presented in Fig. 5. The whole process can be divided into three stages: quick oxidation of UDMH in parallel with formation of the residue (0–14 s), elimination of reaction products adsorbed on the silica surface and evolution of residue (17–143 s) and, finally, oxidation of residue (146–150 s). This behavior totally correlates with the two-step oxygen consumption picture observed previously.Extensive formation of CO2 (band centered at 2348 cm−1) and N2O (vibration at 2222 cm−1), with typical for gaseous species27 peak shapes, was observed during the first 3 seconds after the UDMH pulse (Fig. 5). Then generation of carbon and nitrogen oxides declines and after 14 seconds is completely stopped. It is necessary to note that from nitrogen oxides only nitrous oxide is well resolved while mono- and dioxide are hardly detected, but their formation is also possible. Water as one of the possible products of oxidation is not visible in the spectra as its adsorption at the reaction temperature is rather weak.
Simultaneously with UDMH oxidation, formation of the residue takes place from the beginning of the UDMH contact with Pt/SiO2 catalyst. The group of bands characteristic of surface residues in the 2050–2250 cm−1 region (see Fig. 5, inset) have been previously observed over Pt in the case of oxygen-free conditions. For the first seconds after the UDMH pulse the dominant band in this region is the 2097 cm−1 band associated with C![[triple bond, length as m-dash]](https://www.rsc.org/images/entities/char_e002.gif) N nitrile groups. Prolonged exposure for 14–17 seconds leads to additional bands at ca. 2148 and 2125 cm−1 assigned to other nitrile species bonded to Pt. The presence of other forms of surface nitriles at wavenumbers higher than 2200 cm−1 could not be totally ruled out due to overlay with gas phase N2O bands. Band maxima match to values observed in the case of non-oxidative conditions in pure He flow. Analysis of the FTIR spectra reveals that UDMH oxidation and residue formation compete with each other over Pt sites. As a result, termination of CO2 and NOx formation is connected with the total coverage of the Pt surface by nitrile-based deposits after 14 seconds.
N nitrile groups. Prolonged exposure for 14–17 seconds leads to additional bands at ca. 2148 and 2125 cm−1 assigned to other nitrile species bonded to Pt. The presence of other forms of surface nitriles at wavenumbers higher than 2200 cm−1 could not be totally ruled out due to overlay with gas phase N2O bands. Band maxima match to values observed in the case of non-oxidative conditions in pure He flow. Analysis of the FTIR spectra reveals that UDMH oxidation and residue formation compete with each other over Pt sites. As a result, termination of CO2 and NOx formation is connected with the total coverage of the Pt surface by nitrile-based deposits after 14 seconds.
From 17 to 143 seconds the most significant changes in the spectra were recorded in the areas of C–H and N–H vibrations. Already mentioned bands at 2961, 2869, 2816 and 1458 cm−1 due to CH3 groups and 1583 cm−1 due to NH2 groups were observed. More accurate examination reveals that the intensity ratio between various bands in the C–H stretching region significantly differs from pure UDMH observed on the surface of the SiO2 support. We suppose that those C–H vibrations arise not only from UDMH itself, but mostly due to the products of its conversion, namely, DMA. Separate in situ FTIR experiments with DMA pulsing verified that some bands absent in the spectrum of pure unreacted UDMH indeed correspond to DMA molecules (Fig. S1†).
Some new bands attributed to other products of UDMH transformation also appeared. So, the band at 3069 cm−1 corresponds to C–H stretching in the (![[double bond, length as m-dash]](https://www.rsc.org/images/entities/char_e001.gif) C–H) fragment, and could be assigned, for instance, to formaldehyde dimethylhydrazone (CH3)2N–N
C–H) fragment, and could be assigned, for instance, to formaldehyde dimethylhydrazone (CH3)2N–N![[double bond, length as m-dash]](https://www.rsc.org/images/entities/char_e001.gif) CH2. Also, a new broad asymmetric band at 1709 cm−1 arises due to formation of imine-like surface species which could be coupled with C
CH2. Also, a new broad asymmetric band at 1709 cm−1 arises due to formation of imine-like surface species which could be coupled with C![[double bond, length as m-dash]](https://www.rsc.org/images/entities/char_e001.gif) N double bonds.
N double bonds.
Intensities of C–H and N–H vibration bands decreased with time and almost totally vanished by 143 s. The negative band at 3740 cm−1 of Si–OH groups of silica changes in line with the C–H and N–H bands indicating that adsorption of these products occurs mostly via interaction with silanol groups of the carrier surface. The bands of C![[triple bond, length as m-dash]](https://www.rsc.org/images/entities/char_e002.gif) N groups at 2097, 2125 and 2148 cm−1 remained up to 143 seconds after the pulse, revealing their low reactivity. Some changes in intensity distribution between different C
N groups at 2097, 2125 and 2148 cm−1 remained up to 143 seconds after the pulse, revealing their low reactivity. Some changes in intensity distribution between different C![[triple bond, length as m-dash]](https://www.rsc.org/images/entities/char_e002.gif) N vibration bands were observed with time. The intensities of the bands at 2148 cm−1 and 2125 cm−1 grow in the course of the experiment, while the 2097 cm−1 band intensity slightly decreased.
N vibration bands were observed with time. The intensities of the bands at 2148 cm−1 and 2125 cm−1 grow in the course of the experiment, while the 2097 cm−1 band intensity slightly decreased.
Dramatic changes in the spectra were observed from 143 to 146 seconds after the UDMH pulse. In this narrow time interval bands at 2148 cm−1 and 2097 cm−1, characteristic of Pt blocking residue, totally disappeared from the spectrum. Decomposition of the residue is accompanied with emission of gaseous CO2 (2348 cm−1) and N2O (2222 cm−1). A small residual band at 2125 cm−1 remains in the spectrum, indicating the high stability of this type of nitrile.
After the disappearance of C–H and N–H containing substances (unreacted UDMH and some products of its conversion) interacting with silanol groups on the silica support, the CxNy residue removal occurs. This could be traced from the changes in total area of all bands in the C–H stretching (3000–2700 cm−1) and C![[triple bond, length as m-dash]](https://www.rsc.org/images/entities/char_e002.gif) N stretching (2200–2000 cm−1) vibrations (Fig. 6). It could be proposed that the carrier supplies C–H and N–H containing species towards Pt thus maintaining blockage of the platinum surface by newly formed C
N stretching (2200–2000 cm−1) vibrations (Fig. 6). It could be proposed that the carrier supplies C–H and N–H containing species towards Pt thus maintaining blockage of the platinum surface by newly formed C![[triple bond, length as m-dash]](https://www.rsc.org/images/entities/char_e002.gif) N species.
N species.
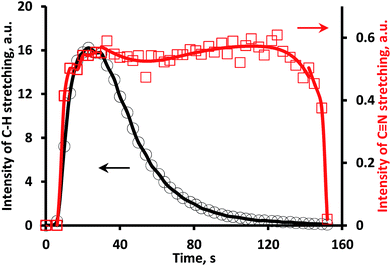 | ||
Fig. 6 Total area of all bands in C–H and C![[triple bond, length as m-dash]](https://www.rsc.org/images/entities/char_e002.gif) N stretching regions vs. time after UDMH pulse in 3%O2/He flow. N stretching regions vs. time after UDMH pulse in 3%O2/He flow. | ||
Mechanism of residue formation and oxidation
Basing on the gas phase products variety detected by MS and adsorbed species registered by in situ FTIR, some consideration about the mechanism of UDMH oxidative transformation on Pt/SiO2 and the nature of the residue could be proposed (Scheme 1).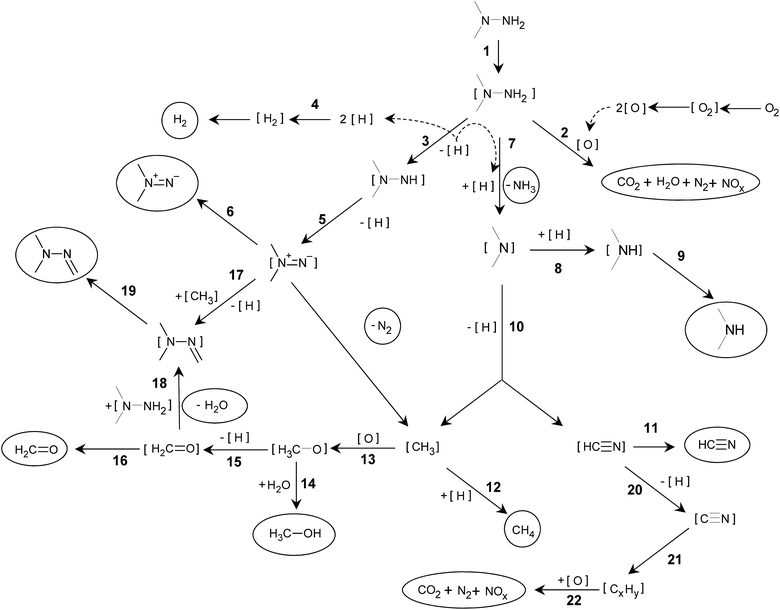 | ||
| Scheme 1 UDMH transformation on Pt/SiO2 catalyst. Substances encircled were detected in the gas phase; adsorbed species are in square brackets. | ||
The first step is UDMH adsorption on Pt (1). Then, two parallel processes can take place on the platinum surface. One is the expected step of direct interaction of UDMH with oxygen atoms adsorbed on Pt (2), resulting in the products of total and partial oxidation. Another way is UDMH dehydrogenation leading to appearance in the gas phase of hydrogen and traces of dimethyldiazene (3–6). According to in situ FTIR data, the oxidation reactions (2) stopped rather quickly as Pt appeared to be blocked by the residue and becomes unavailable for oxygen activation.
Adsorbed hydrogen species [H] generated by dehydrogenation reactions participate in typical for Pt catalysts hydrogenolysis processes, followed by ammonia (7) and DMA (8–9) formation and their release in the gaseous phase. [(CH3)2N] adsorbed species undergo transformation via dehydrogenation and C–N bond cleavage reactions (10) resulting in [HCN] and [CH3] species with further release to the gas phase as HCN (11) and methane (12). Furthermore, [CH3] can be the source of methanol (13, 14) and formaldehyde (15, 16) appearing in the gas phase. Formaldehyde in the gas phase is detected in a very narrow time interval after the UDMH pulse while methanol release becomes significant in line with decreasing formaldehyde content. Apparently, the deactivated Pt surface could not produce dehydrogenation products. Formation of formaldehyde dimethylhydrazone (CH3)2NNCH2 is described by different mechanisms,1,15 other possible ways are also proposed (17–19).
Direct involvement of DMA in residue formation was confirmed by a separate run of DMA conversion over Pt/SiO2 (Fig. S2†). Upon contact with DMA, surface nitrile groups are immediately formed with bands close to typical for UDMH-derived species. Also, residues formed from DMA are stable in oxidizing conditions and the two-step oxidation picture as in the case of UDMH oxidation is observed. So, the DMA-mediated path clearly leads to very similar surface residues according to their reactivity, composition and vibrational spectra.
According to a number of studies, [HCN] formed from adsorbed dimethylamino-groups undergoes dissociation on Pt (20) resulting in [CN] species strongly adsorbed on the Pt surface. It can be considered that these [CN] species could be a building block for oligomerization and formation of cyanogen [(CN)2] and [(CN)x] polymeric species with x > 2 (21). Formation of C![[triple bond, length as m-dash]](https://www.rsc.org/images/entities/char_e002.gif) N nitrile groups in a different environment results in variation of corresponding bands in the 2100–2150 cm−1 region in the IR spectra (Fig. 4).
N nitrile groups in a different environment results in variation of corresponding bands in the 2100–2150 cm−1 region in the IR spectra (Fig. 4).
Most probably, the residue oxidation (22) occurs similarly to the reactions summarized in ref. 18 for HCN oxidation on Pt/Al2O3 catalyst. Under this scheme, oxidation by [O] adsorbed proceeds via [NCO] formation followed by its decomposition to [N] and [CO] adsorbed with a further number of surface reactions leading to the evolution of N2, NO, NO2, N2O and CO2 to the gas phase. But the key step is [O] formation, which is definitely limiting the residue oxidation stage.
Dissociation of [O2] requires the presence of free platinum sites to form [O] adsorbed species. In the case where the entire surface of the platinum is totally blocked with deposits, the availability of such sites is complicated. It can be assumed that platinum sites, uncovered due to some rearrangement of overlaying (CN)x chains on the platinum surface, will be immediately covered with UDMH or the molecule of its transformation, such as DMA, transferred from the silica support. And when the amount of CN-containing molecules adsorbed on the support is significantly reduced, formation of the clean platinum areas becomes possible. This initiates O2 adsorption and dissociation, after that, according to FTIR data, surface residues rapidly disappear via combustion. As soon as fewer residues remain on the surface, more sites for oxygen activation appear leading to oxidation rate increase and avalanche-type combustion. And it is this effect that we observe as the second step of the oxidation process.
Effect of oxygen and UDMH concentration
Experimental results showed that both oxygen activation and UDMH transformation to residue proceed on the same platinum centers. So, the oxygen to UDMH ratio and reaction temperature should affect significantly the process of UDMH oxidation, in particular, the time of the presence of deposits on the catalyst surface. Fig. 7 shows oxygen consumption and CO2 evolution vs. time revealed by MS detection. As was mentioned before, peaks 1 and 3 on the m/z = 44 curve are attributed to CO2, while the peak 2 is due to DMA formation; negative peaks on the m/z = 32 curve point to oxygen consumption, while the positive peak is associated with the presence of methanol.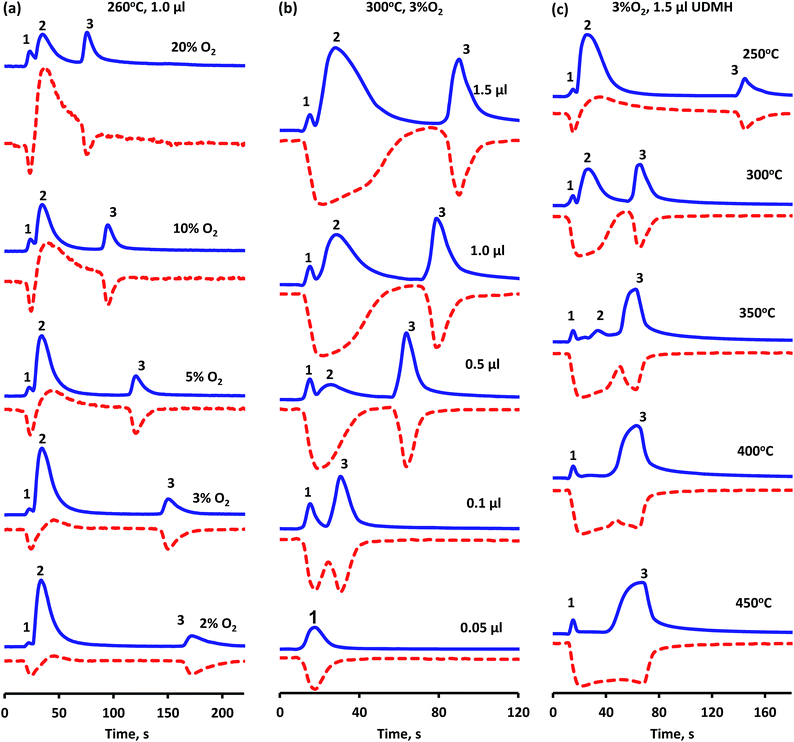 | ||
Fig. 7 CO2 evolution ( m/z = 44) and oxygen consumption ( m/z = 44) and oxygen consumption ( m/z = 32) vs. time with variation of reaction conditions: (a) oxygen content in He flow; (b) UDMH pulse volume, (c) reaction temperature. m/z = 32) vs. time with variation of reaction conditions: (a) oxygen content in He flow; (b) UDMH pulse volume, (c) reaction temperature. | ||
Two-step O2 consumption and CO2 formation is observed over a broad range of oxygen concentrations. The lowering of oxygen content in the flow (Fig. 7a) leads to a smaller amount of total oxidation products formed in the first step (peak 1). So, in 3% O2 flow or less peak 1 becomes hardly detectable along with the increase in intensity of peak 2 owing to DMA (Fig. 7a). This corresponds to a decrease in surface coverage of [O2] and [O] at low oxygen partial pressures and, as a consequence, initial oxidation upon UDMH dosing is less pronounced. An increase in the oxygen partial pressure also leads to the appearance of methanol in the interval between peak 1 and 2, indicating a higher methyl group conversion via reactions (13, 14) depicted in Scheme 1.
The amount of UDMH fed in the pulse (VUDMH) was found to affect overall oxidation (Fig. 7b). The increase in VUDMH leads to a smaller amount of oxidation products in the first step. In contrast, decreasing VUDMH leads to vanishing of the DMA-connected peak 2 and only CO2 evolution is observed (Fig. 7b). This indicates that the UDMH to O2 ratio at the beginning of the pulse is even more important. When a certain ratio is exceeded, excess of UDMH is converted to partial decomposition products, such as DMA with consecutive formation of heavy [(CN)x] residues. These residues burn after a time gap leading to peak 3 in Fig. 7. Peak 3 intensity remains nearly constant at VUDMH 0.5–1.5 μl, indicating limited capacity of the surface towards [(CN)x] species. Only peak 2 is growing in this interval, suggesting that any “extra” UDMH converts to partial decomposition products.
The time between first and second oxidation stages is continuously decreasing with increase of oxygen concentration or decrease of UDMH pulse as a result of the shift of competitive adsorption between these molecules and oxygen. Moreover, the higher oxygen content promotes more intensive combustion of the reagent during the first stage of oxidation thus reducing the amount of remaining adsorbed molecules, which could be further transferred to platinum to maintain their blockage. So, the increasing oxygen to UDMH ratio leads to the merger of two oxygen consumption peaks and, for example, after injection of 0.05 μl of UDMH to 3%O2/He flow at 300 °C the one-step oxidation process is observed (Fig. 7b). Hence, under these conditions the blockage of the platinum surface by residue does not occur.
Reaction temperature is also a significant factor for residue oxidation (Fig. 7c). The amount of CO2 released (peaks 1 and 3) increases with temperature while DMA concentration detected in the gas phase (peak 2) declined and completely vanished above 350 °C. Herewith, the time between two CO2 peaks diminished significantly when the reaction temperature was raised from 250 to 300 °C, but with further temperature increase almost no change in this parameter was observed. Despite the enhancement in oxidation rate, deposits formation and their separate combustion are still observed at all temperatures studied. The apparent dependence on reaction temperature is affected both by the rate of oxidation and by the rate of surface dehydrogenation. So, the superposition of these two components leads to observed similarity between at 350 and 450 °C.
Thus, experiments with variation of temperature and concentration of oxygen and UDMH led to an important conclusion for UDMH conversion over Pt-catalyst, which will be realized in flow conditions: deep oxidation is possible only when exceeding a certain threshold in the ratio of oxygen to UDMH. Below this level UDMH conversion is low and the reaction products are mainly products of non-oxidative decomposition of UDMH and partial oxidation, such as methanol. After exceeding this level, the UDMH conversion increases sharply, and the products of complete oxidation are mostly recorded in the gas phase. This threshold oxygen to UDMH level depends on reaction temperature, and namely this effect can be the reason for the above-mentioned fast increase in CO2 concentration during UDMH conversion observed in ref. 6 and 7 at about 300 °C over Pt-catalyst.
Conclusions
An unusual two-step oxidation process was detected in experiments with the pulse 1,1-dimethylhydrazine (UDMH) feeding: initially UDMH oxidation takes place on the free platinum surface and terminates quickly due to the blockage of active sites; the second oxidation step is connected with combustion of the surface residue. In situ FTIR study of UDMH oxidation on Pt/SiO2 catalyst allowed the revealing of peculiarities in the processes occurring on the catalyst surface. It was shown, that, in parallel with oxidation, UDMH undergoes a series of successive transformations leading to formation of deposits strongly adsorbed on the platinum surface. This residue consists mostly of condensed C![[triple bond, length as m-dash]](https://www.rsc.org/images/entities/char_e002.gif) N nitrile groups which totally block the platinum surface. The integrity of the deposits layer is maintained by C
N nitrile groups which totally block the platinum surface. The integrity of the deposits layer is maintained by C![[triple bond, length as m-dash]](https://www.rsc.org/images/entities/char_e002.gif) N species permanently formed via decomposition of UDMH and the products of UDMH conversion, such as dimethylamine, adsorbed on the silica support. The residue layer remains resistant to oxidation as long as the transfer of C–N containing substances from support to platinum proceeds. The two-step oxidation picture is observed over a broad range of reaction temperatures and oxygen to UDMH ratios. The period between the two oxidation stages increases with the amount of UDMH injected and lowering the oxygen concentration in the flow.
N species permanently formed via decomposition of UDMH and the products of UDMH conversion, such as dimethylamine, adsorbed on the silica support. The residue layer remains resistant to oxidation as long as the transfer of C–N containing substances from support to platinum proceeds. The two-step oxidation picture is observed over a broad range of reaction temperatures and oxygen to UDMH ratios. The period between the two oxidation stages increases with the amount of UDMH injected and lowering the oxygen concentration in the flow.
Conflicts of interest
There are no conflicts to declare.Acknowledgements
The authors thank the Russian Science Foundation for the financial support (grant no. 14-23-00094). P. A. Kots acknowledges Haldor Topsoe for a PhD fellowship.References
- Z. R. Ismagilov, M. A. Kerzhentsev, I. Z. Ismagilov, V. A. Sazonov, V. N. Parmon, G. L. Elizarova, O. P. Pestunova, V. A. Shandakov, Y. L. Zuev, V. N. Eryomin, N. V. Pestereva, F. Garin and H. J. Veringa, Catal. Today, 2002, 75, 277–285 CrossRef CAS.
- G. Lunn and E. B. Sansone, Chemosphere, 1994, 29, 1577–1590 CrossRef CAS PubMed.
- J. P. Contour and G. Pannetier, J. Catal., 1972, 24, 434–445 CrossRef CAS.
- X. Chen, T. Zhang, L. Xia, T. Li, M. Zheng, Z. Wu, X. Wang, Z. Wei, Q. Xin and C. Li, Catal. Lett., 2002, 79, 21–25 CrossRef CAS.
- J. A. J. Rodrigues, G. M. Cruz, G. Bugli, M. Boudart and G. Djega-Mariadassou, Catal. Lett., 1997, 45, 1–3 CrossRef CAS.
- Z. R. Ismagilov, Eurasian Chem.-Technol. J., 2001, 3, 241–245 CrossRef CAS.
- Z. R. Ismagilov, M. A. Kerzentsev, I. Z. Ismagilov, V. A. Sazonov, V. N. Parmon, G. L. Elizarova, O. P. Pestunova, V. A. Shandakov, Y. L. Zuev, V. N. Eryomin, N. V. Pestereva, F. Garin and H. Veringa, Defense Industries: Science and Technology Related to Security: Impact of Conventional Munitions on Environment and Population, Kluwer Academic Publishers, Netherlands, 2004 Search PubMed.
- A. L. Schwaner, M. Kovar, D. J. Alberas and J. M. White, J. Vac. Sci. Technol., A, 1995, 13(3), 1368–1372 CrossRef CAS.
- A. Atakan, P. Mäkie, F. Söderlind, J. Keraudy, E. M. Björk and M. Odén, Phys. Chem. Chem. Phys., 2017, 19, 19139–19149 RSC.
- J. P. H. Li, A. A. Adesina, E. M. Kennedy and M. Stockenhuber, Phys. Chem. Chem. Phys., 2017, 19, 26630–26644 RSC.
- D. Panayotov, E. Ivanova, M. Mihaylov, K. Chakarova, T. Spassov and K. Hadjiivanov, Phys. Chem. Chem. Phys., 2015, 17, 20563–20573 RSC.
- P. A. Kolinko, D. V. Kozlov, A. V. Vorontsov and S. V. Preis, Catal. Today, 2007, 122, 178–185 CrossRef CAS.
- I. Z. Ismagilov, V. V. Kuznetsov, A. P. Nemudryi and O. Y. Pod"yacheva, Kinet. Catal., 2004, 45(5), 722–729 CrossRef CAS.
- V. A. Matyshak and O. V. Krylov, Catal. Today, 1995, 25(1), 1 CrossRef CAS.
- M. A. Mathur and H. H. Sisler, Inorg. Chem., 1981, 20, 426–429 CrossRef CAS.
- A. V. Smirnov, M. A. Panteleyev, V. V. Krivetskiy and A. M. Gaskov, Russ. J. Appl. Chem., 2016, 89, 1109–1118 CrossRef CAS.
- J. R. Durig and W. C. Harris, J. Chem. Phys., 1969, 51, 4457–4468 CrossRef CAS.
- H. Zhao, R. G. Tonkyn, S. E. Barlow, B. E. Koel and C. H. F. Peden, Appl. Catal., B, 2006, 65, 282–290 CrossRef CAS.
- L. R. Knopke, N. Nemati, A. Kockritz, A. Bruckner and U. Bentrup, ChemCatChem, 2010, 2, 273–280 CrossRef.
- P. Wu, T. Komatsu and T. Yashima, J. Catal., 1997, 168, 400–411 CrossRef CAS.
- J. S. Somers and M. E. Bridge, Surf. Sci., 1985, 159, L439–L444 CrossRef CAS.
- G. R. Bamwenda, A. Obuchi, S. Kushiyama and K. Mizuno, Stud. Surf. Sci. Catal., 2000, 130, 1271–1276 CrossRef.
- G. Davidson, Spectroscopic Properties of Inorganic and Organometallic Compounds, Royal Society of Chemistry, Cambridge, 1998 Search PubMed.
- R. A. Nyquist, Interpreting Infrared, Raman, and Nuclear Magnetic Resonance Spectra, Academic Press, San Francisco, CA, 2001 Search PubMed.
- C. De La Cruz and N. Sheppard, Spectrochim. Acta, Part A, 1994, 50, 271–285 CrossRef.
- J. Ruiz-Martinez, A. Sepulveda-Escribano, J. A. Anderson and F. Rodriguez-Reinos, Phys. Chem. Chem. Phys., 2009, 11, 917–920 RSC.
- M. H. Moore and R. K. Khanna, Spectrochim. Acta, Part A, 1991, 47, 255–262 CrossRef.
Footnote |
| † Electronic supplementary information (ESI) available. See DOI: 10.1039/c8ra07769j |
| This journal is © The Royal Society of Chemistry 2018 |

