 Open Access Article
Exchange coupling and single molecule magnetism in redox-active tetraoxolene-bridged dilanthanide complexes†
Peng
Zhang
 a,
Mauro
Perfetti
ab,
Michal
Kern
 a,
Philipp P.
Hallmen
a,
Liviu
Ungur
a,
Philipp P.
Hallmen
a,
Liviu
Ungur
 c,
Samuel
Lenz
a,
Mark R.
Ringenberg
 d,
Wolfgang
Frey
e,
Hermann
Stoll
f,
Guntram
Rauhut
 f and
Joris
van Slageren
 *a
*a
aInstitut für Physikalische Chemie, Universität Stuttgart, Pfaffenwaldring 55, D-70569, Stuttgart, Germany. E-mail: slageren@ipc.uni-stuttgart.de
bDepartment of Chemistry, University of Copenhagen, Universitetparken 5, 2100 Copenhagen, Denmark
cTheory of Nanomaterials Group, INPAC-Institute of Nanoscale Physics and Chemistry, Katholieke Universiteit Leuven, 3001 Leuven, Belgium
dInstitut für Anorganische Chemie, Universität Stuttgart, Pfaffenwaldring 55, D-70569 Stuttgart, Germany
eInstitut für Organische Chemie, Universität Stuttgart, Pfaffenwaldring 55, D-70569 Stuttgart, Germany
fInstitut für Theoretische Chemie, Universität Stuttgart, Pfaffenwaldring 55, D-70569 Stuttgart, Germany
First published on 8th December 2017
Abstract
Tetraoxolene radical-bridged lanthanide SMM systems were prepared for the first time by reduction of the respective neutral compounds. Magnetic measurements reveal the profound influence of the radical center on magnetic behavior. Strong magnetic couplings are revealed in the radical species, which switch on SMM behavior under zero applied field for DyIII and TbIII compounds. HFEPR spectra unravel the contributions of the magnetic coupling and the magnetic anisotropy. For GdIII this results in much more accurate magnetic coupling parameters with respect to bulk magnetic measurements.
Introduction
Tetraoxolene ligands and its derivatives, where one or more of the oxygens are replaced by nitrogen with an appropriate R-group, have been extensively used as bridges in the assembly of transition metal complexes showing peculiar magnetic and/or conducting properties.1–3 One major reason is their fascinating electronic structures arising from the redox–rich properties, and extensive tuning of chemical and physical properties is available as a result.4,5 In particular, upon either oxidation or reduction, these ligands can form a delocalized π radical system, which can lead to strong exchange couplings with paramagnetic ions and can efficiently transmit electronic effects between the bridged metal centers, as revealed in a number of transition metal dimers.6–8 Nevertheless, tetraoxolene-based, radical-bridged systems have not been reported in lanthanide chemistry. To date, only mono-semiquinonato lanthanide systems were presented,9,10 as well as tetraoxolene-bridged lanthanide dimers with closed-shell bridges.11,12 Significantly, a strong antiferromagnetic coupling of over 10 cm−1 was achieved in a gadolinium–semiquinone complex,13,14 whilst the experimental and DFT investigations of the YIII analogue revealed significant spin delocalization of the oxygen toward the yttrium site,15 suggesting the strong ability of dioxolene and, by extension, tetraoxolene radicals to mediate magnetic exchange couplings between lanthanide ions. Therefore, tetraoxolene radical bridges are quite promising for achieving strong magnetic coupling in polynuclear lanthanide-based system with the aim of improving single molecule magnet (SMM) properties.In fact, the development of exchange coupled polynuclear lanthanide clusters with radical bridges is seen as one of the most efficient routes to a high-performance SMM since the discovery of N23−-radical-bridged lanthanide SMM showing many times less efficient tunneling than in single ion systems.16–18 Nevertheless, different from the common lanthanide SMMs, experiencing an unparalleled growth recently,19,20 synthetic difficulty leads to slow progress in radical bridge-containing systems with only a few successful examples, such as N23−˙, bpym−˙, tppz−˙/3−˙, bptz−˙, ind3−˙, HAN3−˙.17,18,21–25 All these bridging ligands are nitrogen-based. Here we synthesized a family of tetraoxolene bridged lanthanide dimers, [(HBpz3)2Ln(μ-CA)Ln(HBpz3)2]·2CH2Cl2 (1Ln, Ln = Dy, Tb, Gd, Y, HBpz3− = hydrotris(pyrazol-1-yl)borate, CA2− = chloroanilate). Chemical reduction by cobaltocene leads to the isolation of radical bridged species, [(HBpz3)2Ln(μ-CA˙)Ln(HBpz3)2]−·[CoCp2]+ (2Ln, Ln = Dy, Tb, Gd, Y). Magnetic measurements reveal strong magnetic coupling between the radical and the lanthanide ions (J = 4.17 cm−1 for 2Gd), promoting the appearance of SMM behavior in zero applied field for 2Dy and 2Tb. Furthermore, the magnetic coupling in 1Gd and 2Gd was studied by means of high-frequency electron paramagnetic resonance (HFEPR) spectroscopy, which gives more accurate information on the magnetism than magnetic measurements.
Results and discussion
Syntheses, structures, and electrochemistry
The non-radical bridged lanthanide dimers 1Ln were synthesized from an aqueous solution of H2CA, K(HBpz3) and LnCl3·xH2O in a 1![[thin space (1/6-em)]](https://www.rsc.org/images/entities/char_2009.gif) :
:![[thin space (1/6-em)]](https://www.rsc.org/images/entities/char_2009.gif) 4
4![[thin space (1/6-em)]](https://www.rsc.org/images/entities/char_2009.gif) :
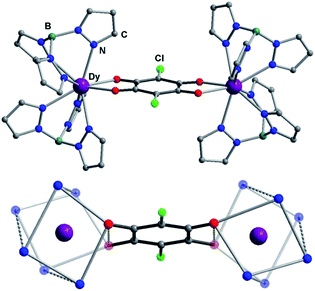
:![[thin space (1/6-em)]](https://www.rsc.org/images/entities/char_2009.gif) 2 stoichiometric ratio. The recrystallization of the crude products in dichloromethane–acetonitrile solution afforded single crystals suitable for X-ray analysis. Compounds 1Ln are isostructural, and crystallize in monoclinic space group P21/n (Table S1†). This structure has been previously reported for 1Dy and 1Y.11 The molecular structure of 1Dy is shown in Fig. 1, where two eight-coordinate Dy ions are related by a crystallographic inversion center and each is surrounded by a distorted square-antiprismatic environment (SAP). Furthermore, the conjugated CA2− ligand connects two Dy centers with a Dy–Dy distance of 8.64(9) Å, which is much longer than in the oxalate-bridged Dy2 compound reported in 2010.26 Therefore, the magnetic interaction is expected to be very weak in these compounds. The CA2− bridge has the advantage over oxalate in being (electro)chemically reducible in a facile manner, as seen in Scheme 1. The generation of a radical species is expected to enhance the magnetic exchange coupling between lanthanide ions despite the large separation.
2 stoichiometric ratio. The recrystallization of the crude products in dichloromethane–acetonitrile solution afforded single crystals suitable for X-ray analysis. Compounds 1Ln are isostructural, and crystallize in monoclinic space group P21/n (Table S1†). This structure has been previously reported for 1Dy and 1Y.11 The molecular structure of 1Dy is shown in Fig. 1, where two eight-coordinate Dy ions are related by a crystallographic inversion center and each is surrounded by a distorted square-antiprismatic environment (SAP). Furthermore, the conjugated CA2− ligand connects two Dy centers with a Dy–Dy distance of 8.64(9) Å, which is much longer than in the oxalate-bridged Dy2 compound reported in 2010.26 Therefore, the magnetic interaction is expected to be very weak in these compounds. The CA2− bridge has the advantage over oxalate in being (electro)chemically reducible in a facile manner, as seen in Scheme 1. The generation of a radical species is expected to enhance the magnetic exchange coupling between lanthanide ions despite the large separation.
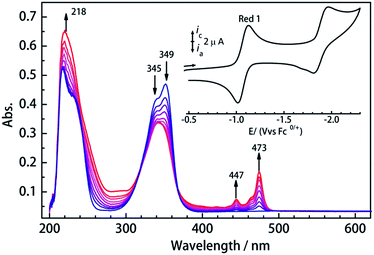
To investigate their redox properties, electrochemical measurements were carried out. Cyclic voltammograms reveal that all compounds display two one-electron reduction steps (Fig. 2 and S1†) related to CA2− bridge in CH2Cl2/0.1 M Bu4NPF6 with the parameters shown in Table 1. Significantly, a reversible reduction is observed near −1.05 V vs. Fc/Fc+, and the peak current ratios close to 1 reveal the electrochemical stability of the CA3−˙-radical species formed upon reduction. Furthermore, the first reduction process is reversible in different solvents (Fig. S2†), which is promising for isolation of the chemically reduced species. The UV/vis spectrum of 1Ln displays a strong absorption band in the near UV, which is also seen at shorter wavelengths in the H2CA ligand (Fig. S3†). UV/vis spectroelectrochemical measurements reveal the decrease of this band upon reduction and the concurrent appearance of a new band between 430 and 490 nm, which we attribute to a radical-based π–π* transition.
| Red 1 | Red 2 | ||||
|---|---|---|---|---|---|
| E 1/2 /V | E pc/V | i pa/ipc | E pc/V | i pa/ipc | |
| a E 1/2 for reversible processes, in CH2Cl2/0.1 M Bu4NPF6 at 298 K glassy carbon working electrode, Pt counter electrode, Ag reference electrode. | |||||
| 1Dy | −1.09 | −1.15 | 0.957 | −2.09 | n.a. |
| 1Tb | −1.07 | −1.13 | 0.977 | −1.94 | n.a. |
| 1Gd | −1.14 | −1.21 | 0.938 | −2.02 | n.a. |
| 1Y | −1.10 | −1.25 | 0.964 | −2.07 | n.a. |
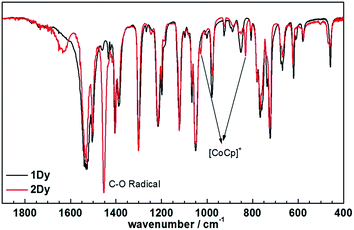
Encouraged by these results, we attempted the chemical reduction of all compounds employing cobaltocene (CoCp2/CoCp2+, E1/2 = −1.33 V) as reducing agent. The treatment with cobaltocene (CoCp2) leads to precipitation of the desired species as green powders. The advantage of employing cobaltocene is that the resultant cation [CoCp2]+ is a diamagnetic species and silent to all the spectroscopic and magnetic measurements discussed hereafter.27 Even though only low quality crystals could be obtained by recrystallization in acetonitrile, the results from ESI-MS (Fig. S4–S8†), IR spectra (Fig. S9†) and elemental analysis confirm the clean formation of [(HBpz3)2Ln(μ-CA˙)Ln(HBpz3)2]−·[CoCp2]+ (2Ln). Taking 2Dy as an example, the ESI-MS (Fig. 3) under negative mode reveals a peak at m/z = 1384, corresponding to the molecular ion of the anion complex, which exhibits the same mass and splitting pattern as the non-radical compound 1Dy. Furthermore, IR spectra of the reduced compounds (Fig. 4) are similar to those of the non-reduced compounds but with an additional strong absorption at ∼1450 cm−1, which is ascribed to the stretching vibration of –C–O˙ radical.2 In addition, the spectra show weak absorptions of [CoCp2]+ at 1022 and 828 cm−1.28
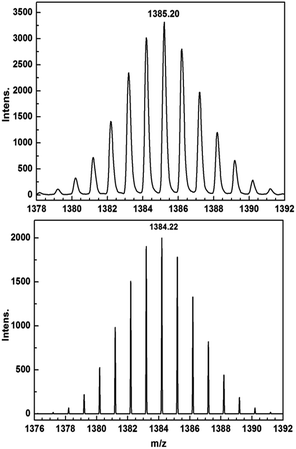 | ||
| Fig. 3 ESI-MS spectra of 1Dy (top) and 2Dy (bottom) showing the isotope pattern of the molecular ion peaks at m/z = 1385 ([M + H]+) and 1384 (M−). | ||
Static magnetic susceptibility
Static magnetic measurements for all compounds were carried out in an applied field of 1000 Oe between 1.8 and 300 K with a Quantum-Design MPMS magnetometer (Fig. 5). The χMT values of complexes 1Dy, 1Tb, 1Gd at room temperature are 29.5, 24.2, and 15.50 cm3 K mol−1, close to the theoretical values of 28.34, 23.64, and 15.76 cm3 K mol−1 for two non-interacting DyIII, TbIII, and GdIII ions, respectively. On decreasing the temperature to 1.8 K, the χMT values for 1Dy and 1Tb decrease, which we attribute to the depopulation of excited crystal field states. Similar results were recently obtained.11 For 1Gd no such decrease is observed in agreement with the essentially isotropic electronic ground state of GdIII, and the absence of strong magnetic couplings in this compound. Starkly different static magnetic behavior is found for the reduced compounds 2Ln. As shown in Fig. 5, the χMT values at room temperature are slightly higher than that in the corresponding non-reduced compounds due to the additional radical centre (Curie constant at room temperature: 0.375 cm3 K mol−1). Upon lowering the temperature, the χMT values decrease more rapidly than in the corresponding neutral complexes, reaching minimum values at 50 K and 20 K for 2Dy and 2Tb respectively. Remarkably, an increase of χMT is observed upon further lowering the temperature, clearly connected with strong magnetic interactions between lanthanide centers and the delocalized π radical. Below 6 K, 2Dy exhibits a sudden decrease of the χMT value that indicate a possible magnetic blocking behavior, as observed for other radical bridged SMMs.17,22 Given the large magnetic anisotropy arising from strong spin orbital interactions for DyIII and TbIII ions it is impossible to accurately quantify the magnetic coupling parameters from susceptibility data alone. The room temperature χMT value for 2Gd is again slightly higher than that of the neutral complex 1Gd, but in contrast, it decreases upon lowering the temperature before increasing again. The absence of first order orbital angular momentum for Gd compounds29–31 allows employing a spin-only Hamiltonian![[script letter H]](https://www.rsc.org/images/entities/i_char_e142.gif) = JŜrad(ŜGd1 + ŜGd2) to fit the data. A value of J = 4.17 cm−1 was obtained, revealing substantial antiferromagnetic coupling between the GdIII centers and the radical bridge (Fig. S10†). The magnitude is smaller than in the case of the mono-semiquinonato system (J = 11.4 cm−1),13 and it is relatively small compared with the N-bearing radical bridged systems (12–54 cm−1), which can possibly be ascribed to the less diffuse orbitals and stronger electronegativity of oxygen donor.9 However, it is beneficial to stabilize such a radical species, and indeed the solid compounds exhibit the enhanced stability even upon exposure to the atmosphere. Finally, the temperature-independent χMT value of 0.35 cm3 K mol−1 is consistent with the expected value of 0.375 cm3 K mol−1 for 2Y.
= JŜrad(ŜGd1 + ŜGd2) to fit the data. A value of J = 4.17 cm−1 was obtained, revealing substantial antiferromagnetic coupling between the GdIII centers and the radical bridge (Fig. S10†). The magnitude is smaller than in the case of the mono-semiquinonato system (J = 11.4 cm−1),13 and it is relatively small compared with the N-bearing radical bridged systems (12–54 cm−1), which can possibly be ascribed to the less diffuse orbitals and stronger electronegativity of oxygen donor.9 However, it is beneficial to stabilize such a radical species, and indeed the solid compounds exhibit the enhanced stability even upon exposure to the atmosphere. Finally, the temperature-independent χMT value of 0.35 cm3 K mol−1 is consistent with the expected value of 0.375 cm3 K mol−1 for 2Y.
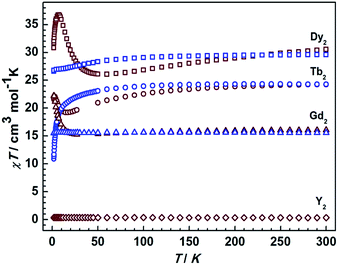 | ||
| Fig. 5 Temperature dependence of the χMT values at 1000 Oe for compounds 1Ln and 2Ln. The blue and brown symbols correspond to neutral and radical compounds, respectively. | ||
Magnetization data at fields of 0–70 kOe below 5 K (Fig. S11†) was also collected, and the comparison to non-reduced compounds reveals faster increase of magnetization at low field and lower high-field magnetization for radical-bridged species 2Ln, which is completely consistent with the strong antiferromagnetic exchange between lanthanide and radical. The saturation magnetization of 12.7 μB reveals an S = 13/2 ground state in 2Gd. The saturation value of 1Ln and 2Ln (Ln = Dy, Tb) is also consistent with the ground state essentially consisting of the largest mJ state (see ab initio).
Dynamic magnetic susceptibility
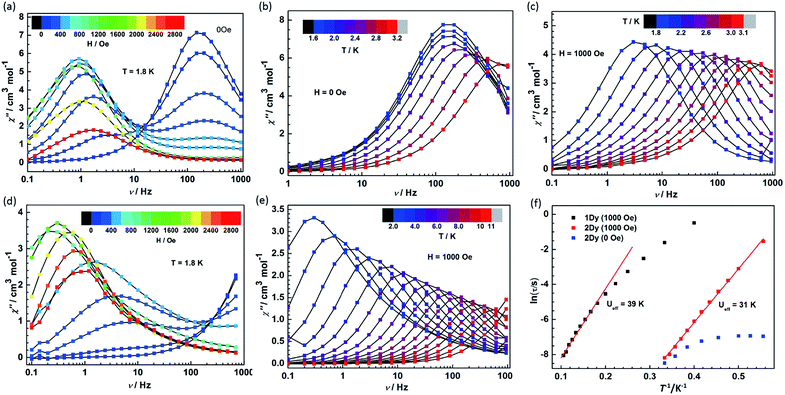
Given the fascinating relaxation behavior of magnetization in radical-bridged dilanthanide systems,16–18 variable-frequency ac susceptibility measurements were performed at variable temperatures (Fig. 6 and S12†). As shown in Fig. 6a and d, slow relaxation of the magnetization was detected at 1.8 K in both 1Dy and 2Dy as strong frequency- and field-dependent peaks of the out-of-phase (χ′′) susceptibility. Significantly, at zero dc field, only 2Dy shows a χ′′ peak, and no peak was detected in 1Dy in the measured frequency range from 0.1 Hz to 1000 Hz. This is indicative of improved SMM properties as a result of strong magnetic couplings between the Dy and radical centers in 2Dy. Furthermore, the application of a dc field leads to the second relaxation process occurring at lower frequency in both compounds. The fast relaxation process remains on the edge of the frequency window for compound 1Dy, while two relaxation processes could be nicely resolved in 2Dy. The fast relaxation process in 2Dy is progressively quenched with increasing the field and disappears completely for fields stronger than 1000 Oe. Similar relaxation behavior was also observed in mononuclear [Dy(DOTA)],32 a dinuclear, Cl-bridged cyclopentadienyl-dysprosium compound33 and U(H2BPz2)3,34 but the relaxation mechanism is still unclear. Here, two series of relaxation times (τ) can be extracted by the sum of two modified Debye functions for 2Dy (Fig. S13, S14 and Table S2†). More importantly, the field dependence of slow relaxation process is drastically different from that observed for compound 1Dy especially below 2000 Oe, suggesting an important effect from radical coupling.The ac susceptibility was also investigated as a function of temperature in compounds 1Dy and 2Dy under 0 and 1000 Oe (optimum) field (Fig. 6). In zero dc field the χ′′ signals in 2Dy show well-resolved relaxation peaks between 1.8 and 3.2 K (Fig. 6b), but only slightly shifted in temperature, characteristic of the quantum tunneling regime.35 The tunneling relaxation time is extracted to be 0.97 ms (Fig. 6f).
In a dc field of 1000 Oe compounds 1Dy and 2Dy both show slow relaxation of magnetization, as indicated by the temperature-dependent χ′′ peaks (Fig. 6c and e). The relaxation times can be extracted with a generalized Debye model, and an Arrhenius fit of temperature dependence gives their effective barriers (Ueff), 39 ± 2 and 31 ± 1 K, with τ0 = 5.46 × 10⁻⁶ and 7.33 × 10⁻⁹ s for 1Dy and 2Dy, respectively. A slightly different effective energy barrier value was reported for 1Dy, due to the different frequency range employed there.11 The relatively low values of the effective barriers already suggest that the Orbach relaxation pathway is not efficient for these systems in such temperature range, as commonly reported for Ln complexes.36–38 In particular, the relaxation behavior persists in wider temperature range in compound 1Dy but it exhibits a poor linear relationship in ln(τ) vs. T−1 plots and uncommonly large τ0 value (Fig. 6f). To explore the presence of other relaxation pathways we also tentatively fitted the temperature dependence of the relaxation times with an power (Tn) function obtaining n = 5.6 for 1Dy and n = 13.0 for 2Dy (Fig. S15†). These result clearly suggests that a Raman process could be responsible for the slow relaxation for 1Dy, while the unphysically large exponent in 2Dy indicates that the situation is more complicated, e.g. due to the participation of optical phonons/molecular vibrations.16,39
Furthermore, ac magnetic susceptibility data collected for 2Tb also display out-of-phase susceptibility signals with a frequency and temperature dependence indicative of slow relaxation of magnetization (Fig. S16†). The effective barrier cannot be extracted given that only three data points available for which a maximum is observed. Even so it still reveals the large contribution of strong magnetic coupling on relaxation behaviour.
A careful comparison between the systems reported here and the Ln radical-bridged systems previously reported in literature can shed light on possible magnetochemical relations. The effective barrier obtained for 2Ln is generally lower than the ones in N23−˙, bpym−˙ and tppz−˙-bridged compounds. One key reason is the limitation of local coordination environment around lanthanide center, which leads to the weak crystal field splitting and large transverse anisotropy (ab initio calculations below), as indicated by the similar DyIII SMMs with HBpz3− ligands.26,40,41 Recently an air stable tetrazine radical-bridged DyIII SMM and its neutral counterpart by Dunbar et al. also exhibited the redox switching of magnetic relaxation dynamics.23 In the same way the use of β-diketonate leads to a weak blocking behavior. The strong contrast to the radical systems with cyclopentadienyl ligand (Cp)21,22,25 suggests that it is better to use Cp as ancillary ligands, which supports a stronger axial crystal field.
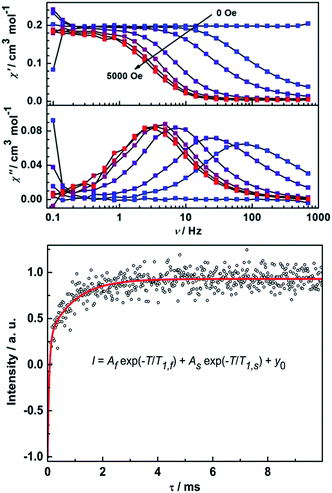
Remarkably, ac susceptibility measurements on 2Y reveal a field-induced slow relaxation behavior of magnetization (Fig. 7), which is unexpected in light of the diamagnetic nature of the YIII ion. Furthermore, in a dc field of 5000 Oe χ′′ shows temperature-dependent relaxation peaks until 15 K (Fig. S17†). The relaxation times were extracted and an Arrhenius fit of the high temperature region gives unphysical parameters of Ueff = 20 K and τ0 = 1.20 × 10⁻⁴ s.16 Here the in-phase component of the ac susceptibility decreases to close to zero at low temperatures. To have a quantitative idea of the fraction of the sample that relaxes slowly we can compare the dc susceptibility and the (χT–χS) value from ac measurements. It reveals more than 90% of the sample is slowly relaxing given the different applied dc field (Fig. S17†). This excludes the possibility of the relaxation arising from a magnetic impurity. To further characterize the observed slow relaxation, pulsed Q-band EPR was carried out on a frozen solution sample of 2Y at 7 K.42 The spin–lattice relaxation time T1 was determined by means of the inversion recovery sequence. As shown in Fig. 7, the data can be fitted by a biexponential function, which gives two T1 times (Table S3†). Notably, the slow relaxation time T1,S is in the same order of magnitude as ac susceptibility measurement (1.8 ms at 5000 Oe and 7 K). This demonstrates that the slow relaxation observed for 2Y is due to the unpaired electron on the radical bridge. Furthermore, the coherence time TM can also be detected by means of the Hahn echo sequence (Fig. S18 and Table S3†). The fit to a biexponential function revealed a slow decoherence time constant of 9 ± 2 μs, demonstrating that 2Y is also a molecular quantum bit.
Ab initio calculations
In order to determine the electronic structures experimentally and establish the relaxation mechanism, we attempted to perform optical studies (MCD and luminescence), but no usable data was obtained due to the CA2−/CA3−˙ absorption in the visible region precluding investigations of f–f transitions (Fig. S3†).43,44 Therefore, multi-reference ab initio calculations (LDF-CAHF + CASCI/SI-SO, detailed information in ESI†)45 were performed, which gave important information on local ground and excited states of 1Dy and 1Tb.46,47 The gz values of ground doublet states are indicative of easy-axis anisotropy for 1Dy (19.76) and 1Tb (17.26), approaching values expected for a mJ = ±15/2 and ±6 ground state, respectively. The local easy axes point toward the CA2− ligand (Fig. S19†), which exhibits shorter bond distances i.e. stronger crystal field interactions to lanthanide centers than HBpz3− ligands. The angle between the gz orientation and the vector connecting two lanthanide centers is smaller in 1Dy (9°) than 1Tb (31°). More importantly, non-negligible transverse components of the g-tensor (gx = 0.029, gy = 0.036) are found in the ground Kramers doublet of 1Dy, which leads to the strong quantum tunneling of magnetization as a result of mixed microstates (Table S4†). As a non-Kramers ion, the ground pseudo-doublet of 1Tb can be split in a low-symmetry crystal field and we find a large intrinsic tunneling gap of 2.5 cm−1 (Table S5†). This is consistent with the absence of SMM behavior in zero field for 1Tb. Furthermore, the total splitting for the ground multiplets of the DyIII and TbIII ions is below 500 cm−1, indicating a weak crystal field environment. For 1Dy the first excited doublet is on 84 cm−1 (120 K), which is much higher than Ueff from ac susceptibility measurements suggesting the inefficiency of Orbach process here. The large size of the magnetic cores and the absence of molecular structures preclude ab initio calculations of complexes 2Ln. Instead we obtain the effective information of ground states via electron paramagnetic resonance (HF-EPR) spectroscopy.Multifrequency high-field electron paramagnetic resonance (HF-EPR) spectroscopy
EPR proved to be a powerful method to detect the geometric and electronic structures of paramagnetic systems,48 but it is rarely applied in lanthanide systems due to their EPR-silence or weak signals.36,49,50 An exception is the spin-only GdIII ion with half-filled f-shell, which gives well resolved EPR signals, thus providing rich information on the crystal field environment.51 Measuring EPR spectra at high fields and frequencies often simplifies the analysis because the Zeeman term becomes dominant in the spin Hamiltonian.52 Here we mainly focus on the investigations on Gd compounds from diluted sample Gd@1Y to the undiluted sample 1Gd and then the reduced sample 2Gd, which provides detailed information on the local crystal field of lanthanide center and exchange coupling interaction between them. Notably, this is the first time that the exchange coupling in a radical-bridged dinuclear lanthanide system is investigated in detail by means of HFEPR.Fig. S20† shows the temperature-dependence of HF-EPR spectra collected at 320 GHz for diluted sample Gd@1Y. Here the parallel transitions appear at low field and the spectral weight increases towards low field on decreasing temperature, which corresponds to a negative zero field splitting parameter D. Furthermore, the high field perpendicular transitions reveal small splittings, typical of rhombic distortion. Therefore, a suitable spin Hamiltonian is ![[script letter H]](https://www.rsc.org/images/entities/i_char_e142.gif) Gd = μBŜ·g·Ĥ + DŜz2 + E(Ŝx2 − Ŝy2). Best simulation parameters are D = −0.13 cm−1, E = 0.014 cm−1 and gxx = 1.991, gyy = 1.987, gzz = 1.986 (Fig. 8). Similar values were reported in a preliminary study in literature.11 When compared with the mononuclear compound Gd(HBpz3)2(Trp) (Trp = 2-hydroxy-2,4,6-cycloheptantrienone, D = −0.123 cm−1, E/D = 0.22),14,53 the magnitude of D value is comparable, while E/D is much smaller. This suggests that the axiality of the crystal field is improved when substituting the Trp with a CA ligand. However, the high E/D value is indicative of a large transversal component in such a crystal field environment, and may further explain the modest SMM behaviour of 1Dy.
Gd = μBŜ·g·Ĥ + DŜz2 + E(Ŝx2 − Ŝy2). Best simulation parameters are D = −0.13 cm−1, E = 0.014 cm−1 and gxx = 1.991, gyy = 1.987, gzz = 1.986 (Fig. 8). Similar values were reported in a preliminary study in literature.11 When compared with the mononuclear compound Gd(HBpz3)2(Trp) (Trp = 2-hydroxy-2,4,6-cycloheptantrienone, D = −0.123 cm−1, E/D = 0.22),14,53 the magnitude of D value is comparable, while E/D is much smaller. This suggests that the axiality of the crystal field is improved when substituting the Trp with a CA ligand. However, the high E/D value is indicative of a large transversal component in such a crystal field environment, and may further explain the modest SMM behaviour of 1Dy.
In contrast, the HFEPR spectra of undiluted 1Gd exhibit further splitting of the resonance lines arising from the weak magnetic interaction between Gd centers, as is shown in Fig. 9 and S21.† A Hamiltonian that includes all relevant terms is ![[script letter H]](https://www.rsc.org/images/entities/i_char_e142.gif) =
= ![[script letter H]](https://www.rsc.org/images/entities/i_char_e142.gif) Gd1 +
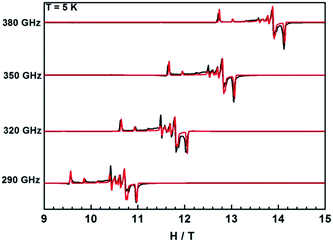
Gd1 + ![[script letter H]](https://www.rsc.org/images/entities/i_char_e142.gif) Gd2 + JŜGd1·ŜGd2, where the single ion Hamiltonians are strictly equal due to the inversion symmetry of the complexes. On the basis of this Hamiltonian, good simulations of the experimental spectra at different frequencies were obtained for J = 0.009 cm−1, and the same single ion parameters as for the dilute compound. Such a weak interaction cannot be easily determined from bulk magnetic measurements (Fig. 5).49,54 Naturally, more complicated spectra are observed in the reduced Gd compound 2Gd, which are clearly distinct from those recorded 1Gd (Fig. S22†). The absence of resonance lines attributable to 1Gd underlines the purity of 2Gd. The temperature dependent spectra at 290 GHz (Fig. S22†) reveal a fine structure progression and increasing weight towards low field on decreasing temperature, suggesting the presence of zero field splitting. Using the Hamiltonian
Gd2 + JŜGd1·ŜGd2, where the single ion Hamiltonians are strictly equal due to the inversion symmetry of the complexes. On the basis of this Hamiltonian, good simulations of the experimental spectra at different frequencies were obtained for J = 0.009 cm−1, and the same single ion parameters as for the dilute compound. Such a weak interaction cannot be easily determined from bulk magnetic measurements (Fig. 5).49,54 Naturally, more complicated spectra are observed in the reduced Gd compound 2Gd, which are clearly distinct from those recorded 1Gd (Fig. S22†). The absence of resonance lines attributable to 1Gd underlines the purity of 2Gd. The temperature dependent spectra at 290 GHz (Fig. S22†) reveal a fine structure progression and increasing weight towards low field on decreasing temperature, suggesting the presence of zero field splitting. Using the Hamiltonian ![[script letter H]](https://www.rsc.org/images/entities/i_char_e142.gif) = JŜrad(ŜGd1 + ŜGd2) + μBŜ·g·Ĥ + ∑DŜz2 for simulations (Fig. 9 and S23†) gave the following parameters: grad = gGd = 1.976, J = 3.1 cm−1, DGd = −0.11 cm−1. Inclusion of a rhombic zero-field splitting term did not improve results. The values are reasonable when compared with the above results, and they give good simulations of the temperature-dependent χMT values and low-temperature magnetization (Fig. S10 and S24†). Therefore, we consider these parameters to be more reliable than those obtained from magnetic measurements alone.
= JŜrad(ŜGd1 + ŜGd2) + μBŜ·g·Ĥ + ∑DŜz2 for simulations (Fig. 9 and S23†) gave the following parameters: grad = gGd = 1.976, J = 3.1 cm−1, DGd = −0.11 cm−1. Inclusion of a rhombic zero-field splitting term did not improve results. The values are reasonable when compared with the above results, and they give good simulations of the temperature-dependent χMT values and low-temperature magnetization (Fig. S10 and S24†). Therefore, we consider these parameters to be more reliable than those obtained from magnetic measurements alone.
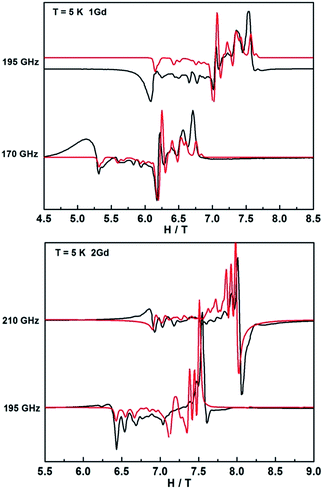 | ||
| Fig. 9 HFEPR spectra of 1Gd and 2Gd recorded at 5 K and various frequencies. The red lines correspond to simulations using the spin Hamiltonian reported in the text. | ||
For 1Dy, no EPR was observed, due to the strong axiality of the ground Kramers doublet leading to the intra-ground doublet transition being strongly forbidden. This is in agreement with literature reports.11 In contrast, HFEPR measurements on a powder sample of 1Tb revealed a weak but clear resonance line with large effective g-value (Fig. S25†). A linear fit of field–frequency plot gave a g-value of 16.1 indicative of a highly axial ground state, where the g-value found is only slightly smaller than that calculated (see above). Extrapolation of the field–frequency plot gave a zero field resonance frequency of 46 GHz (1.5 cm−1), in good agreement with ab initio calculations. Interestingly, clear HFEPR spectra could also be obtained for 2Tb (Fig. 10), which are to the best of our knowledge the first EPR spectra recorded for terbium–radical complexes. These spectra display four distinct features. The strongest resonance line (I in Fig. 10) has an effective g-value of 2.06 ± 0.02 and a zero energy gap at zero field. Such a resonance line was not observed for 1Tb and must therefore attributed to the radical species. The significant difference of the g-value from that of the free electron reveals the participation of the terbium ion in the orbital carrying the unpaired electron. Second, a resonance line (II) with large effective g-value (11.8 ± 0.8) and a sizable zero field gap of 72 ± 17 GHz (2.35 cm−1) is observed, which we attribute to the intra-pseudo-doublet transition. The different zero-field gap and g-values reveal the influence of the reduction of the bridging ligand on the terbium crystal field splitting. Finally, two weaker resonance lines are observed (III, IV) with decreasing resonance fields with increasing microwave frequencies and finite zero-field gaps of 12 and 22 cm−1 respectively. We attribute these finite gaps to the exchange splittings of the energy levels resulting from the presence of a radical bridge. A more quantitative analysis would require consideration of the full exchange coupled system, employing a suitable Hamiltonian featuring exchange coupling, crystal field and Zeeman terms. Unfortunately, the amount of data available precludes such an analysis. Note that we cannot approximate the lanthanide ions by effective S = 1/2 spins, due to the non-Kramers nature of terbium(III). Also, the exchange couplings are typically highly anisotropic.49 Furthermore, we have no information on the energetic position of the excited pseudo-doublets of the terbium ions, and cannot calculate these. Finally, in the absence of structural data, we cannot assume there to be an inversion center between the two terbium centers, which may therefore be inequivalent. A simplified fit employing two S = 1 effective spins with very large D values to simulate the ground pseudo doublets of the terbium ions did reproduce some of the salient features of the spectra, notably the strong resonance line I (Fig. S26†). Here, we used the same Hamiltonian as for 2Gd, ![[script letter H]](https://www.rsc.org/images/entities/i_char_e142.gif) = JŜrad(Ŝ1 + Ŝ2) + μBŜ·g·Ĥ + ∑DŜz2, with Srad = 1/2, S1 = S2 = 1, D = −2000 cm−1, E = 1 cm−1, grad = 2.07, gTb = (0.1, 0.1, 4.0), J = 4.3 cm−1.
= JŜrad(Ŝ1 + Ŝ2) + μBŜ·g·Ĥ + ∑DŜz2, with Srad = 1/2, S1 = S2 = 1, D = −2000 cm−1, E = 1 cm−1, grad = 2.07, gTb = (0.1, 0.1, 4.0), J = 4.3 cm−1.
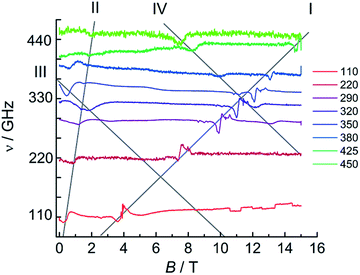 | ||
| Fig. 10 HFEPR spectra of 2Tb recorded at 5 K and various frequencies. The grey lines are guides to the eye. | ||
Conclusions
We have presented an in-depth study of tetraoxolene bridged dinuclear lanthanide complexes. Successful chemical reduction of the bridging ligand gives rise to strongly coupled radical-bridged systems with improved SMM properties. HFEPR measurements elucidated the magnetic coupling in these systems. The modest SMM behavior is most likely due to limited axiality of the local crystal field which may be improved by using Cp rather than HBpz3− as ancillary ligands and we are currently pursuing the synthetic work involved in this direction.Experimental section
The chemical reductions described below were performed under nitrogen with rigorous exclusion of air and water using Schlenk, vacuum line, and glovebox techniques. Solvents were dried with sodium benzophenone ketyl or CaH2 under pure argon atmosphere prior to use. Cobaltocene was purchased from Alfa Aesar and used as received. Elemental analyses were performed in a Perkin Elmer CHSN/O Analyzer. IR spectra were recorded on Bruker ALPHA-T spectrometer with KBr pellets. UV-vis spectra were recorded on Perkin Elmer UV/Vis Spectrometer in CH3CN solution. The ESI mass spectra were recorded on Bruker microTOF-Q ESI-MS with the non-radical and radical compounds in positive and negative modes, respectively. Cyclic voltammograms were recorded with a three electrode setup (glassy carbon working electrode, Pt counter electrode, Ag/AgCl reference electrode) using a Metrohm Autolab potentiostat. The potentials are referenced against an internal ferrocene/ferrocenium redox couple. Spectroelectrochemical measurements were carried out using an optically transparent thin layer electrochemical (OTTLE) cell.55[(HBpz3)2Ln(μ-CA)Ln(HBpz3)2]·2CH2Cl2 (1Ln)
A solution of K2CA was prepared by the reaction of H2CA (0.105 g, 0.5 mmol) and KOH in 10 ml H2O. It was added to a stirred aqueous solution (20 ml) of lanthanide chloride hydrate (1 mmol) as well as an aqueous solution (10 ml) of K(HBpz3) (0.5 g, 2 mmol). The solution was stirred for 15 min. The resulting purple precipitate was filtered off, washed three times with water, and dried under vacuum. The crude product was recrystallized from dichloromethane/acetonitrile several times (yield = 40%). Single crystals, suitable for X-ray diffraction analysis, were obtained by slow evaporation of the solvent in dichloromethane–acetonitrile solution. Elemental analysis (%) results are listed in Table S6.† Mass and infrared spectra were discussed above.Synthesis of diluted sample Gd@1Y
The procedure was the same as that used for the above except that accurately measured 50![[thin space (1/6-em)]](https://www.rsc.org/images/entities/char_2009.gif) :
:![[thin space (1/6-em)]](https://www.rsc.org/images/entities/char_2009.gif) 1 molar ratios of yttrium(III) and gadolinium(III) chloride was used as rare-earth salt.
1 molar ratios of yttrium(III) and gadolinium(III) chloride was used as rare-earth salt.
[(HBpz3)2Ln(μ-CA˙)Ln(HBpz3)2]−·[CoCp2]+ (2Ln)
Compounds 1Ln were dried under vacuum before being transferred into the glovebox. A sample (0.1 mmol) of 1Ln was dissolved in tetrahydrofuran (20 ml), to which a tetrahydrofuran solution of cobaltocene (0.1 mmol, 10 ml) was added slowly. Immediately, a green precipitate was obtained. The reaction mixture was stirred for another two hours. The precipitate was filtered off, washed several times with tetrahydrofuran, and dried under vacuum. Elemental analysis results are listed in Table S6.† Mass and infrared spectra were discussed above.X-ray data collection and structure determinations
Crystallographic data of complexes 1Dy, 1Tb and 1Y were collected on a Bruker Kappa APEXII Duo diffractometer with a monochromatic Mo-Kα radiation (λ = 0.71073 Å) at 156 (2) K. For complex 1Gd, the data was collected on STOE IPDS II diffractometer equipped with Mo-Kα radiation, a nickel filter and an image plate detector at room temperature. The structures were solved by direct methods and refined on F2 by full-matrix least squares by means of SHELXS-2013 and SHELXL-2013 programs.56 The location of lanthanide atoms was easily determined, and B, Cl, O, N and C atoms were subsequently determined from the difference Fourier maps. All non-hydrogen atoms were refined with anisotropic thermal parameters. The H atoms were introduced in calculated positions and refined with fixed geometry with respect to their carrier atoms. CCDC-1568172 (1Dy), 1568173 (1Tb), 1568174 (1Gd), 1568175 (1Y).† The 1Dy and 1Y were also reported recently by Boskovic et al.11Magnetic measurements
Magnetic susceptibility measurements were carried out using a Quantum Design MPMS3 SQUID magnetometer equipped with a 7 T magnet. The direct current (dc) measurements were performed with an external magnetic field of 1000 Oe in the temperature range 1.8–300 K, and the alternating-current (ac) measurements were measured in a 3.0 Oe ac field oscillating at different frequencies from 0.1 to 1000 Hz. The experimental magnetic susceptibility data are corrected for the diamagnetism estimated from Pascal's tables57 and sample holder calibration.EPR measurements
High-frequency EPR (HFEPR) spectra at 5 K and frequencies between 110 and 450 GHz were recorded on a home-built spectrometer featuring an VDI signal generator, a VDI amplifier-multiplier chain, a Thomas Keating quasi-optical bridge, an Oxford Instruments 15/17 T solenoid cryomagnet and a QMC Instruments InSb hot electron bolometer. The sample was studied as pressed Teflon-wrapped powder pellets. EPR spectra were simulated using the Easyspin program.58 All pulsed measurements were performed on a homebuilt Q-band EPR spectrometer,59 where an Oxford Instruments CF935 continuous flow helium cryostat was used. The sample was dissolved in acetonitrile (1 mM), filled in quartz tubes, degassed by three freeze–pump–thaw cycles followed by flame sealing. Relaxation measurements were performed at the field position of the most intense resonance line. Spin–lattice relaxation times were measured by inversion recovery, phase memory times via Hahn echo pulse sequences; both were fitted with exponential functions.Author contributions
J. v. S. designed and supervised the research; P. Z. synthesized and characterized the complexes; W. F. performed the crystallographic investigation; M. K., M. P. and P. Z. performed the magnetometric and HF-EPR measurements and analyses; P. P. H. and L. U. performed the ab initio calculations under the supervision of H. S. and G. R.; S. L. performed and analyzed the Q-band pulsed EPR measurements; M. R. R. performed the electrochemical experiments; P. Z. and J. v. S. wrote the manuscript with input from all authors.Conflicts of interest
There are no conflicts to declare.Acknowledgements
We acknowledge funding from DFG (SL104/5-1, SPP1601), the Alexander von Humboldt Foundation (postdoctoral fellowship for P. Z.), the Vector foundation, the Foundation of the Federal State of Baden-Württemberg (PhD fellowship to P. P. H.), the Zeiss Foundation (PhD fellowship for S. L.). We thank Ms Luzia S. Germann and Robert E. Dinnebier for assistance in X-ray data collection (1Gd) and Dr Petr Neugebauer for experimental help in the HFEPR measurements.Notes and references
- B. Sarkar, D. Schweinfurth, N. Deibel and F. Weisser, Coord. Chem. Rev., 2015, 293, 250–262 CrossRef.
- J. S. Miller and K. S. Min, Angew. Chem., Int. Ed., 2009, 48, 262–272 CrossRef CAS PubMed.
- M. L. Mercuri, F. Congiu, G. Concas and S. A. Sahadevan, Magnetochemistry, 2017, 3, 17 CrossRef.
- A. Dei, D. Gatteschi, C. Sangregorio and L. Sorace, Acc. Chem. Res., 2004, 37, 827–835 CrossRef CAS PubMed.
- C. Carbonera, A. Dei, J.-F. Létard, C. Sangregorio and L. Sorace, Angew. Chem., Int. Ed., 2004, 43, 3136–3138 CrossRef CAS PubMed.
- K. S. Min, A. G. DiPasquale, J. A. Golen, A. L. Rheingold and J. S. Miller, J. Am. Chem. Soc., 2007, 129, 2360–2368 CrossRef CAS PubMed.
- D. Schweinfurth, Y. Rechkemmer, S. Hohloch, N. Deibel, I. Peremykin, J. Fiedler, R. Marx, P. Neugebauer, J. van Slageren and B. Sarkar, Chem.–Eur. J., 2014, 20, 3475–3486 CrossRef CAS PubMed.
- I.-R. Jeon, J. G. Park, D. J. Xiao and T. D. Harris, J. Am. Chem. Soc., 2013, 135, 16845–16848 CrossRef CAS PubMed.
- S. Demir, I.-R. Jeon, J. R. Long and T. D. Harris, Coord. Chem. Rev., 2015, 289, 149–176 CrossRef.
- A. Dei, D. Gatteschi, C. A. Massa, L. A. Pardi, S. Poussereau and L. Sorace, Chem.–Eur. J., 2000, 6, 4580–4586 CrossRef CAS.
- M. A. Dunstan, E. Rousset, M.-E. Boulon, R. W. Gable, L. Sorace and C. Boskovic, Dalton Trans., 2017, 46, 13756–13767 RSC.
- J. O. Moilanen, A. Mansikkamaki, M. Lahtinen, F.-S. Guo, E. Kalenius, R. A. Layfield and L. F. Chibotaru, Dalton Trans., 2017, 46, 13582–13589 RSC.
- A. Caneschi, A. Dei, D. Gatteschi, L. Sorace and K. Vostrikova, Angew. Chem., Int. Ed., 2000, 39, 246–248 CrossRef CAS PubMed.
- A. Caneschi, A. Dei, D. Gatteschi, C. A. Massa, L. A. Pardi, S. Poussereau and L. Sorace, Chem. Phys. Lett., 2003, 371, 694–699 CrossRef CAS.
- N. Claiser, M. Souhassou, C. Lecomte, B. Gillon, C. Carbonera, A. Caneschi, A. Dei, D. Gatteschi, A. Bencini, Y. Pontillon and E. Lelièvre-Berna, J. Phys. Chem. B, 2005, 109, 2723–2732 CrossRef CAS PubMed.
- S. T. Liddle and J. van Slageren, Chem. Soc. Rev., 2015, 44, 6655–6669 RSC.
- J. D. Rinehart, M. Fang, W. J. Evans and J. R. Long, Nat. Chem., 2011, 3, 538–542 CrossRef CAS PubMed.
- J. D. Rinehart, M. Fang, W. J. Evans and J. R. Long, J. Am. Chem. Soc., 2011, 133, 14236–14239 CrossRef CAS PubMed.
- P. Zhang, Y.-N. Guo and J. Tang, Coord. Chem. Rev., 2013, 257, 1728–1763 CrossRef CAS.
- F. Habib and M. Murugesu, Chem. Soc. Rev., 2013, 42, 3278–3288 RSC.
- S. Demir, J. M. Zadrozny, M. Nippe and J. R. Long, J. Am. Chem. Soc., 2012, 134, 18546–18549 CrossRef CAS PubMed.
- S. Demir, M. Nippe, M. I. Gonzalez and J. R. Long, Chem. Sci., 2014, 5, 4701–4711 RSC.
- B. S. Dolinar, S. Gomez-Coca, D. I. Alexandropoulos and K. R. Dunbar, Chem. Commun., 2017, 53, 2283–2286 RSC.
- C. A. Gould, L. E. Darago, M. I. Gonzalez, S. Demir and J. R. Long, Angew. Chem., Int. Ed., 2017, 56, 10103–10107 CrossRef CAS PubMed.
- F.-S. Guo and R. A. Layfield, Chem. Commun., 2017, 53, 3130–3133 RSC.
- G. F. Xu, Q. L. Wang, P. Gamez, Y. Ma, R. Clérac, J. K. Tang, S. P. Yan, P. Cheng and D. Z. Liao, Chem. Commun., 2010, 46, 1506–1508 RSC.
- N. G. Connelly and W. E. Geiger, Chem. Rev., 1996, 96, 877–910 CrossRef CAS PubMed.
- T. P. Gerasimova and S. A. Katsyuba, J. Organomet. Chem., 2015, 776, 30–34 CrossRef CAS.
- M. Martínez-Pérez, S. Cardona-Serra, C. Schlegel, F. Moro, P. Alonso, H. Prima-García, J. Clemente-Juan, M. Evangelisti, A. Gaita-Ariño, J. Sesé, J. van Slageren, E. Coronado and F. Luis, Phys. Rev. Lett., 2012, 108, 247213 CrossRef PubMed.
- M. Benmelouka, J. Van Tol, A. Borel, M. Port, L. Helm, L. C. Brunel and A. E. Merbach, J. Am. Chem. Soc., 2006, 128, 7807–7816 CrossRef CAS PubMed.
- E. Lucaccini, J. J. Baldoví, L. Chelazzi, A.-L. Barra, F. Grepioni, J.-P. Costes and L. Sorace, Inorg. Chem., 2017, 56, 4728–4738 CrossRef CAS PubMed.
- P.-E. Car, M. Perfetti, M. Mannini, A. Favre, A. Caneschi and R. Sessoli, Chem. Commun., 2011, 47, 3751–3753 RSC.
- S. A. Sulway, R. A. Layfield, F. Tuna, W. Wernsdorfer and R. E. P. Winpenny, Chem. Commun., 2012, 48, 1508–1510 RSC.
- J. D. Rinehart, K. R. Meihaus and J. R. Long, J. Am. Chem. Soc., 2010, 132, 7572–7573 CrossRef CAS PubMed.
- S. D. Jiang, B. W. Wang, G. Su, Z. M. Wang and S. Gao, Angew. Chem., Int. Ed., 2010, 49, 7448–7451 CrossRef CAS PubMed.
- E. Lucaccini, L. Sorace, M. Perfetti, J.-P. Costes and R. Sessoli, Chem. Commun., 2014, 50, 1648–1651 RSC.
- J.-L. Liu, K. Yuan, J.-D. Leng, L. Ungur, W. Wernsdorfer, F.-S. Guo, L. F. Chibotaru and M.-L. Tong, Inorg. Chem., 2012, 51, 8538–8544 CrossRef CAS PubMed.
- L. Zhang, Y.-Q. Zhang, P. Zhang, L. Zhao, M. Guo and J. Tang, Inorg. Chem., 2017, 56, 7882–7889 CrossRef CAS PubMed.
- A. Lunghi, F. Totti, R. Sessoli and S. Sanvito, Nat. Commun., 2017, 8, 14620 CrossRef PubMed.
- K. R. Meihaus, S. G. Minasian, W. W. Lukens, S. A. Kozimor, D. K. Shuh, T. Tyliszczak and J. R. Long, J. Am. Chem. Soc., 2014, 136, 6056–6068 CrossRef CAS PubMed.
- K. R. Meihaus, J. D. Rinehart and J. R. Long, Inorg. Chem., 2011, 50, 8484–8489 CrossRef CAS PubMed.
- K. Bader, D. Dengler, S. Lenz, B. Endeward, S.-D. Jiang, P. Neugebauer and J. van Slageren, Nat. Commun., 2014, 5, 5304 CrossRef CAS PubMed.
- M. Abdus Subhan, R. Kawahata, H. Nakata, A. Fuyuhiro, T. Tsukuda and S. Kaizaki, Inorg. Chim. Acta, 2004, 357, 3139–3146 CrossRef CAS.
- Y. Rechkemmer, J. E. Fischer, R. Marx, M. Dörfel, P. Neugebauer, S. Horvath, M. Gysler, T. Brock-Nannestad, W. Frey, M. F. Reid and J. van Slageren, J. Am. Chem. Soc., 2015, 137, 13114–13120 CrossRef CAS PubMed.
- P. P. Hallmen, C. Köppl, G. Rauhut, H. Stoll and J. v. Slageren, J. Chem. Phys., 2017, 147, 164101 CrossRef CAS PubMed.
- C. Köppl and H.-J. Werner, J. Chem. Theory Comput., 2016, 12, 3122–3134 CrossRef PubMed.
- L. F. Chibotaru and L. Ungur, J. Chem. Phys., 2012, 137, 064112–064122 CrossRef CAS PubMed.
- C. Duboc, Chem. Soc. Rev., 2016, 45, 5834–5847 RSC.
- E. Moreno Pineda, N. F. Chilton, R. Marx, M. Dörfel, D. O. Sells, P. Neugebauer, S.-D. Jiang, D. Collison, J. van Slageren, E. J. L. McInnes and R. E. P. Winpenny, Nat. Commun., 2014, 5, 5243 CrossRef CAS PubMed.
- M. Gysler, F. El Hallak, L. Ungur, R. Marx, M. Hakl, P. Neugebauer, Y. Rechkemmer, Y. Lan, I. Sheikin, M. Orlita, C. E. Anson, A. K. Powell, R. Sessoli, L. F. Chibotaru and J. van Slageren, Chem. Sci., 2016, 7, 4347–4354 RSC.
- C. Benelli and D. Gatteschi, in Introduction to Molecular Magnetism, Wiley-VCH Verlag GmbH & Co. KGaA, 2015, pp. 375–393 Search PubMed.
- J. Krzystek, A. Ozarowski and J. Telser, Coord. Chem. Rev., 2006, 250, 2308–2324 CrossRef CAS.
- A. Caneschi, A. Dei, D. Gatteschi, S. Poussereau and L. Sorace, Dalton Trans., 2004, 1048–1055 RSC.
- A. Dalaloyan, M. Qi, S. Ruthstein, S. Vega, A. Godt, A. Feintuch and D. Goldfarb, Phys. Chem. Chem. Phys., 2015, 17, 18464–18476 RSC.
- W. Kaim and J. Fiedler, Chem. Soc. Rev., 2009, 38, 3373–3382 RSC.
- G. M. Sheldrick, Acta Crystallogr., Sect. A: Found. Crystallogr., 2008, 64, 112 CrossRef CAS PubMed.
- E. A. Boudreaux and L. N. Mulay, Theory and Applications of Molecular Paramagnetism, John Wiley & Sons, New York, 1976 Search PubMed.
- S. Stoll and A. Schweiger, J. Magn. Reson., 2006, 178, 42–55 CrossRef CAS PubMed.
- I. Tkach, A. Baldansuren, E. Kalabukhova, S. Lukin, A. Sitnikov, A. Tsvir, M. Ischenko, Y. Rosentzweig and E. Roduner, Appl. Magn. Reson., 2008, 35, 95–112 CrossRef CAS.
Footnote |
| † Electronic supplementary information (ESI) available: Experimental procedures, crystallography, magnetic properties measurements, and ab initio details. CCDC 1568172–1568175. For ESI and crystallographic data in CIF or other electronic format see DOI: 10.1039/c7sc04873d |
| This journal is © The Royal Society of Chemistry 2018 |

