A pH-responsive stellate mesoporous silica based nanophotosensitizer for in vivo cancer diagnosis and targeted photodynamic therapy†
Ai-Lan
Lin
,
Song-Zi
Li
,
Cai-Hong
Xu
,
Xing-Shu
Li
,
Bi-Yuan
Zheng
,
Jun-Jie
Gu
,
Mei-Rong
Ke
* and
Jian-Dong
Huang
 *
*
College of Chemistry, State Key Laboratory of Photocatalysis on Energy and Environment, Fujian Provincial Key Laboratory of Cancer Metastasis Chemoprevention and Chemotherapy, Fuzhou University, Fuzhou 350116, China. E-mail: kemeirong@fzu.edu.cn; jdhuang@fzu.edu.cn; Fax: +86-591-22866227; Tel: +86-591-22866235
First published on 14th November 2018
Abstract
Development of a photosensitizer that can achieve tumor specificity, improve therapeutic efficacy, and reduce side effects remains a challenge for photodynamic therapy (PDT). In this work, a pH-sensitive activatable nanophotosensitizer (SMSN–ZnPc1) has been elaborately designed, which could be readily prepared by using a functionalized zinc(II) phthalocyanine (ZnPc) to conjugate with stellate mesoporous silica nanoparticles (SMSNs) through an acid-sensitive hydrazone bond. Meanwhile, a non-activatable analogue SMSN–ZnPc2 has also been prepared as a negative control. The fluorescence emission and singlet oxygen generation of the photosensitizer are essentially quenched in the intact nanophotosensitizer. However, these properties of SMSN–ZnPc1 can be restored greatly both in acidic solutions and at the cellular level. More importantly, after intravenous administration, SMSN–ZnPc1 can also be selectively activated at the tumor site and exhibit efficient tumor growth inhibition in S180 rat ascitic tumor-bearing KM mice with negligible systemic toxicity. It thus may serve as a promising nanoplatform for cancer diagnosis and targeted PDT.
1. Introduction
Photodynamic therapy (PDT) is a relatively innovative and minimally invasive therapeutic modality for treatment of various cancers.1,2 It destroys target cells through the combined action of a photosensitizer and molecular oxygen upon irradiation with light to generate reactive oxygen species (ROS), particularly singlet oxygen. The development of a photosensitizer that can achieve tumor specificity, improve therapeutic efficacy, and reduce side effects remains a challenge for PDT. The design of activatable photosensitizers, which can be activated by tumor-associated stimuli and then restore photodynamic activity at the target site, is an effective strategy to overcome the challenge.3,4 Activatable nanophotosensitizers are currently attracting particular attention, owing to their advantages including the prevention of degradation of photosensitizers, reduced non-specific localization of photosensitizers, improvement of therapeutic efficacy, and enhanced tumor targeting to reduce damage to normal tissue.5–9Among various nanocarriers, mesoporous silica nanoparticles (MSNs) have garnered considerable interest due to their desirable properties, such as good physicochemical and mechanical stability, easy selective functionalization on the pore surface or particle surface, low toxicity, and good biocompatibility.10–12 MSNs loaded with photosensitizers for enhanced PDT have also been reported.8,9,13–18 However, for MSN-based activatable nanophotosensitizers, studies on the verification of activatable properties at the in vivo level remain rare,8,19–23 particularly by means of intravenous administration.20–23
Recently, a novel type of stellate mesoporous silica nanoparticles (SMSNs) with center-radial pore structures has emerged.24–26 Due to their unique center-radial structures with large pore channels and highly accessible surface areas, SMSNs exhibit an obvious advantage of loading and releasing large molecules compared with conventional MSNs. It has been reported that SMSNs could easily encapsulate and release various biological molecules,27–31 chemotherapeutic drugs,32 and fluorescent probes.33 Therefore, SMSNs are very promising as carrier platforms. However, using SMSNs as the carriers of photosensitizers so far has hardly been explored. To the best of our knowledge, only Liu's group reported one example, but the photodynamic activity was not demonstrated.34
We thus report herein a pH-responsive nanophotosensitizer, which could be prepared easily by covalently conjugating a hydrazide-functionalized zinc(II) phthalocyanine (ZnPc) with SMSNs through an acid-sensitive hydrazone bond.35–37 The fluorescence and singlet oxygen generation of ZnPc are quenched when it is loaded on SMSNs caused by the aggregation between ZnPc molecules. However, these properties are restored once they are released from the nanocarriers under slightly acidic conditions, such as tumor tissue or endosomal and lysosomal compartments of cancer cells. Consequently, the pH-responsive nanophotosensitizer can also be localized and selectively activated at the tumor site, and exhibits efficient tumor growth inhibition in tumor-bearing mice. Thus, this work would provide a new reference for readily constructing an efficient MSN-based platform for in vivo cancer diagnosis and targeted PDT.
2. Experimental
2.1. Materials and instruments
All the reactions were performed under an atmosphere of nitrogen. N,N-Dimethylformamide (DMF), n-pentanol, and toluene were dried using a Deminex EX-SPS-800 solvent purification system. Chromatographic purifications were performed on silica gel columns (100–200 mesh, Qingdao Haiyang Chemical Co., Ltd, China) with the indicated eluents. Size-exclusion chromatography was carried out using Bio-Rad Bio-Beads S-X3 or S-X1 beads with the indicated eluents. 1-Hydroxybenzotriazole (HOBt) was obtained from Shanghai MEDPEP Co., Ltd, China. 1-Ethyl-3-(3-dimethylaminiopropyl)carbodiimide hydrochloride (EDCI) was bought from TCI Shanghai, China. Triethoxysilylbutyraldehyde and trimethoxysilypropylamine were purchased from Beijing InnoChem Science & Technology Co. Ltd, China. ZnPc238 and SMSNs25 were prepared as previously reported. All other solvents and reagents were of reagent grade and used as received.1H NMR spectra were recorded on a Bruker-400 spectrometer (400 MHz) in DMSO-d6. Chemical shifts were relative to internal SiMe4 (δ = 0 ppm). High-resolution mass spectra (HRMS) were recorded on a Thermo Scientific Exactive Plus LC/MS spectrometer. Dynamic light scattering (DLS) and zeta potential analyses were performed using a Malvern Zeta sizer Nano ZS analyzer. FTIR spectroscopy was performed using a KBr pellet method on a Nicolet iS50 spectrometer in the range of 400–4000 cm−1. Transmission electron microscopy (TEM) was performed using a JEOL JEM 2010 or JEM 2100 transmission electron microscope at an operating voltage of 220 kV. Samples were dispersed in ethanol, deposited on a TEM grid (Electron Microscopy Sciences, CF 200-Cu, carbon film on 200 square mesh copper grids) and dried under air before the TEM analysis. Specific surface areas were measured using the Brunauer–Emmett–Teller (BET) method on a Micromeritics ASAP 2460 size analyzer and the average pore volume was analyzed by the Barrett–Joyner–Halenda (BJH) method. Electronic absorption and fluorescence spectra were obtained on a Shimadzu UV-2450 spectrophotometer and an Edinburgh FS5 spectrofluorometer, respectively.
2.2. Preparation of SMSN–ZnPc1 and SMSN–ZnPc2
![[thin space (1/6-em)]](https://www.rsc.org/images/entities/char_2009.gif) :
:![[thin space (1/6-em)]](https://www.rsc.org/images/entities/char_2009.gif) 1, v/v). IR (KBr, cm−1): 3317 (–NH2), 3053 (Ar–H), 2922, 2851 (CH3, CH2), 1659 (C
1, v/v). IR (KBr, cm−1): 3317 (–NH2), 3053 (Ar–H), 2922, 2851 (CH3, CH2), 1659 (C![[double bond, length as m-dash]](https://www.rsc.org/images/entities/char_e001.gif) O), 1608, 1582, 1506 (C
O), 1608, 1582, 1506 (C![[double bond, length as m-dash]](https://www.rsc.org/images/entities/char_e001.gif) N–, C
N–, C![[double bond, length as m-dash]](https://www.rsc.org/images/entities/char_e001.gif) C), 1332, 1250, 1117, 1092 (C–N, Ar–O–Ar), 737, 723 (Ar–H). HRMS (ESI): m/z calcd for C41H27N10O2Zn [M + H]+ 755.1604, found 755.1606. 1H NMR (DMSO-d6, ppm): 9.15–9.28 (m, 6H, Pc–Hα); 8.96 (s, 1H, –CO–NH–); 8.84 (d, J = 7.2 Hz, 1H, Pc–Hα); 8.13–8.20 (m, 7H, Pc–Hβ); 7.75 (d, J = 8.0 Hz, 1H, Pc–Hβ); 7.43 (d, J = 8.4 Hz, 2H, Ar–H); 7.35 (d, J = 8.4 Hz, 2H, Ar–H); 4.15 (br., 2H, –NH2–); 2.83 (t, J = 8.0 Hz, 2H, CH2); 2.33 (t, J = 8.0 Hz, 2H, CH2).
C), 1332, 1250, 1117, 1092 (C–N, Ar–O–Ar), 737, 723 (Ar–H). HRMS (ESI): m/z calcd for C41H27N10O2Zn [M + H]+ 755.1604, found 755.1606. 1H NMR (DMSO-d6, ppm): 9.15–9.28 (m, 6H, Pc–Hα); 8.96 (s, 1H, –CO–NH–); 8.84 (d, J = 7.2 Hz, 1H, Pc–Hα); 8.13–8.20 (m, 7H, Pc–Hβ); 7.75 (d, J = 8.0 Hz, 1H, Pc–Hβ); 7.43 (d, J = 8.4 Hz, 2H, Ar–H); 7.35 (d, J = 8.4 Hz, 2H, Ar–H); 4.15 (br., 2H, –NH2–); 2.83 (t, J = 8.0 Hz, 2H, CH2); 2.33 (t, J = 8.0 Hz, 2H, CH2).
![[thin space (1/6-em)]](https://www.rsc.org/images/entities/char_2009.gif) 000 rpm for another 2 h. The synthesized SMSNs were centrifuged, washed with ethanol (40 mL × 3) and deionized water (40 mL × 3) respectively, and dried in an oven at 60 °C for 24 h. On sintering the final product in a muffle furnace at 550 °C for 6 h, a white powder of SMSNs (2.8 g) was obtained.
000 rpm for another 2 h. The synthesized SMSNs were centrifuged, washed with ethanol (40 mL × 3) and deionized water (40 mL × 3) respectively, and dried in an oven at 60 °C for 24 h. On sintering the final product in a muffle furnace at 550 °C for 6 h, a white powder of SMSNs (2.8 g) was obtained.
SMSNs (100 mg) were dispersed in toluene (20 mL), and then stirred at 30 °C for 0.5 h, followed by the addition of triethoxysilylbutyraldehyde (200 μL). The mixture was further stirred at 30 °C for 2 h and at 80 °C for another 36 h. The crude product was collected by centrifugation at 12![[thin space (1/6-em)]](https://www.rsc.org/images/entities/char_2009.gif) 000 rpm for 5 min and purified by washing with ethanol (30 mL × 3), re-distilled water (30 mL × 3), and finally with ethanol (20 mL × 2). The product was then dried at 60 °C to obtain SMSN–CHO as a pale-yellow powder (90 mg).
000 rpm for 5 min and purified by washing with ethanol (30 mL × 3), re-distilled water (30 mL × 3), and finally with ethanol (20 mL × 2). The product was then dried at 60 °C to obtain SMSN–CHO as a pale-yellow powder (90 mg).
SMSN–NH2 was prepared using a similar procedure described for SMSN–CHO by replacing triethoxysilylbutyraldehyde with trimethoxysilypropylamine (200 μL).
![[thin space (1/6-em)]](https://www.rsc.org/images/entities/char_2009.gif) 000 rpm for 5 min and purified by washing with DMF (30 mL × 5), re-distilled water (30 mL × 3), and ethanol (20 mL × 3), and then dried at 60 °C to obtain a blue powder (92 mg).
000 rpm for 5 min and purified by washing with DMF (30 mL × 5), re-distilled water (30 mL × 3), and ethanol (20 mL × 3), and then dried at 60 °C to obtain a blue powder (92 mg).
2.3. Spectroscopic studies
![[thin space (1/6-em)]](https://www.rsc.org/images/entities/char_2009.gif) 000 rpm for 5 min at different time intervals. The supernatants (0.1 mL) were transferred and then diluted with DMF to 2.0 mL for fluorescence spectroscopic measurements. At the same time, PBS solutions (0.1 mL) with different pH values were replenished to the corresponding SMSN–ZnPc1 solutions to keep the total volume of the mixture constant.
000 rpm for 5 min at different time intervals. The supernatants (0.1 mL) were transferred and then diluted with DMF to 2.0 mL for fluorescence spectroscopic measurements. At the same time, PBS solutions (0.1 mL) with different pH values were replenished to the corresponding SMSN–ZnPc1 solutions to keep the total volume of the mixture constant.
The procedure for the release study of SMSN–ZnPc2 is the same as that of SMSN–ZnPc1.
2.4. In vitro study
SMSN–ZnPc1 and SMSN–ZnPc2 were first dispersed in DMF to obtain the solutions ([ZnPc1] or [ZnPc2] = 1 mM), which were diluted with PBS solution containing 5% Cremophor EL to 80 μM, and then were further diluted with RPMI 1640 medium to appropriate concentrations.
Cell viability was determined by the colorimetric 3-(4,5-dimethyl-2-thiazolyl)-2,5-diphenyl-2H-tetrazolium bromide (MTT) assay.39 A MTT (Sigma) solution in PBS (20 μL, 5 mg mL−1) was added into each well followed by incubation for 4 h under the same conditions. 150 μL of DMSO was then added into each well. The 96-well plate was agitated on a microplate reader ULTISKAN MK3 (Thermo scientific) at ambient temperature for 20 s before the absorbance at 490 nm at each well was taken. The average absorbance of the blank wells, which did not contain the cells, was subtracted from the readings of the other wells. The cell viability was then determined using the equation: Cell Viability (%) = [∑(Ai/Ācontrol × 100)]/n, where Ai is the absorbance of the ith data (I = 1, 2, …, n), Ācontrol is the average absorbance of the control wells, in which phthalocyanine was absent, and n (≥3) is the number of data points.
2.5. In vivo study
2.6. Statistical analysis
Statistical analyses were performed by using one-way analysis of variance. P values of <0.05 were considered as statistically significant.3. Results and discussion
3.1. Preparations and characterization
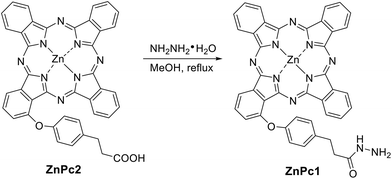
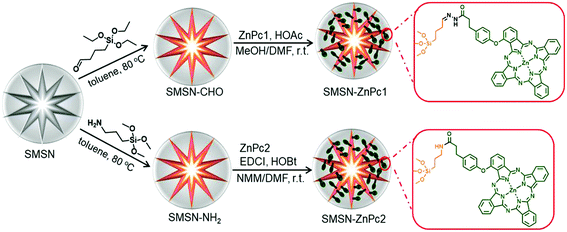
As shown in Scheme 1, ZnPc1 modified with a hydrazide group was synthesized through an amidation of hydrazine hydrate and carboxyl-modified ZnPc2, which was prepared as previously reported.38Scheme 2 shows the synthetic routes to the cleavable nanophotosensitizer (SMSN–ZnPc1) and non-cleavable analogue (SMSN–ZnPc2). The SMSN25 was first modified with the aldehyde group by treating with triethoxysilylbutyraldehyde in toluene to give SMSN–CHO. The cleavable SMSN–ZnPc1, which is linked by an acid-sensitive hydrazone bond, was then prepared by a condensation reaction between ZnPc1 and SMSN–CHO with the catalysis of acetic acid. Similar to SMSN–CHO, amino-modified SMSN–NH2 was prepared by treating SMSN with trimethoxysilypropylamine. Finally, SMSN–NH2 and ZnPc2 underwent an amidation using EDCI and HOBt as activating agents in the presence of N-methylmorpholine (NMM) to obtain the non-cleavable SMSN–ZnPc2. The loading contents of ZnPcs for SMSN–ZnPc1 and SMSN–ZnPc2 were determined to be 9.8 wt% and 14.0 wt%, respectively, by ICP-AES analysis.The morphologies and dimensions of these SMSNs were recorded by transmission electron microscopy (TEM). As shown in Fig. 1a and b, SMSN–CHO and SMSN–ZnPc1 exhibit a stellate spherical morphology and uniform size, with a diameter of ca. 100 nm. Similar results could be observed for SMSN–NH2 and SMSN–ZnPc2 (Fig. S1a and S1b†). The dynamic light scattering (DLS) analysis reveals all four MSNs have a unimodal size distribution with a similar particle size, and the mean hydrodynamic diameters are 141 nm for SMSN–CHO, 163 nm for SMSN–ZnPc1, 161 nm for SMSN–NH2, and 164 nm for SMSN–ZnPc2 (Fig. 1c and S1c†). Meanwhile, their zeta potentials were measured. The zeta potentials of SMSN–CHO (−25.7 mV) and SMSN–ZnPc1 (−29.9 mV) are similar; however it changes from +30.6 mV to −12.7 mV when SMSN–NH2 is loaded with ZnPc2. To further confirm that the SMSNs were modified with ZnPc1, the FTIR spectra of ZnPc1, SMSN–CHO, and SMSN–ZnPc1 were obtained (Fig. 1d). The absorption band at 1720 cm−1 reveals the stretching vibration of the aldehyde group in SMSN–CHO. The C![[double bond, length as m-dash]](https://www.rsc.org/images/entities/char_e001.gif) O of hydrazide in ZnPc1 stretches at 1659 cm−1. For SMSN–ZnPc1, the occurrence of a new stretching peak at 1661 cm−1 (C
O of hydrazide in ZnPc1 stretches at 1659 cm−1. For SMSN–ZnPc1, the occurrence of a new stretching peak at 1661 cm−1 (C![[double bond, length as m-dash]](https://www.rsc.org/images/entities/char_e001.gif) N) suggests the formation of a hydrazine bond. Similarly, the FTIR spectra of ZnPc2, SMSN–NH2, and SMSN–ZnPc2 were compared. As shown in Fig. S1d,† the broad peak at 3300–3500 cm−1 is attributed to the stretching vibrations of NH and OH in SMSN–NH2. The stretching vibration of C
N) suggests the formation of a hydrazine bond. Similarly, the FTIR spectra of ZnPc2, SMSN–NH2, and SMSN–ZnPc2 were compared. As shown in Fig. S1d,† the broad peak at 3300–3500 cm−1 is attributed to the stretching vibrations of NH and OH in SMSN–NH2. The stretching vibration of C![[double bond, length as m-dash]](https://www.rsc.org/images/entities/char_e001.gif) O of ZnPc2 changed from 1730 cm−1 (carboxyl group) to 1640 cm−1 (amide group) after conjugation with SMSN–NH2, indicating that ZnPc2 is linked with SMSN through an amide bond. The BET surface areas (SBET) and average pore volumes were obtained from nitrogen adsorption–desorption isotherms (Fig. S2†). The SBET and pore volume for SMSN–CHO are 202 m2 g−1 and 0.41 cm3 g−1, while for SMSN–ZnPc1, they lowered to 59 m2 g−1 and 0.22 cm3 g−1, respectively, due to the loading of ZnPc1. For SMSN–ZnPc2, the SBET and pore volume also significantly reduced in contrast to SMSN–NH2 (SBET = 255 m2 g−1 and pore volume = 0.84 cm3 g−1 for SMSN–NH2, SBET = 148 m2 g−1 and pore volume = 0.57 cm3 g−1 for SMSN–ZnPc2), suggesting that ZnPc2 was also loaded on the SMSNs.
O of ZnPc2 changed from 1730 cm−1 (carboxyl group) to 1640 cm−1 (amide group) after conjugation with SMSN–NH2, indicating that ZnPc2 is linked with SMSN through an amide bond. The BET surface areas (SBET) and average pore volumes were obtained from nitrogen adsorption–desorption isotherms (Fig. S2†). The SBET and pore volume for SMSN–CHO are 202 m2 g−1 and 0.41 cm3 g−1, while for SMSN–ZnPc1, they lowered to 59 m2 g−1 and 0.22 cm3 g−1, respectively, due to the loading of ZnPc1. For SMSN–ZnPc2, the SBET and pore volume also significantly reduced in contrast to SMSN–NH2 (SBET = 255 m2 g−1 and pore volume = 0.84 cm3 g−1 for SMSN–NH2, SBET = 148 m2 g−1 and pore volume = 0.57 cm3 g−1 for SMSN–ZnPc2), suggesting that ZnPc2 was also loaded on the SMSNs.
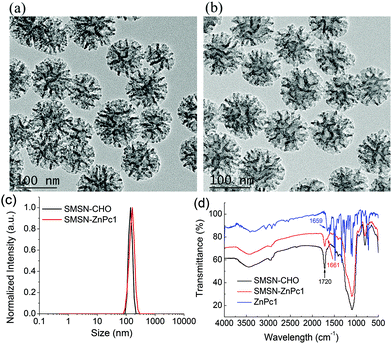 | ||
| Fig. 1 TEM images of (a) SMSN–CHO and (b) SMSN–ZnPc1, particle size distribution of (c) SMSN–CHO and SMSN–ZnPc1, and (d) FTIR spectra of SMSN–CHO, SMSN–ZnPc1, and ZnPc1. | ||
3.2. Spectroscopic and photosensitizing properties
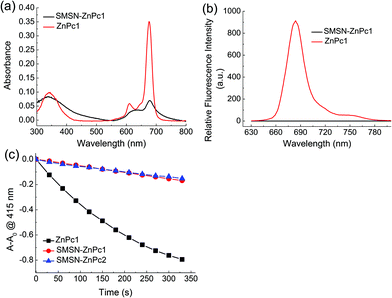
The electronic absorption and fluorescence spectra of the free ZnPcs (ZnPc1 and ZnPc2) and nanophotosensitizers (SMSN–ZnPc1 and SMSN–ZnPc2) were obtained in PBS. As shown in Fig. 2a and Fig. S3a,† both the free ZnPc1 and ZnPc2 show a typical non-aggregated electronic absorption spectrum of phthalocyanine, with a strong and sharp Q band at 676–677 nm, while the Q bands of both nanophotosensitizers are weakened and broadened significantly, suggesting that the ZnPcs are greatly aggregated when loaded on the SMSNs. The results are further supported by their fluorescence spectra (Fig. 2b and Fig. S3b†). Compared with that of the free ZnPcs, the fluorescence intensities of both SMSN–ZnPc1 and SMSN–ZnPc2 are substantially reduced. Their fluorescence is hardly observed with the quenching efficiency up to ca. 100% on comparing the integral areas of fluorescence spectra.In addition, the quenching effects of singlet oxygen were also evaluated by comparing the singlet oxygen generation efficiency induced by ZnPc1 and the nanophotosensitizers. It can be seen from Fig. 2c and S4† that ZnPc1 could induce the decay of DPBF quickly upon illumination. By contrast, both SMSN–ZnPc1 and SMSN–ZnPc2 could not generate singlet oxygen efficiently under the same conditions. The quenching efficiency of SMSN–ZnPc1 was found to be ca. 82% according to the decay rates of DPBF. The results indicate that the photoactivities of ZnPcs, including both fluorescence emission and singlet-oxygen generation, could be quenched considerably by loading on the SMSNs. This could thus avoid some side effects on normal tissue before the PDT effect.
3.3. pH-Controlled release properties
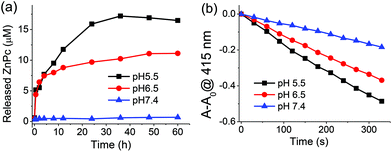
The pH-controlled release properties were demonstrated by measuring the fluorescence spectra of the nanophotosensitizers at different pH values of 7.4, 6.5, and 5.5, which were used to simulate the physiological environments of normal tissues/blood, tumor tissues, and lyso-/endosomes, respectively. As shown in Fig. 3a and S5a,† it can be found that the release of phthalocyanine from SMSN–ZnPc1 is both time- and pH-dependent. The fluorescence intensity of SMSN–ZnPc1 hardly changed at pH 7.4 over 60 h, while at pH 5.5, the fluorescence intensity increased significantly over time, and reached a plateau at 36 h with an about 28-fold enhancement. An obvious increase of fluorescence intensity could also be observed for SMSN–ZnPc1 at pH 6.5, and the intensity was enhanced 22-fold at 36 h. By contrast, for the non-cleavable SMSN–ZnPc2, there was almost no change in the fluorescence intensity at all the three pH values over time (Fig. S5b and S5c†).The pH-controlled release was further confirmed by comparing the singlet oxygen generation efficiency of SMSN–ZnPc1 and SMSN–ZnPc2 after incubation in PBS at different pH values for 24 h. It can be seen from Fig. 3b that the photodegradation rate of DPBF induced by SMSN–ZnPc1 is significantly increased in acidic solutions, especially at pH 5.5, while at pH 7.4 after incubation for 24 h it hardly changes relative to the case at 0 h (Fig. 2c). However, the singlet oxygen generation efficiencies of SMSN–ZnPc2 at all the different pH values are very close to the case of SMSN–ZnPc1 at pH 7.4 (Fig. S6†). These results suggest that SMSN–ZnPc1 is stable at pH 7.4, and the acid-sensitive hydrazone linker can be cleaved efficiently and release ZnPc1 to recover the photosensitizing properties under weakly acidic conditions.
3.4. In vitro studies
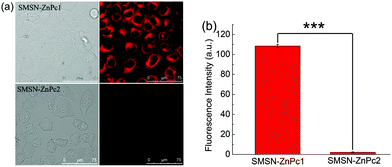
The activation of SMSN–ZnPc1 was further demonstrated in HeLa cells by comparing the intracellular fluorescence intensity of SMSN–ZnPc1 and SMSN–ZnPc2. Fig. 4a shows their intracellular fluorescence images. Strong fluorescence could be observed for SMSN–ZnPc1, whereas there was hardly any intracellular fluorescence for SMSN–ZnPc2. The on–off fluorescence ratio was up to 49-fold (Fig. 4b), which was significantly higher than that previously reported (16-fold).8 The results reveal that SMSN–ZnPc1 could be internalized and activated effectively, but SMSN–ZnPc2 could not.The subcellular localization of SMSN–ZnPc1 in HeLa cells was evaluated by confocal laser scanning microscopy (CLSM). The cells were incubated with SMSN–ZnPc1 and then Lyso-Tracker, followed by Mito-Tracker. The fluorescence images of the phthalocyanine and the two trackers were captured. As shown in Fig. S7,† the intracellular fluorescence of phthalocyanine was distributed in the whole cytoplasm, and the fluorescence was overlapped with that of both Lyso-Tracker and Mito-Tracker. It is probable that SMSN–ZnPc1 was internalized into acidic subcellular organelles, and then was activated to release phthalocyanine, which was spread in the cytoplasm.
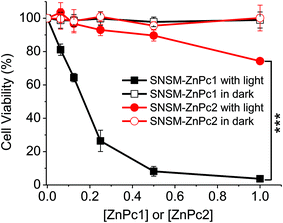
To demonstrate the pH-responsive effect of the nanophotosensitizer on in vitro photodynamic activity, the cytotoxicities of SMSN–ZnPc1 and SMSN–ZnPc2 against HeLa cells were investigated both in the dark and upon irradiation by MTT assay. As shown in Fig. 5, both SMSN–ZnPc1 and SMSN–ZnPc2 showed no cytotoxicity in the absence of light, but upon irradiation, they presented considerably different cytotoxicities. SMSN–ZnPc1 is highly potent, with an IC50 value of 172 nM (calculated on the concentration of ZnPc1), whereas SMSN–ZnPc2 exhibited very low photocytotoxicity, with about 26% cell lethality at 1 μM (calculated on the concentration of ZnPc2). The results indicate again that SMSN–ZnPc1 can be activated in cells induced by the acidic subcellular organelles. Moreover, it would greatly decrease the cytotoxicity under physiologically neutral conditions even upon irradiation, according to the photocytotoxicity of the analogue of SMSN–ZnPc2.
The mechanism of photocytotoxicity was further examined by an intracellular ROS assay, by using DCFDA as the probe. The non-fluorescent DCFDA is converted to fluorescent 2′,7′-dichlorofluorescein (DCF) when reacted with ROS within cells. HeLa cells were incubated with SMSN–ZnPc1 or SMSN–ZnPc2 and then DCFDA, followed by irradiation. The intracellular fluorescence of DCF was observed by CLSM. As shown in Fig. S8,† both the cells incubated with SMSN–ZnPc1 and SMSN–ZnPc2 hardly showed DCF fluorescence without irradiation; however, the intracellular fluorescence for SMSN–ZnPc1 is much stronger than that for SMSN–ZnPc2 upon irradiation, suggesting that SMSN–ZnPc1 is able to generate ROS more efficiently than SMSN–ZnPc2. Thus, the high photocytotoxicity of SMSN–ZnPc1 could be attributed to the highly efficient intracellular ROS generation.
3.5. In vivo studies
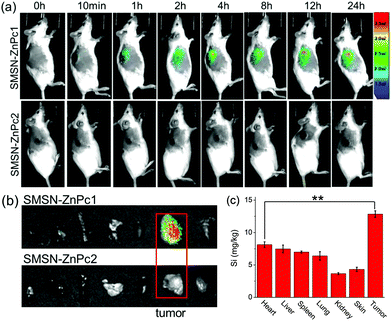
The in vivo activation of SMSN–ZnPc1 was also investigated, and SMSN–ZnPc2 was used as the negative control. Female KM mice bearing S180 rat ascitic tumors were treated with an intravenous dose of SMSN–ZnPc1 or SMSN–ZnPc2 (200 μM, 100 μL in saline with 0.5% Cremophor EL). Fig. 6a shows their fluorescence images monitored continuously up to 24 h. For the mice injected with SMSN–ZnPc1, the fluorescence signal appeared only at the tumor site after injection for 1 h, and the intensity increased gradually over the first 12 h. In the following 12 h, the fluorescence intensity did not change obviously. In contrast, in the case of non-cleavable SMSN–ZnPc2, nearly no fluorescence signal was observed on the whole body over all detecting time.To further confirm the distribution and activation of these nanophotosensitizers in the body, the mice were sacrificed after 24 h post-injection, and then the fluorescence of the tumor and major organs, including the heart, liver, spleen, lung, kidney, and skin, was compared. As shown in Fig. 6b, it was clear that the fluorescence could be seen only in the tumor of the mice treated with SMSN–ZnPc1, while in the case of SMSN–ZnPc2, no fluorescence signal appeared in both these organs and tumors. In addition, the content of Si in the mice treated with SMSN–ZnPc1 was also measured by ICP-AES assay to further confirm the distribution of the nanophotosensitizer in the body. As shown in Fig. 6c, silicon was found both in the tumor and major organs, with the highest value in the tumor, which is probably due to the enhanced permeability and retention (EPR) effect caused by the modification of SMSN with ZnPc. The results suggest that SMSN–ZnPc1 could be preferentially distributed and only activated at the tumor site, although some nanophotosensitizer was also found in the other organs. It is worth noting that the MSN-based nanophotosensitizers that can selectively be activated in the tumor site through intravenous administration are still rare.22,23 With this property of activation-triggered fluorescence, specifically in tumor tissue, SMSN–ZnPc1 can act as a promising candidate for cancer diagnosis and targeted treatment.
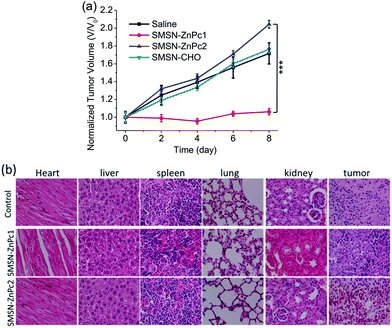
Finally, the in vivo PDT effect of SMSN–ZnPc1 was evaluated on S180 rat ascitic tumor-bearing KM mice using SMSN–ZnPc2, SMSN–CHO, and saline as controls. The mice were treated with an intravenous injection of the SMSN–ZnPc1, SMSN–ZnPc2, SMSN–CHO, and saline, respectively. The tumor was illuminated with a laser at 685 nm for 6 min after 12 h post-injection. After 48 h, the PDT treatment was repeated once again. The tumor size was monitored continuously since the mice were subjected to the first PDT treatment. As shown in Fig. 7a, the tumor size of mice PDT-treated with SMSN–ZnPc1 retained its original size up to 8 days, suggesting that SMSN–ZnPc1 can effectively suppress tumor growth, whereas for the group treated with SMSN–CHO or saline, the tumor continues to grow over time. In the case of SMSN–ZnPc2, it showed a similar tumor growth trend to the blank control, which is probably attributed to the inactivation of the photosensitizer in the non-cleavable nanoparticles. Furthermore, a histological analysis of the tumor tissue and the major organs (heart, liver, spleen, lung, and kidney) was carried out using the H&E staining assay to confirm the PDT effect and evaluate the systemic toxicity. As can be seen from Fig. 7b, there was a large amount of dead cells in tumor tissue from the mice treated with SMSN–ZnPc1, while for the other two groups (control and SMSN–ZnPc2), few dead cells were observed in the tumor tissues, indicating that the tumor tissue could be destroyed by SMSN–ZnPc1, but SMSN–ZnPc2 was hardly effective. Besides, the results of H&E staining of the major organs showed there are no obvious histopathological lesions toward these organs for all the three groups, implying that the systemic toxicity is negligible for the above treatments. In addition, the negligible systemic toxicity was also confirmed by monitoring the body weight changes, which showed a slight increase for all the three groups after 8 days (Fig. S9†). The results revealed again that SMSN–ZnPc1 was able to be selectively activated at the tumor site and exerted an efficient PDT effect with negligible systemic toxicity.
4. Conclusion
We have prepared a pH-sensitive nanophotosensitizer (SMSN–ZnPc1) by a simple and mild method, in which a functionalized ZnPc is conjugated with a SMSN through an acid-sensitive hydrazone bond. The fluorescence emission and singlet oxygen generation of the ZnPc are essentially quenched in the intact nanophotosensitizer. However, these properties of SMSN–ZnPc1 can be restored greatly in slightly acidic solutions. It can also be activated inside tumor cells and generated ROS efficiently, leading to remarkably higher photocytotoxicity against HeLa cells relative to the non-cleavable analogue. What is more, SMSN–ZnPc1 can be selectively activated at the tumor site through intravenous injection, and exhibits efficient tumor growth inhibition in S180 rat ascitic tumor-bearing KM mice with negligible systemic toxicity. It can thus serve as a promising platform for in vivo cancer diagnosis and targeted PDT.Conflicts of interest
There are no conflicts of interest to declare.Acknowledgements
This work was supported by the National Natural Science Foundation of China (Grant No. 21301031, 21473033, and U1705282).References
- A. P. Castano, P. Mroz and M. R. Hamblin, Nat. Rev. Cancer, 2006, 6, 535–545 CrossRef CAS PubMed.
- A. Juarranz, P. Jaén, F. Sanz-Rodríguez, J. Cuevas and S. González, Clin. Transl. Oncol., 2008, 10, 148–154 CrossRef CAS PubMed.
- J. F. Lovell, T. W. Liu, J. Chen and G. Zheng, Chem. Rev., 2010, 110, 2839–2857 CrossRef CAS PubMed.
- X. Li, S. Kolemen, J. Yoon and E. U. Akkaya, Adv. Funct. Mater., 2017, 27, 1604053–1604063 CrossRef.
- X. Li, B.-Y. Zheng, M.-R. Ke, Y. Zhang, J.-D. Huang and J. Yoon, Theranostics, 2017, 7, 2746–2756 CrossRef CAS PubMed.
- D. Hu, Z. Sheng, G. Gao, F. Siu, C. Liu, Q. Wan, P. Gong, H. Zheng, Y. Ma and L. Cai, Biomaterials, 2016, 93, 10–19 CrossRef CAS PubMed.
- Z. Yu, Q. Sun, W. Pan, N. Li and B. Tang, ACS Nano, 2015, 9, 11064–11074 CrossRef CAS PubMed.
- R. Wong, S. Y. S. Chow, S. Zhao, W.-P. Fong, D. K. P. Ng and P.-C. Lo, ACS Appl. Mater. Interfaces, 2017, 9, 23487–23496 CrossRef CAS PubMed.
- R. Wong, D. K. P. Ng, W.-P. Fong and P.-C. Lo, Chem. – Eur. J., 2017, 23, 16505–16515 CrossRef CAS PubMed.
- X. Du, Adv. Theranostic Mater., 2015, 67–92 CAS.
- J. Zhu, Y. Niu, Y. Li, Y. Gong, H. Shi, Q. Huo, Y. Liu and Q. Xu, J. Mater. Chem. B, 2017, 5, 1339–1352 RSC.
- W. Cha, R. Fan, Y. Miao, Y. Zhou, C. Qin, X. Shan, X. Wan, Q. Xin and J. Li, Molecules, 2017, 22, 7821–78219 Search PubMed.
- H. S. Qian, H. C. Guo, P. C. Ho, R. Mahendran and Y. Zhang, Small, 2009, 5, 2285–2290 CrossRef CAS PubMed.
- J. L. Vivero-Escoto and M. Elnagheeb, Nanomater., 2015, 5, 2302–2316 CrossRef CAS PubMed.
- X. Ma, Q. Qu and Y. Zhao, ACS Appl. Mater. Interfaces, 2015, 7, 10671–10676 CrossRef CAS PubMed.
- F. Xu, L. Ding, W. Tao, X. Yang, H. Qian and R. Yao, Mater. Lett., 2016, 167, 205–208 CrossRef CAS.
- A. Kamkaew, L. Cheng, S. Goel, H. F. Valdovinos, T. E. Barnhart, Z. Liu and W. Cai, ACS Appl. Mater. Interfaces, 2016, 8, 26630–26637 CrossRef CAS PubMed.
- E. Gianotti, E. B. Martins, F. Cucinotta, N. Hioka, M. Rizzi, F. Renò and L. Marchese, Chem. – Eur. J., 2015, 20, 10921–10925 CrossRef PubMed.
- H. Fan, L. Zhang, X. Hu, Z. Zhao, H. Bai, X. Fu, G. Yan, L.-H. Liang, X.-B. Zhang and W. Tan, Chem. Commun., 2018, 54, 4310–4313 RSC.
- Y. Liu, Y. Liu, W. Bu, C. Cheng, C. Zuo, Q. Xiao, Y. Sun, D. Ni, C. Zhang, J. Liu and J. Shi, Angew. Chem., Int. Ed., 2015, 54, 8105–8109 CrossRef CAS PubMed.
- L. Zeng, Y. Pan, R. Zou, J. Zhang, Y. Tian, Z. Teng, S. Wang, W. Ren, X. Xiao, J. Zhang, L. Zhang, A. Li, G. Lu and A. Wu, Biomaterials, 2016, 103, 116–127 CrossRef CAS PubMed.
- Q. Sun, Q. You, X. Pang, X. Tan, J. Wang, L. Liu, F. Guo, F. Tan and N. Li, Biomaterials, 2017, 122, 188–200 CrossRef CAS PubMed.
- J. Liu, H. Liang and M. Li, Biomaterials, 2018, 157, 107–124 CrossRef CAS PubMed.
- V. Polshettiwar, D. Cha, X. Zhang and J. M. Basset, Angew. Chem., Int. Ed., 2010, 49, 9652–9656 CrossRef CAS PubMed.
- K. Zhang, L. L. Xu, J. G. Jiang, N. Calin, K. F. Lam, S. J. Zhang, H. H. Wu, G. D. Wu, B. Albela and L. Bonneviot, J. Am. Chem. Soc., 2013, 135, 2427–2430 CrossRef CAS PubMed.
- X. Du and S. Z. Qiao, Small, 2015, 11, 392–413 CrossRef CAS PubMed.
- X. Du, B. Shi, Y. Tang, S. Dai and S. Z. Qiao, Biomaterials, 2014, 35, 5580–5590 CrossRef CAS PubMed.
- C. Tao, Y. Zhu, Y. Xu, M. Zhu, H. Morita and N. Hanagata, Dalton Trans., 2014, 43, 5142–5150 RSC.
- Y. Lu, Y. Yang, Z. Gu, J. Zhang, H. Song, G. Xiang and C. Yu, Biomaterials, 2018, 175, 82–92 CrossRef CAS PubMed.
- Z. Tian, Y. Xu and Y. Zhu, Mater. Sci. Eng., C, 2016, 71, 452–459 CrossRef PubMed.
- A. Kienzle, S. Kurch, J. Schlöder, C. Berges, R. Ose, J. Schupp, A. Tuettenberg, H. Weiss, J. Schultze and S. Winzen, Adv. Healthcare Mater., 2017, 6, 1700012 CrossRef PubMed.
- M. Huang, L. Liu, S. Wang, H. Zhu, D. Wu, Z. Yu and S. Zhou, Langmuir, 2016, 33, 519–526 CrossRef PubMed.
- R. Cheng, F. Kong, L. Tong, X. Liu, K. Xu and B. Tang, Anal. Chem., 2018, 90, 8116–8122 CrossRef CAS PubMed.
- K. Yu, X. Zhang, H. Tong, X. Yan and S. Liu, Mater. Lett., 2013, 106, 151–154 CrossRef CAS.
- C.-H. Lee, S.-H. Cheng, I.-P. Huang, J. S. Souris, C.-S. Yang, C.-Y. Mou and L.-W. Lo, Angew. Chem., Int. Ed., 2010, 122, 8390–8395 CrossRef.
- Y. Bae, N. Nishiyama and K. Kataoka, Bioconjugate Chem., 2007, 18, 1131–1139 CrossRef CAS PubMed.
- J.-Z. Du, X.-J. Du, C.-Q. Mao and J. Wang, J. Am. Chem. Soc., 2011, 133, 17560–17563 CrossRef CAS PubMed.
- M.-R. Ke, S.-F. Chen, X.-H. Peng, Q.-F. Zheng, B.-Y. Zheng, C. K. Yeh and J.-D. Huang, Eur. J. Med. Chem., 2017, 127, 200–209 CrossRef CAS PubMed.
- H. Tada, O. Shiho, K. Kuroshima, M. Koyama and K. Tsukamoto, J. Immunol. Methods, 1986, 93, 157–165 CrossRef CAS PubMed.
Footnote |
| † Electronic supplementary information (ESI) available. See DOI: 10.1039/c8bm00386f |
| This journal is © The Royal Society of Chemistry 2019 |

