Layer-by-layer deposition of chitosan nanoparticles as drug-release coatings for PCL nanofibers†
Steffen
Sydow
a,
Dominik
de Cassan
a,
Robert
Hänsch
b,
Thomas R.
Gengenbach
c,
Christopher D.
Easton
c,
Helmut
Thissen
 c and
Henning
Menzel
 *a
*a
aInstitute for Technical Chemistry, Braunschweig University of Technology, Braunschweig, Germany. E-mail: h.menzel@tu-braunschweig.de
bInstitute of Plant Biology, Braunschweig University of Technology, Braunschweig, Germany
cCSIRO Manufacturing, Clayton, Australia
First published on 26th November 2018
Abstract
Nanogels were prepared by ionotropic gelation of chitosan (CS) with tripolyphosphate (TPP). The use of such nanogels to prepare coatings by layer-by-layer deposition (LbL) was studied. The nanogels were characterized in terms of particle size, zeta-potential and stability. Nanogel suspensions were used to build polyelectrolyte multilayers on silicon wafers and on PCL fiber mats by LbL-deposition. Three different polysaccharides were used as polyanions, namely chondroitin sulfate, alginate and hyaluronic acid. The ellipsometric thickness was demonstrated to depend significantly on the type of polyanion. XPS analysis with depth profiling further substantiated the differences in the chemical composition of the films with the different polyanions. Furthermore, XPS data clearly indicated a strong penetration of the polyanions into the CS-TPP layer, resulting in a complete exchange and release of the TPP ions. The LbL-deposition also was studied with PCL fiber mats, which were modified with a chitosan-PCL-graft polymer and alginate. The possibility to create graded coatings on the fiber mats was shown employing fluorescently labelled CS–TPP nanoparticles. The potential of the coatings as drug delivery system for therapeutic proteins was exemplified with the release of Transforming Growth Factor β3 (TGF-β3). The CS–TPP nanogels were shown to encapsulate and release therapeutic proteins. In combination with the layer-by-layer deposition they will allow the creation of PCL fiber mat implants having with drug gradients for applications at tissue transitions.
Introduction
There is a rising interest in electrospun poly(ε-caprolactone) (PCL) fiber mats for three-dimensional tissue-engineering applications. PCL is promising because of its good mechanical properties and good biocompatibility. However, it is a bio-inert material, which has limited interaction with cells.1 For tissue engineering applications, and here in particular for an application as a cell instructive implant, the fiber mats have to be functionalized to release, for example, signaling proteins. We have suggested a combination of a modification of PCL fiber surfaces and subsequent functionalization with drug delivery systems for signaling proteins to create such cell instructive implants.2Members of the TGF-β family such as Bone Morphogenic Protein 2 (BMP2) or Transforming Growth Factor beta 3 (TGF-β3) are proteins which regulate cell proliferation, differentiation and apoptosis.3,4 For example BMP2 is a signaling protein that promotes in vivo bone formation.5,6 TGF-β3 shows important functions in the early embryonic development7 and stimulates cartilage matrix elaboration by human marrow-derived stromal cells.8 The way of delivery of the signaling protein, that is the drug delivery system used, is an important factor for its biological activity as has been shown for BMP2.9,10 Films of chitosan have been used to immobilize BMP2 on surfaces with good results in in vivo-experiments.11,12 On the other hand nanoparticulate hydrogels have been suggested to be very useful drug delivery systems for signaling proteins.13–16 In fact nanogels prepared by ionotropic gelation of chitosan (CS) with tripolyphosphophate (TPP) were proven for controlled and sustained release of biologically active BMP2.14 Furthermore, it was shown that they form homogeneous coatings on titanium and release biologically active BMP2 in amounts sufficient to even induce ectopic bone formation.14 The bone inducing action of the BMP2 was supported by the CS–TPP system due to osteoinductive properties of chitosan.17 Their biocompatibility and biodegradability were proven in several studies18,19 and both components are approved by regulatory bodies for use in human.20 Additionally, the degradation products of CS–TPP nanoparticles are biocompatible as well.21,22 The CS–TPP nanogels showed a positive zeta-potential, that is they were positively charged and therefore, adsorbed to negatively charged surfaces.
The LbL-technique for polyelectrolyte multilayer preparation was proven to be a suitable tool for multilayer formation on substrates, which also can be applied to incorporate nanoparticles.23 The advantages of the LbL-technique are a simple setup resulting in low production costs, modular surface modification by variation of the solution composition, pH, dipping time and ionic strength or the polyelectrolyte itself.24,25 It was shown that LbL-multilayer films can be prepared by scalable and efficient spray processes, suitable for an industrial production of drug delivery coatings.26 The LbL-technique bases on electrostatic interactions between a positive and a negative polyelectrolyte or particle to form a stable polymer or hybrid film.27–30 However, LbL-films do not always grow in a linear fashion, but an exponential growth, that is the increment in layer thickness increased with the number of steps, was observed. While strong polyelectrolyte pairs like polystyrene sulfonate and polyallyamine hydrochloride showed a linear growth, pairs of weaker polyelectrolytes like poly-L-lysine and hyaluronic acid (Hya) showed a more complex growth.31 The growth mode strongly depended on the ionic strength of the polyanions and based on the diffusion of one of the polyelectrolyte species.31–33 Chitosan (chemical structure is depicted in Fig. 1) was used as polycation to prepare multi-layered films by the LbL-technique and typically behaved as a weak polyelectrolyte.31,33–41 Besides chitosan, other polysaccharides were used for the LbL-technique (chemical structures are depicted in Fig. 1). HA and chondroitin sulfate (Cho) are glucosaminglycans having an anionic group on each disaccharide unit. While it is a strongly ionic sulfate group in the case of Cho (pKa ∼ 2.6),42 it is a weaker ionic carboxylate group in the case of HA (pKa ∼ 2.9).40,43 Besides, the ionic groups Cho and HA bear amide groups which might result in non-ionic interaction and can play a role in the LbL-multilayer formation.39 Alginate is an anionic polysaccharide comprising of two monosaccharide units with an acid group (manuronic acid and guluronic acid). A pKa ∼ 3.5 was reported for alginate (3.38 and 3.65 for guluronic acid and mannuronic acid, respectively).44
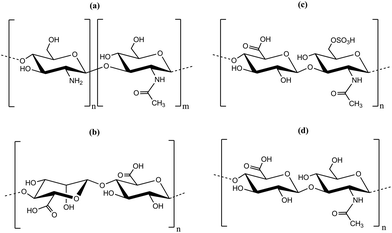 | ||
| Fig. 1 Chemical structure of polyelectrolytes used for the preparation of multilayers by layer-by-layer deposition (LbL): (a) chitosan, (b) alginate, (c) chondroitin sulfate and (d) hyaluronic acid. | ||
For preparation of cell instructive implants for tissue transitions, e.g. a bone-tendon-transition, it is desirable to have spatiotemporal control of the release of more than one signaling protein. The temporal control can be accomplished by the combination of LbL-technique with nanogel based protein release systems. Furthermore, a more sophisticated spatial control and creation of gradients along the implants should be possible by varying the dipping depth.45 Recently we showed that a surface crystallization induced modification of electrospun polycaprolacton (PCL) nanofiber mats with a chitosan-PCL graft copolymer and adsorption of an alginate layer allowed subsequent attachment of CS–TPP nanoparticles to the fiber mats.2 Thus, the LbL-method with a CS–TPP nanoparticle system can be used to functionalize the fiber mats. However, little is known about the mechanism of the attachment of the nanoparticles to the surface and their transformation into a film.14,32,33,46 The nanoparticles can be regarded as small hydrogel particles formed by crosslinking the chitosan with polyanionic tripolyphosphate ions. The positive zeta-potential of the nanoparticles indicates that not all of the cationic amino groups of the chitosan were compensated by polyanions. Therefore, the remaining cationic chitosan could form a corona around the particle, which stabilizes the dispersion. However, the questions arises, what is the structure of a dried films and how is this structure changed when in a second dipping step a polyanion is added. The mechanism can be supposed to be first film formation as observed for water-based lacquers, that is polymeric particles are moving closer upon vaporization of the water and a subsequent coalescence of the particles occurs.47 Subsequently in the LbL-process diffusion of the polyions in and out of the films may result in structural reorganization.32,33,46 Recently, X-ray photoelectron spectroscopy (XPS) with depth profiling by etching with cluster ions was proven as a valuable tool to assess the internal structure of LbL-films.39,48
Here, we report on two sets of experiments. First, we created multilayer systems with CS–TPP as polycationic compound and used alginate, chondroitin sulfate and hyaluronic acid as negatively charged biopolymers on silicon wafers. These layer systems are models for the intended drug delivery system, which allow applying XPS with depth profiling, to elucidate the internal structure of the film.
Secondly, proof was given that these multilayer systems can be transferred to 3D structures. For this PCL nanofiber mats have been modified with CS-g-PCL graft copolymers and then coated with different fluorescently labelled CS–TPP nanoparticles. Furthermore, the release of TGF-β3 from such coatings was monitored.
Materials and methods
Unless otherwise stated all chemicals including PCL (Mn = 80![[thin space (1/6-em)]](https://www.rsc.org/images/entities/char_2009.gif) 000 g mol−1) and chitosan (Mn = 110
000 g mol−1) and chitosan (Mn = 110![[thin space (1/6-em)]](https://www.rsc.org/images/entities/char_2009.gif) 000–150
000–150![[thin space (1/6-em)]](https://www.rsc.org/images/entities/char_2009.gif) 000 g mol−1), alginate and hyaluronic acid used in this study were purchased from Sigma-Aldrich. Chondroitin sulfate (90%) was obtained from Alfa Aesar.
000 g mol−1), alginate and hyaluronic acid used in this study were purchased from Sigma-Aldrich. Chondroitin sulfate (90%) was obtained from Alfa Aesar.
Chitosan (Mn = 80![[thin space (1/6-em)]](https://www.rsc.org/images/entities/char_2009.gif) 000 g mol−1) was purified according to a method published by Gan et al.49 Briefly, chitosan (CS) was mixed with sodium hydroxide solution (1 g of chitosan in 10 mL of 1 M sodium hydroxide) and stirred for 2 h at 70 °C. Chitosan flakes were filtered off, washed with deionized water and were dissolved in 1% (w/v) acetic acid. Subsequently, the chitosan solution was filtered and dialyzed (Mw-cut off 10 kDa) in deionized water. Finally, the solution was lyophilized.
000 g mol−1) was purified according to a method published by Gan et al.49 Briefly, chitosan (CS) was mixed with sodium hydroxide solution (1 g of chitosan in 10 mL of 1 M sodium hydroxide) and stirred for 2 h at 70 °C. Chitosan flakes were filtered off, washed with deionized water and were dissolved in 1% (w/v) acetic acid. Subsequently, the chitosan solution was filtered and dialyzed (Mw-cut off 10 kDa) in deionized water. Finally, the solution was lyophilized.
Acetylation of chitosan
Chitosan acetylation was carried out following a method by Freier et al.50 Purified chitosan with a degree of acetylation (DA) of 17% was dissolved in 1% (v/v) acetic acid to reach a concentration of 5 mg mL−1. After complete dissolution, the volume of the acetic chitosan solution was doubled with ethanol. Acetic acid anhydride was added to the solution in an amount calculated according to Freier et al.50 The mixture was stirred for 18 h at room temperature. The acetylated chitosan was dialyzed against deionized water and subsequently lyophilized. The degree of DA was calculated from 1H-NMR spectra to 42%.Synthesis of chitosan/TPP-nanoparticles
Purified chitosan was dissolved in 0.1% (v/v) acetic acid with a concentration of 1 mg mL−1 CS. TPP was dissolved in Millipore water to yield a 1 mg mL−1 solution. After completing the dissolution process, the TPP was rapidly mixed with the CS solution in a CS–TPP ratio of 3![[thin space (1/6-em)]](https://www.rsc.org/images/entities/char_2009.gif) :
:![[thin space (1/6-em)]](https://www.rsc.org/images/entities/char_2009.gif) 1. This process resulted in defined nanoparticles. Particle size and zeta-potential were analyzed.
1. This process resulted in defined nanoparticles. Particle size and zeta-potential were analyzed.
Synthesis chitosan labeled with fluorescein (CS-FITC)
Chitosan was labelled with FITC according to a modified procedure of Zhang et al.51 10 mg (0.025 mmol) FITC were dissolved in 10 mL methanol and mixed with a solution of 101.5 mg chitosan (17% DA) in 1% AcOH. The solution was stirred and the pH was set to 7 using 1 M NaOH. After stirring for 24 h (dark, room temperature) the reaction mixture was dialyzed using 0.1 M NaCl solution and deionized water. After lyophilization, the degree of FITC-modification (DMFITC) was characterized using 1H-NMR spectroscopy (ESI, Fig. S1†). CS-FITC/TPP-nanoparticles were synthesized in same way as described for CS–TPP.Synthesis chitosan labeled with rhodamine (CS-Rh)
67 mg (0.125 mmol) rhodamine isothiocyanate were dissolved in 10 mL methanol and mixed with a solution of 100 mg chitosan (17% DA) in 1% AcOH. The solution was stirred and a pH = 7 was adjusted using 1 M NaOH. After a reaction time of 24 h at room temperature (dark) the mixture was dialyzed using aqueous 0.1 M NaCl and deionized water. The degree of substitution with rhodamine (DMRhodamine) was determined using 1H-NMR spectroscopy (ESI, Fig. S2†). CS-Rh/TPP-nanoparticles were prepared as described for CS–TPP.Multilayer formation with alginate (Alg), chondrotin sulfate (Cho) or hyaluronic acid (HA)
For building up multilayers, silicon substrates (Microchemicals, Ulm, Germany) were used. Silicon wafers (1 × 2 cm2) were washed with different solvents (chloroform, acetone, ethanol and deionized water) and plasma cleaned for 10 min at 75 W (air plasma).52 CS–TPP-NP suspensions with different DA were prepared as described above. The concentration of CS–TPP-NP suspension was varied. The anionic biopolymers were dissolved in deionized water with various concentrations. A dip robot (Riegler & Kirstein, Berlin, Germany) was used for preparation of multilayer system. The following coating procedure53 for one bilayer was applied for all systems:Nanoparticle coating: The substrate was dipped into the nanoparticle suspension for 10 min, followed by a short drying step in N2-stream. After washing in 0.1% acetic acid and deionized water for 1 min each, the layer was dried in a N2-stream.
Polyanion coating: The nanoparticle coated silicon substrate was dipped into the aqueous solution of Na-Alg (M/G 1.3),54 Na-Cho or Na-HA for 10 min. After drying in N2-stream the interlayer was washed with deionized water for 1 minute and dried again.
To deposit more layers, the steps were repeated up to 5 times (five double layers).
Fluorescence labeling of CS-g-PCL nanofibers
The general preparation procedure for fiber mats modified with CS-g-PCL was published by de Cassan et al.2 For functionalization with fluorescently labeled multilayers, the nanofiber mats modified with CS-g-PCL and coated with Alg (PCL-SK24-Alg) were immersed in the nanoparticle suspension, removed and subsequently washed with deionized water. The washing was continued until no fluorescence was detected in washing medium.In vitro release of TGF-β3 from CS–TPP
TGF-β3 (PBS + 0.1% BSA, frozen at −80 °C) with a concentration of 0.5 μg mg−1 NPs was dissolved in CS solution. After soft mixing with an Eppendorf pipette TPP was added to the TGF-β3-containing solution resulting in 1 mL loaded nanoparticle solution. Particle size and zeta-potential of the nanoparticles were analysed by DLS. The release was carried out in phosphate buffered saline (PBS) with an addition of 0.1% bovine serum albumin (BSA). After nanoparticle immobilisation the NPs were centrifuged and the supernatant was removed. 1 mL fresh incubation medium was added and the release was started at 37 °C. At various time intervals, the samples were centrifuged, the supernatant was removed and 1 mL fresh PBS (0.1% BSA) was added to continue the release process. Incubation medium and all release media were analysed by TGF-β3-ELISA. For control experiments unloaded NPs were analysed and treated under similar conditions.Characterization methods
![[thin space (1/6-em)]](https://www.rsc.org/images/entities/char_2009.gif) :
:![[thin space (1/6-em)]](https://www.rsc.org/images/entities/char_2009.gif) 1 (v/v) as solvent with DSS (4,4-dimethyl-4-silapentane-1-sulfonic acid) as internal reference.
1 (v/v) as solvent with DSS (4,4-dimethyl-4-silapentane-1-sulfonic acid) as internal reference.
Each specimen was analysed at an emission angle of 0° as measured from the surface normal. Assuming typical values for the electron attenuation length of relevant photoelectrons the XPS analysis depth (from which 95% of the detected signal originates) ranges between 5 and 10 nm for a flat surface. As the actual emission angle is ill defined for rough surfaces (ranging from 0° to 90°), the sampling depth may range from 0 nm to approx. 10 nm.
Depth profiling experiments were conducted using an Ar Gas Cluster Ion Source (GCIS; Kratos Analytical Inc. Minibeam 6) operated at a cluster size of Ar1000+ with an impact energy of 10 keV, equating to a partition energy of 10 eV per atom. For the ion beam, a raster size of 2 × 2 mm2 was employed. A stable beam current was confirmed prior to performing the depth profile experiment by measuring the sample current on the earthed sample platen.
Data processing was performed using CasaXPS processing software version 2.3.15 (Casa Software Ltd, Teignmouth, UK). All elements present were identified from survey spectra. The atomic concentrations of the detected elements were calculated using integral peak intensities and the sensitivity factors supplied by the manufacturer. Binding energies were referenced to the C 1s peak at 285 eV for aliphatic hydrocarbon.
The accuracy associated with quantitative XPS is ca. 10%–15%. Precision (i.e. reproducibility) depends on the signal/noise ratio but is usually much better than 5%. The latter is relevant when comparing similar samples.
with Zi is the image height, Zavg as the average of Z images heights within the present area and N the number of points in a given area.55
Results and discussion
Nanogels prepared by ionotropic gelation of chitosan (CS) with tripolyphosphophate (TPP) were shown to form homogeneous coatings on titanium and to be suitable for controlled and sustained release of biologically active BMP-2.14 Here such nanoparticles solution were tested for the formation of multilayered coatings by the LbL-method. The CS–TPP nanoparticles were prepared by mixing a TPP solution with a chitosan solution. The nanoparticle formation process depended on pH of the chitosan solution and the ratio of tripolyphosphate to chitosan.14,49 In this study a CS–TPP ratio of 3![[thin space (1/6-em)]](https://www.rsc.org/images/entities/char_2009.gif) :
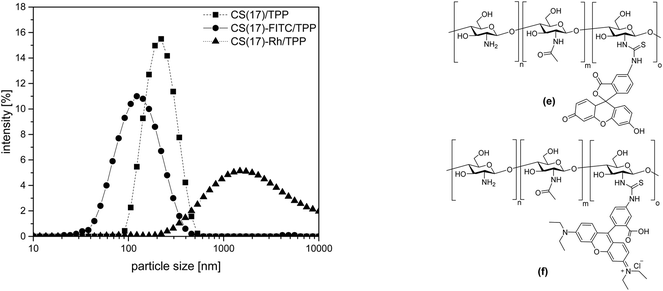
:![[thin space (1/6-em)]](https://www.rsc.org/images/entities/char_2009.gif) 1 (v/v) was used. The resulting nanoparticles had a monomodal size distribution with a z-average of 194 ± 3 nm and a positive zeta-potential of +25 ± 1 mV as shown in Fig. 2. Nanoparticles of higher acetylated CS(42) prepared by the same method, were smaller with 143 ± 2 nm. The zeta-potential of CS(42)/TPP-NPs was also somewhat lower with +22 ± 1 mV. According to Pujala et al. a zeta-potential higher than +30 mV is necessary for stable nanoparticles.56 Despite not reaching this value, the nanoparticle suspensions prepared here were stable. Stability studies did not show any significant changes in particle size over 10 d (ESI, Fig. S3†), which was in accordance with other publications made in this field.57,58 The zeta-potential is not only important for the stability of the nanoparticle suspension but also for the interaction with oppositely charged surfaces, as necessary for the layer formation in the LbL-process.
1 (v/v) was used. The resulting nanoparticles had a monomodal size distribution with a z-average of 194 ± 3 nm and a positive zeta-potential of +25 ± 1 mV as shown in Fig. 2. Nanoparticles of higher acetylated CS(42) prepared by the same method, were smaller with 143 ± 2 nm. The zeta-potential of CS(42)/TPP-NPs was also somewhat lower with +22 ± 1 mV. According to Pujala et al. a zeta-potential higher than +30 mV is necessary for stable nanoparticles.56 Despite not reaching this value, the nanoparticle suspensions prepared here were stable. Stability studies did not show any significant changes in particle size over 10 d (ESI, Fig. S3†), which was in accordance with other publications made in this field.57,58 The zeta-potential is not only important for the stability of the nanoparticle suspension but also for the interaction with oppositely charged surfaces, as necessary for the layer formation in the LbL-process.
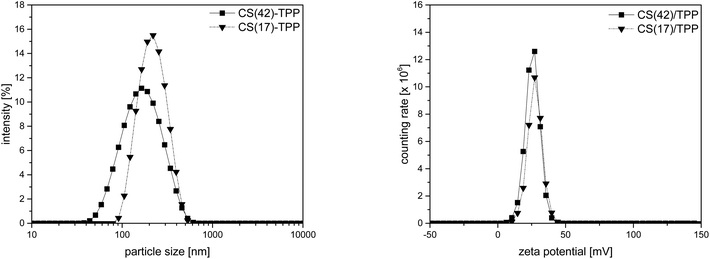 | ||
Fig. 2 Particles size distribution (left) and zeta-potential (right) of CS(17)/TPP-NP and CS(42)/TPP-NP (3![[thin space (1/6-em)]](https://www.rsc.org/images/entities/char_2009.gif) : :![[thin space (1/6-em)]](https://www.rsc.org/images/entities/char_2009.gif) 1, 1 mg mL−1 in 0.1% AcOH). 1, 1 mg mL−1 in 0.1% AcOH). | ||
Besides pristine CS, also fluorescently labelled CS was used for nanoparticle preparation.51 The degree of modification for fluorescein isothiocyanate (FTIC) (DMFITC) was calculated to be 1.5%. The suspensions of the FITC-labeled CS-TPP nanoparticles were less stable and showed some sedimentation. However, for the supernatant suspension a monomodal particle size distribution with a z-average of 120 ± 2 and a zeta-potential of 27 ± 2 mV was determined, (Fig. 3, left). In addition to the green fluorescent FITC, also rhodamine isothiocyanate (CS-Rh) was used to obtain a material with a red fluorescence. CS-Rh/TPP nanoparticles showed an even stronger tendency for sedimentation. In several cases, the sediment had to be separated by centrifugation. As shown in Fig. 3, CS-Rh/TPP nanoparticles had a broad size distribution again, indicating agglomeration of the nanoparticles. The zeta-potential was not measurable for the CS-Rh/TPP particles because of the sedimentation. CS-FITC/TPP and CS-Rh/TPP although forming less stable suspensions were still suitable for the formation of multilayered coatings by the LbL-technique on a negatively charged surfaces.
Silicon has a negatively charged surface because of its oxide layer and therefore is a well-suited substrate to deposit LbL-films starting with a polycationic component. The silicon substrates used here were characterized by AFM. Blank silicon showed a smooth surface with only few peaks all lower than 1.5 nm. Furthermore, ellipsometry was carried out to characterize the substrate, which is necessary for developing the model to evaluate the data for the final films.
For the LbL-coating nanoparticle suspensions with a concentration of 2 mg mL−1 and polyanion solutions with a concentration of 5 mg mL−1 were used in all coating experiments. These concentrations were determined in preliminary experiments and were proven to give the thickest layers (see ESI, Fig. S4 and S5†). Since the layers are intended as drug delivery system, a thicker layer is believed to transport more of the therapeutic proteins.
The CS–TPP nanoparticles deposited transformed into a homogeneous film as evidenced by SEM as shown in Fig. 4. This behavior has already been observed for nanoparticle coatings on titanium prepared by spray coating technique.14
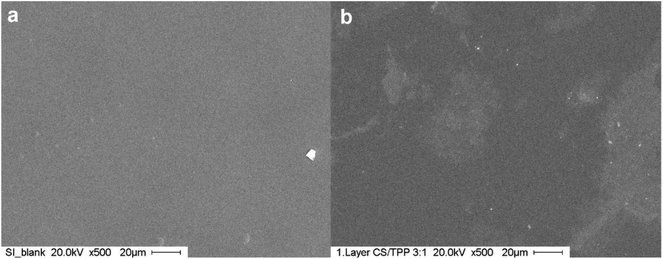 | ||
| Fig. 4 SEM images of coated silicon. (a) Blank silicon wafer, (b) silicon wafer coated with one layer of CS/TPP-nanoparticles. | ||
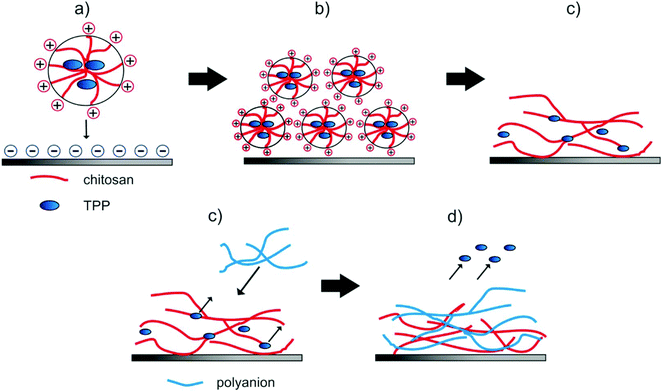
Spherical NPs from aqueous suspension attached vaporization of the water the polymeric particles moved closer, coalescence of the particles occurred and a hydrogel film was formed (see. Fig. 5a–c). Such a behavior is well known from water-based lacquers.47 Adding a second layer during the LbL-process (see. Fig. 5d and e) resulted in a diffusion of the TPP out of the film and of polyanions into the film32,33,40,46 as was proven by XPS (see below).
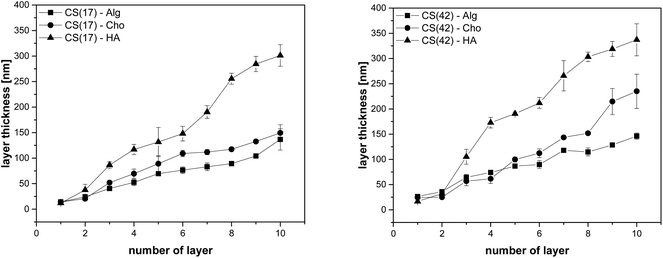
The layer thickness of the multilayer systems in the dry state was determined as a function of the number of layers (Fig. 6). The results indicated a regular increase in layer thickness with each polyelectrolyte deposition, either cationic nanoparticles or polyanions. Layer thickness increase per deposition step was determined to be 14 ± 2 nm for CS(17)/TPP and 25 ± 3 nm for CS(42)/TPP nanoparticles, respectively. This result is somewhat counterintuitive since the smaller particles found in the CS(42)/TPP system (143 ± 2 nm compared to 194 ± 3 nm for CS(17)/TPP) resulted in a thicker film when deposited. This could be explained by the higher degree of acetylation of CS(42), having therefore less free ammonium groups, hence, more polymer chains were needed to compensate the surface charge.39 After deposition of the polyanion layer, the ellipsometric film thickness increased as depicted in Table 1.
| Nanoparticle | Particle diameter | Layer thickness | Polyanion | Two layer thickness | Ten layer thickness |
|---|---|---|---|---|---|
| CS(17)/TPP | 194 ± 3 nm | 14 ± 2 nm | Alginate | 24 ± 3 nm | 137 ± 21 nm |
| Chondroitin sulfate | 21 ± 4 nm | 150 ± 16 nm | |||
| Hyaluronic acid | 38 ± 11 nm | 301 ± 21 nm | |||
| CS(42)/TPP | 143 ± 2 nm | 25 ± 3 nm | Alginate | 35 ± 5 nm | 146 ± 6 nm |
| Chondroitin sulfate | 25 ± 2 nm | 235 ± 34 nm | |||
| Hyaluronic acid | 32 ± 8 nm | 337 ± 32 nm | |||
The difference in layer thickness after coating the polyanions was similar for alginate (Alg) and hyaluronic acid (HA) taking into account the errors. The increase was somewhat lower for chondroitin sulfate (Cho), which has a strongly ionized sulfate group (see Fig. 1). This behavior is well known for the polysaccharides used as polyanions here. The strong polyelectrolyte Cho gave the lowest layer thickness increase in LbL-coatings, while Alg and HA gave a much higher layer thickness.31–33,40 After assembly of a third layer a stronger increase per dipping cycle was observed for HA than for the other polyanions (see Fig. 6). This is in accordance with investigations of Almodóvar et al. who has reported a similar behavior for CS/HA and CS/Cho.40 The final dry thickness, after ten polyelectrolyte coating cycles was also compiled in Table 1. According to Bauer and Hernandez-Montelongo et al. the thickness of LbL-films prepared from chitosan and alginate, chondroitin sulfate, or hyaluronic acid, respectively depends on the acid strength of the polyanions and their ionization state at a certain pH value.36,59 Alg with two carboxyl groups resulted in more compact layers because of doubled charge density on the polymer chain,59 compared to HA, which bears only one carboxylic acid group. Cho bearing an additional strongly acidic sulfonic acid group should gave the most compact multilayer films in the dry state. However, this was detected only for the first multilayers; following Cho-layers were less compact than Alg. It is supposed that the higher ionic strength resulted in more polymer chains to be deposited and thus a higher film thickness, although they were more stretched than for example the HA chains. In CS–TPP nanoparticles, the positive charges due to the chitosan amino groups were partially compensated by the tripolyphosphate anion. However, the nanoparticles still had a positive zeta-potential (see Fig. 2). Thus, an interaction with polyanions can be supposed. However, the question arose whether and if, to which extend the TPP anions might have been replaced by the polyanions (Alg, HA, or Cho).
XPS data can give information about the composition of the outermost layer of a surface (∼10 nm penetration depth). Phosphorus originates from the TPP anions, while nitrogen is found in CS, Cho and HA. Therefore, the elemental composition of the surface as determined by XPS can give information about the structure of the deposited films. As can be seen from Table 2, in all cases N was detected at concentrations of 4%–7%. The N-content was reduced when Alg was deposited as polyanion layer atop the CS–TPP layer. Furthermore, it remained somewhat lower, when another CS–TPP is added. This is in accordance with the mechanism of the LbL-formation process: the newly attached polymer chains interpenetrate the already deposited polymer layer to some extent.31,32,46 Since Cho and HA also contain an N-atom in their repeating unit, the N-content of the LbL-films did not change significantly.
| CS–TPP | CS–TPP/Alg | CS–TPP/Cho | CS–TPP/HA | CS–TPP/Alg/CS–TPP | CS–TPP/Cho/CS–TPP | CS–TPP/HA/CS–TPP | |
|---|---|---|---|---|---|---|---|
| O | 36.4% | 35.2% | 33.2% | 34.2% | 33.3% | 36.3% | 35.3% |
| C | 50.9% | 58.8% | 54.4% | 58.8% | 58.0% | 53.6% | 56.4% |
| N | 5.9% | 3.9% | 6.9% | 3.6% | 5.2% | 5.8% | 5.9% |
| P | 2.9% | 0.1% | 0.4% | 0.1% | 1.3% | 2.1% | 1.8% |
| Si | 3.9% | 0.9% | 4.1% | 0.2% | 1.9% | 1.8% | 0.6% |
| S | 0.1% | 0.9% | 0.1% | 0.2% | 0.3% | 0.1% | |
| Na | 1.0% | 0.2% | 2.6% | ||||
| Fe | 0.5% | ||||||
| P/N | 0.48 | 0.02 | 0.05 | 0.02 | 0.26 | 0.37 | 0.30 |
The signal for P originating from the TPP anion, was pronounced for the CS–TPP layer, however not or only barely detectable for the coatings with a polyanion as outer layer (CS–TPP/Alg, CS–TPP/Cho, CS–TPP/HA). Two possible explanations can be deduced. Firstly, the XPS is probing only the outer ∼10 nm of the sample, and since the CS–TPP layer is covered by a polyanion layer in approximately this dimension the P cannot be detected. However, this should also result in an almost complete attenuation of the N-signal in the case of the Alg coating, since this polyanion does not contain any N. However, such an attenuation of N-signal was not observed. Another hypothesis, which could explain the lack of the P-signal, is to assume that the TPP anions are replaced by the polyanions during the dipping process. Actually, such a replacement of small ions, which are released into the solution, is an entropy driven process and is regarded as the driving force for the formation and the stability of LbL-films.60 To check whether the P in the TPP is hidden from XPS measurement in the bulk of the LbL-films, depth-profiling experiments were carried out.
For these experiments, thin surface layers of the film were removed successively within a 2 × 2 mm2 area by Ar-ion cluster bombardment (etching). After each 10 or 20 s etch respectively, XPS survey spectra and high-resolution C 1s spectra were recorded. The elemental composition of the newly exposed surface was determined and plotted vs. etch time, as shown for the CS–TPP, CS–TPP + polyanion and the CS–TPP + polyanion + CS–TPP films in Fig. 7, 8 and 9.
 | ||
| Fig. 7 Elemental composition of (a) CS–TPP-, (b) CS–TPP/Alg- and (c) CS–TPP/Alg/CS–TPP-films on Si-wafer. | ||
 | ||
| Fig. 8 Elemental composition of (a) CS–TPP-, (b) CS–TPP/Cho- and (c) CS–TPP/Cho/CS–TPP-films on Si-wafer. | ||
 | ||
| Fig. 9 Elemental composition of (a) CS–TPP-, (b) CS–TPP/HA- and (c) CS–TPP/HA/CS–TPP-films on Si-wafer. | ||
The XPS data indicated that film coverage within the analysis area may not be homogenous in instances where Si was already observed before etching occurs or the Si concentration increased immediately upon etching, i.e. CS–TPP, CS–TPP/Alg, CS–TPP/Alg/CS–TPP, and CS–TPP/Cho. Such a film formation with isolated islets, which later coalesce, was described for LbL-films with chitosan as polycation before.33 In these instances, thickness measurements using ellipsometry need to be interpreted with caution since ellipsometry averages the layer thickness. As a result, a patchy film might give a similar value as a homogeneous film in layer thickness measurements. It was because of this potential problem and the resulting difficulty of preparing well-defined calibration samples that we have not attempted to determine actual etch rates. However, based on the CS–TPP/HA data (Fig. 9b) and assuming similar etch rates for all films we estimated etch rates to be of the order of 10–15 nm min−1 under the etch conditions used. The depth profile for the initial CS–TPP layer (Fig. 7a) indicated that the film was very thin and probably inhomogeneous (see comment above): all elements decreased rapidly in their concentration, while the concentration of Si (substrate signal) increased. The decrease was continuous for all elements, except for the first one or two time points where only the C levels decrease. This indicates that the etching at the beginning removes hydrocarbon contamination. This is further evidenced from the high-resolution C 1s spectra (ESI, Fig. S6†). In particular, P and N decreased simultaneously, indicating a homogenous composition in the film.
For the CS–TPP/HA layer system (Fig. 9b), after the first two time points the concentrations of C, O and N did not change significantly until the film-substrate interface has been reached after about 2.5 min of etching, indicating a homogeneous film composition. A slight increase in N towards the interface may be interpreted as higher concentration of chitosan at the substrate surface, which seems to be reasonable since chitosan was deposited first. However, no significant P-signal was found at any time point during etching. This indicates that the layer of the CS–TPP is penetrated by the polyanions and the TPP is released. Such a penetration and exchange was suggested from experiments with fluorescently labelled CS.33,61
A similar behavior was found for layer systems that employ Alg and Cho as polyanions where no significant amount of P was detected on the top surface (Table 2) or within the film (Fig. 7b and 8b). A difference in the Na-content was observed between the different polyanions (see Table 2). Only a small fraction of sodium was found for the Cho sample, which is the strongest acid among the three and behaves as a strong polyanion in the LbL-process.40 There was some sodium found for the alginate (∼1 at%) (Fig. 7b), but very significant up to 6 at% for HA which is regarded as a weak polyanion in the LbL-process (Fig. 9b).40
Adding another CS–TPP layer atop the polyanion layer to create a trilayer system led to an increase in the P-signal in all three cases compared with their bilayer counterparts. Furthermore, no sodium signal was detected. The P-content was roughly the same in the case of the Cho containing trilayer system compared with the CS–TPP only result, which is expected for a strong polyanion and results in a linear increase in layer thickness.32 The P concentration was around 4 at% for the HA trilayer system, indicating a strong penetration of the CS–TPP into the weak polyanionic layer, resulting in a complete exchange of the sodium by CS–TPP. Such a behavior is typical for weak polyanions and results typically in an exponential growth of the layers.32,46 For the Alg trilayer system however the P-content was not restored completely (less than 2 at%) throughout the film as observed in the depth profile result (Fig. 7c). This might be explained by a lower ionic strength compared to Cho and simultaneously lower penetration of the Alg. This behavior results in a lower layer thickness.
The thickness measurements and the depth profiling by XPS clearly indicated significant differences in the internal structure of the polyelectrolyte multilayers. These differences might also influence the drug release from the multilayers. It can be expected that the less compact CS–TPP/HA release a protein incorporated much faster, than a more compact CS–TPP/Alg or CS–TPP/Cho film. Therefore, the release kinetics of the multilayer film should be adjustable via the choice of the polyanion. This is a topic of ongoing research.
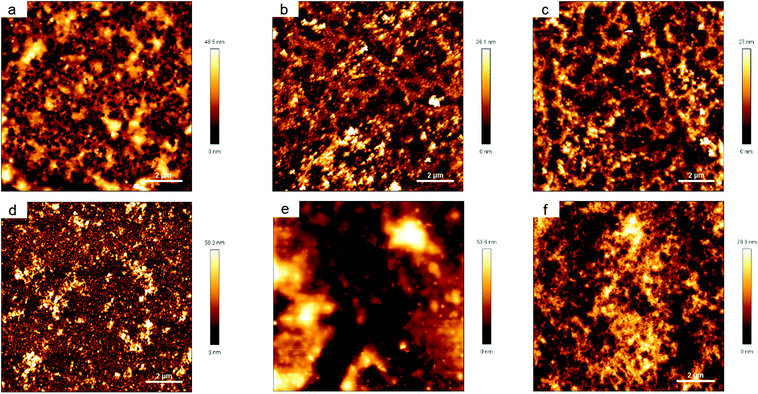
The surface topography as monitored by AFM changed distinctively by coating the silicon wafers with nanoparticle suspensions, as it can be seen in Fig. 10. After the coating (Fig. 10a and b) a significant increase in the RMS (root-mean-square) roughness was found. The RMS roughness is shown in Table 3 as mean ± standard deviation of two replicates with three independent areas.
| Silicon | CS–TPP(17) | CS–TPP(42) | CS–TPP/Alg | CS–TPP/Cho | CS–TPP/HA | CS–TPP/Alg/CS-TPP | |
|---|---|---|---|---|---|---|---|
| RMS | 0.4 ± 0.1 | 8.4 ± 0.2 | 9.1 ± 1.3 | 5.5 ± 0.7 | 9.3 ± 0.6 | 12.5 ± 2.5 | 16.5 ± 1.7 |
The subsequent deposition of the polyanion in the LbL-process (Fig. 10c–e) changed the surface topography further. There was no increase in surface roughness in case of Cho (Fig. 10d) and a significantly lower RMS roughness for Alg as top layer (Fig. 10c). It seemed as if the Alg filled the interstices resulting in a more homogenous layer. However, taking into account the XPS results, the penetration of the CS–TPP film by the Alg and a restructuring of the surface due to this penetration might be considered as mechanism. Another deposition of CS–TPP nanoparticles increased the surface roughness again to 16.5 ± 1.7 nm (Fig. 10f) over a monitored area of 100 μm2. The increase in surface roughness can be described as result of the deposition of CS–TPP nanoparticles instead of dissolved polyanions. Although the nanoparticles are no longer present as individual particles but fuse to form a film and significant penetration of the films by the chitosan chains has been detected, some structural features remain and result in some surface roughness. This interpretation is backed up but the detection of P in the third layer originating from the TPP.
The ellipsometry, XPS and AFM data clearly indicated that the CS–TPP nanoparticle suspensions obtained by ionotropic gelation, in combination with different polyanions could be used to prepare multilayers by the LbL-method on silicon wafers. The nanoparticles fused and formed homogenous films, however with a significant unevenness of the surface. For application as drug delivery system, the nanoparticles have to be deposited onto implant materials like titanium14 or e.g. electrospun fiber mats as an example as an polymeric material. Recently it was shown that PCL nanofiber mats can be modified with chitosan grafted with PCL (CS-g-PCL).2 This modification based on a surface induced crystallization of the PCL grafts on the PCL fibers (“shish kebab” structure) and resulted in presenting chitosan at the surface. After modification, the surface was positively charged and therefore was suited for attachment of nanoparticles by the LbL-technology as was proven in preliminary experiments with negatively and positively charged nanoparticles.2 We believe that to exploit the advantages of this method, a multi layered system with (different) nanoparticles in different layers on the fibers is needed. Furthermore, to be able to modify the positively charged fiber mats with a cationic nanoparticle system, the surface charge has to be inverted by adsorption of polyanions like Alg.62
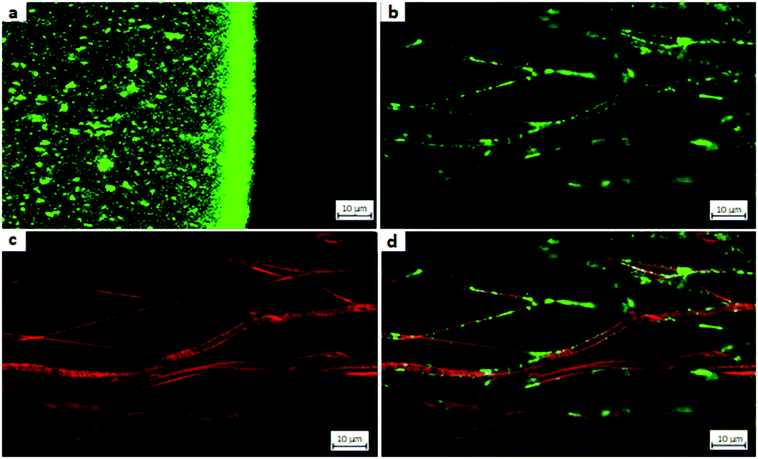
CLSM was used to prove multilayer coating on CS-g-PCL modified fiber mats with CS–TPP nanoparticle systems. Fluorescein isothiocyanate (FITC) and rhodamine isothiocyanate (Rh) were used as fluorescent dyes for labelling chitosan. The isothiocyanate derivatives of the dyes were chosen because of their advantages in the labeling process, such as mild reaction conditions and water solubility. Both dyes show high quantum efficiency. Degree of modification (DM) was calculated using 1H-NMR for CS-Rh to be approximately 5 wt% and for CS-FITC to approximately 1.5%. The somewhat higher degree of modification for the rhodamine dye is necessary because the dye is less bright than the FITC. The labeled CS-FTIC and CS-Rh were used to prepare nanoparticle suspensions by ionotropic gelation with TPP as described above and the suspensions were used to coat modified PCL fibers. The coated nanofibers were analyzed by CLSM to detect the fluorescent dye at a wavelength of λEM = 525 nm (FITC) and λEM = 625 nm (Rh). The resulting CLSM images are shown in Fig. 11. A multichannel scan has been performed to detect both dyes simultaneously.
Fig. 11a shows the CLSM image a drop of a nanoparticle suspension. The strong signal at the interface from the particle suspension drop to the surrounding air resulted from reflection. To exclude that the nanoparticles signals do not result from reflection but from the fluorophore itself a wavelength scan was performed. As already mentioned CS-FITC-TPP NPs tend to agglomerate. Furthermore, single particle analysis is not trivial because of CLSM resolution being limited by Abbe's law to around 200 nm. However, the labeled particles mean size was about 194 nm and therefore the detection of slightly larger particles and agglomerates should be possible. Because of the detection limit, the CLSM showed blurred signals as well, because the accurate position of smaller particles cannot clearly tracked. Taking into account these limitations, it was evident that CS-FITC-TPP NPs were present in their spherical shape in aqueous medium.
For creating a multilayer system of nanoparticles on the modified PCL fiber mat the attachment of different layers has to be proven. The fluorescent CS–TPP covered the nanofibers completely and reached the fibers in deeper layers as well.2 This was shown by the analysis of the individual dyes on the fibers surface (see Fig. 11b and c). “Hollow pipe” like structures were clearly identified for the coated fibers (Fig. 11b). The coating seemed slightly inhomogeneous regarding its thickness, which could be explained by the rearrangement of the nanoparticles into a film and the tendency of aggregation for the CS-FTIC-TPP particles. After successful attachment of the first layer, a second layer of particles was necessary to build up a multilayer system. To do so, an additional interlayer of alginate was added and CS-Rh-NPs were attached (Fig. 11c). It was observed that the modified fibers now show a red fluorescence signal. The second particle layer coating was homogenous along the fibers surface and did not show any inhomogeneity. Furthermore, only the fiber surface was modified and no penetration into the fiber core occurred. Using a dual wavelength scan, both the CS-FITC-TPP layer and the CS-Rh-TPP layer were observed simultaneously (Fig. 11d) and a signal overlay indicated that both modifications were present at the same spots. Both dyes coated only the fiber surface resulting in hollow pipe structures. Thus, the CLSM gave clear evidence, that multiple layers of drug delivery systems were installed on the modified fiber surface.
To demonstrate the drug release potential of the nanoparticles in the multilayer systems TGF-β3 was encapsulated into CS–TPP NPs as a model substance. The concentration of the released protein can be measured by Enzyme-linked Immunosorbent Assay (ELISA). The nanoparticles were loaded as described above and a particle concentration of 2 mg mL−1 was adjusted. The particles were incubated in modified PBS buffer (0.1% BSA added) at 37 °C to release the protein. The supernatant was changed at defined time points by centrifuging the particles down. Fresh buffer was added after centrifugation process. Incubation medium and all release media were analysed by TGF-β3-ELISA.
CS(17)–TPP and CS(42)–TPP-NPs show a strong burst release from the particles within the first 24 h as shown in Fig. 12. Actually, CS(42)–TPP particles show a higher cumulative amount of released protein. The better release is expected for the NPs prepared with higher acetyled CS(42) because of their better water solubility.14,63 So far the release system was not optimized for a sustained delivery of the protein. The sustained and controlled release of growth factors like TGF-β3 or BMP-2 stacked in a multilayer system and on the fiber mat is investigated in ongoing experiments.
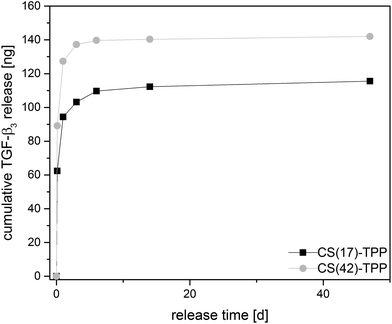 | ||
| Fig. 12 TGF-β3 release profile of chitosan–TPP NPs in PBS (0.1% BSA) over 47 days at 37 °C for chitosan with different degree of acetylation. | ||
Conclusion
Chitosan and tripolyphosphate formed well-defined hydrogel nanoparticles via ionotropic gelation, which could be used as drug delivery systems. A positive zeta-potential of the particles in combination with polyanionic biopolymers allowed deposition by the layer-by-layer technique into multi-layered coatings. During deposition and drying, the nanoparticles transformed into a homogeneous film. Alginate, chondroitin sulfate and hyaluronic acid were tested as polyanionic interlayers. The acid strength of the polyanions as well as the degree of acetylation of the chitosan influenced the resulting layer thickness of the dry films as evidenced by ellipsometry. It was identified that polyanions with higher charge density resulted in layers that are more compact. The same effect was observed when the charge density of the chitosan is changed by variation of the degree of deacetylation. The higher the degree of deacetylation, the higher the charge density and the lower the increase in layer thickness.XPS measurements proved the presence of the CS–TPP at the surface. Upon addition of polyanions the TPP anions were exchanged completely, indicating also a complete penetration of the polyanions into the previously deposited polycation layer. The XPS results also clearly indicated structural differences for the different polyanions used. The LbL-methodology with suspensions of cationic nanoparticles and polymeric counter ions was applied to surface modified poly-(ε-caprolactone) nanofiber mats.2 This method was used to deposit nanoparticles prepared with fluorescently labeled chitosan. CLSM evidenced a homogeneous multilayer coating of the fiber surface throughout the fiber mat. It was exemplified with TGF-β3, that therapeutic proteins can be incorporated and released in a controlled way from the nanogels. Thus coating of electrospun fiber mats with these drug delivery systems prepared by ionotropic gelation using the LbL-technique will allow the preparation of implants which release drugs. In particular the method should allow drug delivery in a spatially and temporally graded way and thereby should allow the control of cellular behavior in the surrounding tissue. The methodology is easy and scalable and can be used to tailor the electrospun fiber mats as implants for in situ-tissue engineering applications.
Conflicts of interest
There are no conflicts to declare.Acknowledgements
The authors thank Melanie Grams for her help with the AFM measurements. This research project has been supported by the DFG Research Unit FOR 2180 “Graded Implants”. HM thanks the Office of the Chief Executive of CSIRO for support through a Distinguished Visiting Scientist grant.References
- M. A. Woodruff and D. W. Hutmacher, Prog. Polym. Sci., 2010, 35(10), 1217 CrossRef CAS.
- D. de Cassan, S. Sydow, N. Schmidt, P. Behrens, Y. Roger, A. Hoffmann, B. Glasmacher and H. Menzel, Colloids Surf., B, 2018, 163, 309 CrossRef CAS PubMed.
- J. Massagué, L. Attisano and J. L. Wrana, Trends Cell Biol., 1994, 4(5), 172 CrossRef.
- M. Kretzschmar, F. Liu, A. Hata, J. Doody and J. Massague, Genes Dev., 1997, 11(8), 984 CrossRef CAS PubMed.
- J. M. Wozney, Spine, 2002, 27(16 Suppl 1), S2–S8 CrossRef PubMed.
- R. H. Li and J. M. Wozney, Trends Biotechnol., 2001, 19(7), 255 CrossRef CAS PubMed.
- F. A. Millan, F. Denhez, P. Kondaiah and R. J. Akhurst, Development, 1991, 111(1), 131 CAS.
- M. S. Gupta, E. S. Cooper and S. B. Nicoll, Tissue Eng., Part A, 2011, 17(23–24), 2903 CrossRef CAS PubMed.
- Z. S. Haidar, R. C. Hamdy and M. Tabrizian, Biotechnol. Lett., 2009, 31(12), 1817 CrossRef CAS PubMed.
- C. Lorenz, A. Hoffmann, G. Gross, H. Windhagen, P. Dellinger, K. Möhwald, W. Dempwolf and H. Menzel, Macromol. Biosci., 2011, 11(2), 234 CrossRef CAS PubMed.
- J. L. López-Lacomba, J. M. García-Cantalejo, J. V. Sanz Casado, A. Abarrategi, V. Correas Magaña and V. Ramos, Biomacromolecules, 2006, 7(3), 792 CrossRef PubMed.
- A. Abarrategi, J. García-Cantalejo, C. Moreno-Vicente, A. Civantos, V. Ramos, J. V. Sanz Casado, S. Pérez-Rial, R. Martńez-Corriá and J. L. López-Lacomba, Acta Biomater., 2009, 5(7), 2633 CrossRef CAS PubMed.
- A. V. Kabanov and S. V. Vinogradov, Angew. Chem., Int. Ed., 2009, 48(30), 5418 CrossRef CAS PubMed.
- N. Poth, V. Seiffart, G. Gross, H. Menzel and W. Dempwolf, Biomolecules, 2015, 5(1), 3 CrossRef CAS PubMed.
- M. Fujioka-Kobayashi, M. S. Ota, A. Shimoda, K.-i. Nakahama, K. Akiyoshi, Y. Miyamoto and S. Iseki, Biomaterials, 2012, 33(30), 7613 CrossRef CAS PubMed.
- N. Kato, U. Hasegawa, N. Morimoto, Y. Saita, K. Nakashima, Y. Ezura, H. Kurosawa, K. Akiyoshi and M. Noda, J. Cell. Biochem., 2007, 101(5), 1063 CrossRef CAS PubMed.
- M. R. Leedy, H. J. Martin, P. A. Norowski, J. A. Jennings, W. O. Haggard and J. D. Bumgardner, in Chitosan for Biomaterials II, ed. R. Jayakumar, M. Prabaharan and R. A. A. Muzzarelli, Springer Berlin Heidelberg, Berlin, Heidelberg, 2011, p 129 Search PubMed.
- T. Chandy and C. P. Sharma, Biomater., Artif. Cells, Artif. Organs, 2009, 18(1), 1 Search PubMed.
- Y. Shigemasa and S. Minami, Biotechnol. Genet. Eng. Rev., 1996, 13(1), 383 CrossRef CAS PubMed.
- T. Kean and M. Thanou, Adv. Drug Delivery Rev., 2010, 62(1), 3 CrossRef CAS PubMed.
- N. Ohara, Y. Hayashi, S. Yamada, S.-K. Kim, T. Matsunaga, K. Yanagiguchi and T. Ikeda, Biomaterials, 2004, 25(10), 1749 CrossRef CAS PubMed.
- T. Matsunaga, K. Yanagiguchi, S. Yamada, N. Ohara, T. Ikeda and Y. Hayashi, J. Biomed. Mater. Res., Part A, 2006, 76(4), 711 CrossRef PubMed.
- W. Teng, Q. Wang, Y. Chen and H. Huang, Int. J. Nanomed., 2014, 9, 5013 Search PubMed.
- T. Boudou, T. Crouzier, K. Ren, G. Blin and C. Picart, Adv. Mater., 2010, 22(4), 441 CrossRef CAS PubMed.
- L. He, A. F. Dexter and A. P. J. Middelberg, Chem. Eng. Sci., 2006, 61(3), 989 CrossRef CAS.
- B. B. Hsu, S. R. Hagerman and P. T. Hammond, J. Appl. Polym. Sci., 2016, 133(25), 8833 CrossRef.
- X. Arys, A. Laschewsky and A. M. Jonas, Macromolecules, 2001, 34(10), 3318 CrossRef CAS.
- G. Decher, J. D. Hong and J. Schmitt, Thin Solid Films, 1992, 210–211, 831 CrossRef CAS.
- B. Schoeler, G. Kumaraswamy and F. Caruso, Macromolecules, 2002, 35(3), 889 CrossRef CAS.
- R. V. Klitzing, Phys. Chem. Chem. Phys., 2006, 8(43), 5012 RSC.
- T. Crouzier, T. Boudou and C. Picart, Curr. Opin. Colloid Interface Sci., 2010, 15(6), 417 CrossRef CAS.
- P. Lavalle, C. Picart, J. Mutterer, C. Gergely, H. Reiss, J.-C. Voegel, B. Senger and P. Schaaf, J. Phys. Chem. B, 2004, 108(2), 635 CrossRef CAS.
- L. Richert, P. Lavalle, E. Payan, X. Z. Shu, G. D. Prestwich, J.-F. Stoltz, P. Schaaf, J.-C. Voegel and C. Picart, Langmuir, 2004, 20(2), 448 CrossRef CAS PubMed.
- X. Zhong, Y. Song, P. Yang, Y. Wang, S. Jiang, X. Zhang and C. Li, PLoS One, 2016, 11(1), e0146957 CrossRef PubMed.
- M. D. Yilmaz, Carbohydr. Polym., 2016, 146, 174 CrossRef CAS PubMed.
- J. Hernandez-Montelongo, E. G. Lucchesi, I. Gonzalez, W. A. A. Macedo, V. F. Nascimento, A. M. Moraes, M. M. Beppu and M. A. Cotta, Colloids Surf., B, 2016, 141, 499 CrossRef CAS PubMed.
- J. C. Antunes, C. L. Pereira, M. Molinos, F. Ferreira-da-Silva, M. Dessì, A. Gloria, L. Ambrosio, R. M. Gonçalves and M. A. Barbosa, Biomacromolecules, 2011, 12(12), 4183 CrossRef CAS PubMed.
- S. Meng, Z. Liu, L. Shen, Z. Guo, L. L. Chou, W. Zhong, Q. Du and J. Ge, Biomaterials, 2009, 30(12), 2276 CrossRef CAS PubMed.
- T. B. Taketa, D. M. Dos Santos, A. Fiamingo, J. M. Vaz, M. M. Beppu, S. P. Campana-Filho, R. E. Cohen and M. F. Rubner, Langmuir, 2018, 34(4), 1429 CrossRef CAS PubMed.
- J. Almodóvar, L. W. Place, J. Gogolski, K. Erickson and M. J. Kipper, Biomacromolecules, 2011, 12(7), 2755 CrossRef PubMed.
- G. Lawrie, I. Keen, B. Drew, A. Chandler-Temple, L. Rintoul, P. Fredericks and L. Grøndahl, Biomacromolecules, 2007, 8(8), 2533 CrossRef CAS PubMed.
- B. Larsson, M. Nilsson and H. Tjälve, Biochem. Pharmacol., 1981, 30(21), 2963 CrossRef CAS PubMed.
- K. Tømmeraas and P.-O. Wahlund, Carbohydr. Polym., 2009, 77(2), 194 CrossRef.
- A. J. de Kerchove and M. Elimelech, Macromolecules, 2006, 39(19), 6558 CrossRef CAS.
- X. Wang, E. Wenk, X. Zhang, L. Meinel, G. Vunjak-Novakovic and D. L. Kaplan, J. Controlled Release, 2009, 134(2), 81 CrossRef CAS PubMed.
- C. Picart, J. Mutterer, L. Richert, Y. Luo, G. D. Prestwich, P. Schaaf, J.-C. Voegel and P. Lavalle, Proc. Natl. Acad. Sci. U. S. A., 2002, 99(20), 12531 CrossRef CAS PubMed.
- A. F. Routh and W. B. Russel, Langmuir, 1999, 15(22), 7762 CrossRef CAS.
- J. B. Gilbert, M. F. Rubner and R. E. Cohen, Proc. Natl. Acad. Sci. U. S. A., 2013, 110(17), 6651 CrossRef CAS PubMed.
- Q. Gan, T. Wang, C. Cochrane and P. McCarron, Colloids Surf., B, 2005, 44(2–3), 65 CrossRef CAS PubMed.
- T. Freier, H. S. Koh, K. Kazazian and M. S. Shoichet, Biomaterials, 2005, 26(29), 5872 CrossRef CAS PubMed.
- Y. Ge, Y. Zhang, S. He, F. Nie, G. Teng and N. Gu, Nanoscale Res. Lett., 2009, 4(4), 287 CrossRef CAS PubMed.
- F. S. Ligler, B. M. Lingerfelt, R. P. Price and P. E. Schoen, Langmuir, 2001, 17(16), 5082 CrossRef CAS.
- J. Min, R. D. Braatz and P. T. Hammond, Biomaterials, 2014, 35(8), 2507 CrossRef CAS PubMed.
- H. Grasdalen, Carbohydr. Res., 1979, 68(1), 23 CrossRef CAS.
- K. C. Khulbe, C. Y. Feng and T. Matsuura, Synthetic Polymeric Membranes: Characterization by Atomic Force Microscopy, Springer-Verlag, Berlin, Heidelberg, 2008 Search PubMed.
- R. K. Pujala, Dispersion Stability, Microstructure and Phase Transition of Anisotropic Nanodiscs, Springer International Publishing, Cham, 2014 Search PubMed.
- K. G. H. Desai and H. J. Park, Drug Dev. Res., 2005, 64(2), 114 CrossRef CAS.
- B. Hu, C. Pan, Y. Sun, Z. Hou, H. Ye and X. Zeng, J. Agric. Food Chem., 2008, 56(16), 7451 CrossRef CAS PubMed.
- S. Bauer, Dissertation Hydratation und Antifouling-Oberflächen: Modellsysteme auf Basis zwitterionischer SAMs und polysaccharide, Dissertation, Heidelberg, 2014 Search PubMed.
- G. Decher and J. B. Schlenoff, Multilayer Thin Films, Wiley-VCH Verlag, Weinheim, FRG, 2002 Search PubMed.
- E. S. Herman and L. A. Lyon, Colloid Polym. Sci., 2015, 293(5), 1535 CrossRef CAS.
- A. Acevedo-Fani, L. Salvia-Trujillo, R. Soliva-Fortuny and O. Martín-Belloso, Food Biophys., 2017, 54, 155 Search PubMed.
- Q. Gan and T. Wang, Colloids Surf., B, 2007, 59(1), 24 CrossRef CAS PubMed.
Footnote |
| † Electronic supplementary information (ESI) available. See DOI: 10.1039/c8bm00657a |
| This journal is © The Royal Society of Chemistry 2019 |


