Tricolor mechanochromic luminescence of an organic two-component dye: visualization of a crystalline state and two amorphous states†
Suguru
Ito
 *,
Genki
Katada
,
Tomohiro
Taguchi
,
Izuru
Kawamura
 ,
Takashi
Ubukata
 and
Masatoshi
Asami
Department of Advanced Materials Chemistry, Graduate School of Engineering, Yokohama National University, 79-5 Tokiwadai, Hodogaya-ku, Yokohama 240-8501, Japan. E-mail: suguru-ito@ynu.ac.jp
First published on 19th November 2018
Abstract
Solid-state emissive dyes with mechanochromic luminescence (MCL) properties change their emission colors upon exposure to mechanical stimuli. During the recent rapid advances in the area of MCL, considerable efforts have been focused on elucidating the MCL behavior of single-component dyes that can switch their solid-state emission between two colors. Herein, a novel strategy to achieve tricolor MCL is presented, which is based on mixing two organic dyes that exhibit poor MCL or no MCL properties, respectively. We propose that the tricolor MCL of the two-component dye should be attributed to the transition of the fraction with poor MCL properties from a crystalline to two amorphous states, specifically a perfectly amorphous and a proto-crystalline amorphous state. The present system should have advantages in terms of the availability of MCL dyes and the variety of potential combinations of two-component dyes. By making a use of the underlying design principle developed in this study, a wide variety of new MCL systems should be accessible, which should also accelerate the investigation of practical applications of MCL dyes.
Introduction
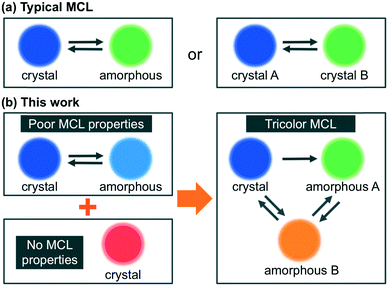
Mechanochromic luminescence (MCL) refers to a reversible shift of the solid-state emission maximum of a luminescent dye induced by the exposure to a mechanical stimulus (e.g. shearing, grinding, or pressure). Luminophores with MCL properties have attracted increasing interest owing to their potential applications in e.g. mechanosensors, security inks, and wearable technologies.1 Most notably, current research on MCL has been focused exclusively on single-component solid-state emissive dyes,2–4 and little is known about the mechanoresponsive behavior of two-component dyes.5 In all previously reported two-component MCL systems, two kinds of organic dyes with good mechanoresponsive properties have been mixed in order to achieve tricolor MCL, which is difficult to realize using single-component dyes.6 As organic dyes with good MCL properties are relatively rare, it would be desirable if poor MCL properties of organic dyes could be improved upon mixing with another organic fluorophore that exhibit no MCL properties. However, such systems have not yet been established. In addition, the biggest challenges of achieving such multicolor MCL lie in the mechanism of typical MCL dyes. The emission-color change of a single-component MCL dye between two colors typically arises from a transition of the molecular arrangement from an ordered crystalline state to a disordered amorphous state.2,4 In some cases, the crystalline state alters the degree of its crystallinity or changes to another crystalline state within a polymorphic relationship (Fig. 1a).3 Polymorphism is a well-known phenomenon for organic crystals and the MCL properties of polymorphic crystals are well documented.7 In contrast, polyamorphism of organic compounds has only recently been investigated in the field of pharmaceuticals.8 The difference of emission properties between polyamorphic states has been overlooked so far, although the emission-color change based on polyamorphism should hold the promise of realizing multicolor MCL. Herein, we report that a mixture of two organic dyes with poor MCL and no MCL properties, respectively, exhibits MCL between three colors with a large shift (Δλem ≤ 135 nm) of the emission maximum. We propose that the emission-color change between three colors should be attributed to a transition of a fraction of the MCL dye between one crystalline and two amorphous phases (Fig. 1b).Results and discussion
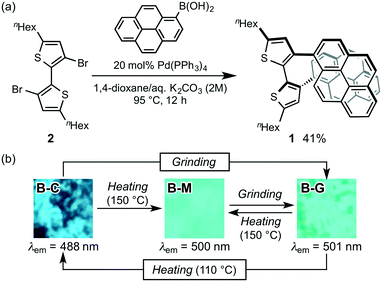
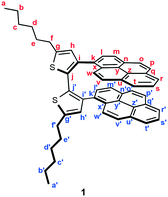
For the purpose of developing a new organic dye with MCL properties, we designed 5,5′-dihexyl-3,3′-di(pyren-1-yl)-2,2′-bithiophene (1), which is expected to form a mechanical-stimuli-responsive intramolecular stacking between the two pyrenyl rings. Dipyrenylbithiophene 1 was synthesized via a Suzuki–Miyaura coupling of pyrene-1-boronic acid with previously reported 3,3′-dibromo-5,5′-dihexyl-2,2′-bithiophene 2 (Fig. 2a).9 In the presence of 20 mol% of Pd(PPh3)4, a mixture of dibromide 2 with pyrene-1-boronic acid in 1,4-dioxane/aqueous K2CO3 (2 M) was stirred for 12 h at 95 °C to give 1 in 41% yield as a pale-yellow crystalline powder (B-C; bithiophene-crystal) after reprecipitation from ethyl acetate. Although the preparation of single crystals suitable for X-ray diffraction analysis was unsuccessful, a 1H NMR analysis of 1 in CDCl3 suggested the existence of intramolecular stacking between the two pyrenyl groups of 1.10B-C exhibited a blue fluorescence with a maximum wavelength (λem) at 488 nm. Upon grinding B-C with a spatula, the resulting B-G (bithiophene-ground) phase exhibited a bathochromically shifted solid-state emission maximum at 501 nm (Δλem = 13 nm). The original blue emission could be recovered upon heating the ground sample in a thermostatic oven to 110 °C (Fig. 2b). In addition, molten amorphous 1 (B-M; bithiophene-molten), prepared by heating B-C or B-G to 150 °C and subsequent cooling to room temperature, exhibited a blue-green emission (λem = 500 nm). This emission spectrum is almost identical to that of B-G prepared by grinding B-C or B-M (Fig. 2b and Fig. S1†). Powder X-ray diffraction (PXRD) analyses of these samples revealed that the diffraction peaks of crystalline B-C disappeared for B-M and B-G (Fig. S2†). Therefore, the MCL of 1 between B-C and B-G should be attributed to a typical crystalline-to-amorphous transition. However, the shift of the emission maxima is only 13 nm. This is probably due to the fact that the conformational change of the molecule is, contrary to our initial expectations, relatively small between the crystalline and amorphous states. We speculated that in the presence of another fluorophore an on–off switching of energy transfer from 1 to another fluorophore could be triggered by the transition of 1 from the crystalline to the amorphous states, leading to a significant shift in the solid-state emission maxima upon grinding.For that purpose, N,N′-dimethylquinacridone (DMQA, Fig. 3a) was selected as the dye to be mixed with 1, since the red dye DMQA exhibits an absorption band around 500 nm in the solid state, which is in the same region as the maximum emission wavelength of B-G (Fig. S3†). A 1![[thin space (1/6-em)]](https://www.rsc.org/images/entities/char_2009.gif) :
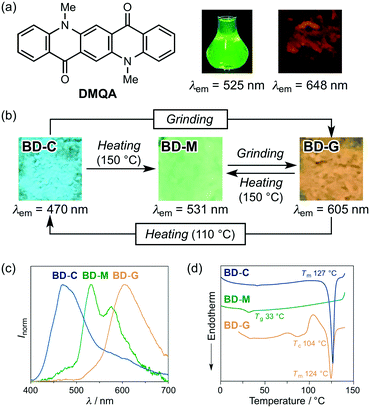
:![[thin space (1/6-em)]](https://www.rsc.org/images/entities/char_2009.gif) 1 molar mixture of 1 and DMQA on a glass plate was molten on a hot plate at 150 °C and then cooled to room temperature. The mixed dye BD-M (bithiophene/DMQA-molten) exhibited a green emission with two emission maxima at 531 nm (stronger) and 576 nm (weaker) (Fig. 3b and c), which are different from the solid-state emission maxima of 1 [λem = 488 nm (crystalline) and 500–501 nm (amorphous); Fig. 2] and DMQA (λem = 648 nm; Fig. 3a). When BD-M was scratched and ground with a spatula, a bathochromically shifted orange emission (λem = 605 nm) was observed from the resulting BD-G (bithiophene/DMQA-ground) state. Upon heating to 150 °C, BD-G was retro-converted into the green-emissive BD-M, i.e., this two-component dye exhibits MCL. The transformation between BD-M and BD-G is fully reversible and could be repeated more than five times (Fig. S4a†). Differential scanning calorimetry (DSC) measurements of BD-M and BD-G revealed a difference in thermal behavior (Fig. 3d). In the DSC thermogram of BD-M, a glass-transition temperature (Tg) was observed at 33 °C. For BD-G, on the other hand, an exothermic cold-crystallization transition temperature (Tc) was observed at 104 °C, followed by an endothermic peak that corresponds to the melting point (Tm) at 124 °C.
1 molar mixture of 1 and DMQA on a glass plate was molten on a hot plate at 150 °C and then cooled to room temperature. The mixed dye BD-M (bithiophene/DMQA-molten) exhibited a green emission with two emission maxima at 531 nm (stronger) and 576 nm (weaker) (Fig. 3b and c), which are different from the solid-state emission maxima of 1 [λem = 488 nm (crystalline) and 500–501 nm (amorphous); Fig. 2] and DMQA (λem = 648 nm; Fig. 3a). When BD-M was scratched and ground with a spatula, a bathochromically shifted orange emission (λem = 605 nm) was observed from the resulting BD-G (bithiophene/DMQA-ground) state. Upon heating to 150 °C, BD-G was retro-converted into the green-emissive BD-M, i.e., this two-component dye exhibits MCL. The transformation between BD-M and BD-G is fully reversible and could be repeated more than five times (Fig. S4a†). Differential scanning calorimetry (DSC) measurements of BD-M and BD-G revealed a difference in thermal behavior (Fig. 3d). In the DSC thermogram of BD-M, a glass-transition temperature (Tg) was observed at 33 °C. For BD-G, on the other hand, an exothermic cold-crystallization transition temperature (Tc) was observed at 104 °C, followed by an endothermic peak that corresponds to the melting point (Tm) at 124 °C.
As the DSC analysis of BD-G showed a cold-crystallization peak at 104 °C, BD-G was heated in an oven to 110 °C. Interestingly, the emission color of the sample changed to blue (λem = 470 nm) after heating. This blue-emissive BD-C (bithiophene/DMQA-crystallized) state could be transformed into the orange-emissive BD-G upon grinding. In other words, the two-component dye exhibited MCL between BD-C and BD-G together with a large shift of the maximum emission wavelength (Δλem = 135 nm) (Fig. 3b and c). This transformation is also fully reversible and could be repeated more than five times (Fig. S4b†). The DSC thermogram of BD-C showed Tm = 127 °C (Fig. 3d) and when BD-C was heated to 150 °C, the two-component dye returned to the initial BD-M state (Fig. 3b).11
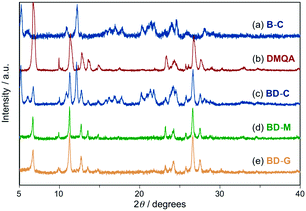
Powder X-ray diffraction (PXRD) analyses of BD-C, BD-M, and BD-G provided mechanistic insights into the tricolor MCL of the mixture of 1 and DMQA. The PXRD pattern of BD-C was in good agreement with a superposition of those of 1 (B-C) and DMQA, indicating that 1 and DMQA exist as independent crystals in BD-C (Fig. 4a–c). Therefore, the blue emission of BD-C should be attributed to the emission of 1 owing to the low fluorescence quantum yield of red-emissive DMQA (Fig. 5a; Table 1, ΦF < 0.01). A slight hypsochromic shift in the maximum emission wavelength of BD-C (λem = 470 nm) compared to B-C (λem = 488 nm) would be explained by the absorption of the emission from 1 into DMQA. On the other hand, the observed diffraction pattern for BD-M was in good agreement with that of DMQA and diffraction peaks attributable to 1 were not observed (Fig. 4d). Similarly, the PXRD analysis of BD-G revealed that amorphous 1 and crystalline DMQA exist therein (Fig. 4e). Thus, significant differences between the PXRD patterns of BD-M and BD-G were not observed although their emission colors vary substantially. The fluorescence spectrum of BD-M was similar to those of a green-emissive toluene solution of DMQA (λem = 525 nm) and DMQA-doped organic light-emitting diodes (λem = 530–540 nm),12 although the emission color of DMQA is red (λem = 648 nm) in the solid state (Fig. 3a, Fig. S5†). While the PXRD analysis suggested the existence of crystalline DMQA in BD-M, some portion of DMQA would be dissolved as monomer in the fraction of amorphous 1, and the green emission of BD-M should most likely be rationalized in terms of an emission of dissolved DMQA that results from an energy transfer from 1 to dissolved DMQA (Fig. 5b). A significantly higher fluorescence quantum yield (ΦF = 0.016) and a longer area-weighted mean fluorescence lifetime (<τF> = 10.6 ns) were observed for BD-M compared to red-emissive solid-state DMQA (ΦF < 0.01; <τF> = 3.0 ns), supporting the energy transfer from 1 to dissolved DMQA. As the BD-G state also exhibits a higher fluorescence quantum yield (ΦF = 0.027) and longer area-weighted mean fluorescence lifetime (<τF> = 10.5 ns) than red-emissive DMQA, the energy transfer from amorphous 1 to dissolved DMQA should also occur in BD-G (Table 1). It should also be noted that both a primary emission peak (λem = 531 nm) and a shoulder peak (λem = 576 nm) of BD-M should be assigned as monomer emissions of DMQA because the same emission peaks were observed from monomer DMQA in solutions (Fig. S5†). In addition, upon changing the molar ratio of 1 and DMQA from 1![[thin space (1/6-em)]](https://www.rsc.org/images/entities/char_2009.gif) :
:![[thin space (1/6-em)]](https://www.rsc.org/images/entities/char_2009.gif) 1 to 4
1 to 4![[thin space (1/6-em)]](https://www.rsc.org/images/entities/char_2009.gif) :
:![[thin space (1/6-em)]](https://www.rsc.org/images/entities/char_2009.gif) 1, a hypsochromic shift of the emission maximum and a increase of the shoulder peak around 530–540 nm were observed for BD-G (Fig. S6†). This hypsochromic shift caused by increasing the ratio of less-polar 1 should be explained by the solvatofluorochromic property of DMQA (Fig. S5†).13 Accordingly, the emission of BD-G should be assignable to the bathochromically-shifted monomer emission of DMQA (Fig. 3c and Fig. 5b and c).
1, a hypsochromic shift of the emission maximum and a increase of the shoulder peak around 530–540 nm were observed for BD-G (Fig. S6†). This hypsochromic shift caused by increasing the ratio of less-polar 1 should be explained by the solvatofluorochromic property of DMQA (Fig. S5†).13 Accordingly, the emission of BD-G should be assignable to the bathochromically-shifted monomer emission of DMQA (Fig. 3c and Fig. 5b and c).
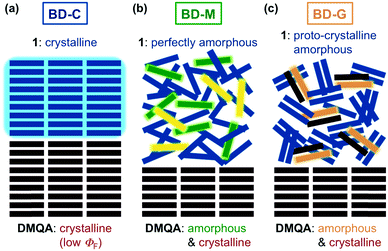 | ||
| Fig. 5 Schematic illustration for the proposed mechanism of tricolor MCL in the (a) BD-C, (b) BD-M, and (c) BD-G states. | ||
In the solid-state 13C NMR spectra of BD-C, BD-M, and BD-G, a considerable difference of the chemical shift values was observed between BD-C, which includes crystalline 1, and BD-M and BD-G, both of which include amorphous 1 (Fig. S8†). More importantly, a significant difference was observed in the alkyl region of the solid-state 13C NMR spectra of BD-M and BD-G, i.e., the signals of the hexyl groups of 1 in BD-M (δ = 31.38, 23.13, 14.66 ppm) were upfield shifted relative to those of BD-G (δ = 31.93, 23.58, 14.98 ppm). This result suggests that the hexyl groups of 1 in BD-M more efficiently surround DMQA and are thus exposed to a stronger shielding effect from DMQA than those in BD-G.
The differences observed in the DSC analyses and 13C NMR spectra suggest that the fraction of bithiophene 1 should exist in different amorphous states in BD-M and BD-G. Judging from the thermal behavior and the PXRD pattern of bithiophene 1 in the absence of DMQA (Fig. 2, Fig. S2 and S9†), the B-M and B-G states should correspond to the fraction of 1 in BD-M and BD-G states, respectively. However, virtually identical emission spectra were observed for B-M and B-G. In other words, upon addition of DMQA, the two amorphous states of 1 can be visualized by the difference in the emission color.
The two amorphous states of 1 are considered to be a perfectly amorphous and a proto-crystalline amorphous state, respectively.8,14 The perfectly amorphous state refers to a completely disordered state without short- and long-range order, whereas the proto-crystalline amorphous state refers to a partially ordered state that exhibits some short-range order, albeit in the absence of crystallinity. The concept of perfectly and proto-crystalline amorphous states provides a reasonable explanation for the difference in the thermal behavior and emission color between BD-M and BD-G. In the molten sample BD-M, 1 should exist in the perfectly amorphous state as the molecular alignment of 1 would be completely disordered upon melting (Fig. 5b). It has been reported that some molten samples of organic MCL dyes may crystallize on heating and others may not.4a A relatively high fluidity of the supercooled liquid state of 1 with two hexyl groups would prevent the formation of ordered alignments on heating, which might be one reason for the no crystallization of molten 1 (BD-M and B-M) on heating. The observed emission color of DMQA (green) in BD-M should thus be attributed to the perfectly amorphous and highly mobile 1, which should act like a hydrocarbon solvent to dissolve some portion of DMQA. The exposure of BD-M to mechanical stimuli would induce short-range alignments of 1, and the resulting BD-G should thus contain proto-crystalline amorphous 1 (Fig. 5c). Meanwhile, the highly-ordered crystalline structure of 1 in BD-C should be destroyed to afford BD-G which contains proto-crystalline amorphous 1. The proto-crystallinity of BD-G is supported by the facts that BD-G exhibits a cold-crystallization process at 104 °C and no diffraction peaks attributable to long-range order. It would be reasonable to explain that the facile crystallization of BD-G on heating is due to the presence of some short-range alignments of 1. The maximum emission wavelength of BD-G is longer than that of BD-M. This difference could be explained by the fact that the nonpolar-solvent-like effect of proto-crystalline amorphous 1 is weaker than that of perfectly amorphous 1. As there are partially ordered domains of 1 in the proto-crystalline amorphous state, DMQA should be less surrounded by 1, which is supported by the results of the solid-state 13C NMR analyses (Fig. S8†) and the emission spectra of BD-G prepared from different mixing ratios (Fig. S6†). Accordingly, the intermolecular interaction between DMQA molecules should be larger in BD-G than in BD-M, which leads to the bathochromically-shifted fluorescence owing to the solvatofluorochromic nature of DMQA (Fig. 5c and S5†).
Conclusions
In summary, a tricolor mechanochromic luminescence (MCL) that exhibits the large shift in the solid-state emission maximum has been realized by mixing dipyrenylbithiophene 1, which exhibits poor MCL properties, and DMQA, which does not exhibit MCL properties. This study thus is, to the best of our knowledge, the first example of significantly improved MCL properties of an organic dye by adding an organic dye without MCL properties. The origin of the tricolor switch should be attributed to the fraction of 1 in this two-component dye. Importantly, the difference between the two amorphous states of 1 that could not be characterized by PXRD analysis has been clearly distinguished as the difference in emission color. The basic concept of this study, i.e., the mixing of mechanochromic and non-mechanochromic fluorophores has advantages in terms of the availability of MCL dyes and the variety of potential combinations of two-component dyes and should thus generate a variety of new MCL systems with unique properties. Eventually, this should lead to the development of new fundamental insights and practical applications of MCL-active dyes. Further studies on other two-component MCL systems are currently in progress in our laboratory.Experimental
General
All air-sensitive experiments were carried out under an atmosphere of argon unless otherwise noted. IR spectra were recorded on a Nicolet iS10 FT-IR spectrometer. 1H and 13C NMR spectra were recorded on a Bruker DRX-500 spectrometer (500 MHz for 1H and 126 MHz for 13C) using tetramethylsilane (0 ppm for 1H and 77.00 ppm for 13C) as an internal standard. Solid-state 13C NMR spectra were recorded on a Bruker Avance III 600 MHz spectrometer (151 MHz for 13C) equipped with an E-free probe for 4.0 mm outer diameter rotors. The samples for solid-state 13C CP-MAS (magic angle spinning) NMR measurements were packed into a 4.0 mm o.d. zirconia NMR rotor. 13C CP-MAS NMR experiments were performed at MAS frequency 11.0 kHz and temperature 298 K. Spinal-64 proton high power decoupling15 of 78 kHz was employed during each 13C acquisition. 13C chemical shifts were externally referenced to the methyl carbon resonance of adamantane at 38.48 ppm (TMS at 0.0 ppm).16 A miniature fiber-optic spectrometer (FLAME-S-XR1-ES, Ocean Optics) and a handy UV lamp (365 nm, LUV-6, AS ONE) were used for the measurements of mechanochromic luminescence. Fluorescence and diffuse reflectance spectra were measured on a JASCO FP-8300 fluorescence spectrometer. The absolute fluorescence quantum yields were determined using a 100 mm ϕ integrating sphere JASCO ILF-835. Fluorescence lifetime measurements were recorded on a nanosecond visible/near-infrared fluorescence spectrometer (VITA). The curve-fitting analyses of fluorescence lifetime decays were carried out by using Origin 2018 (OriginLab). Powder X-ray diffraction (PXRD) measurements were performed on a Rigaku SmartLab system using CuKα radiation. DSC data were recorded on a Seiko Instruments DSC-6100 equipped with a liquid nitrogen cooling unit (heating rate: 10 °C min−1). Melting points were determined on a Stuart melting point apparatus SMP3 and uncorrected. High-resolution mass spectrum (HRMS) was recorded on a JEOL JMS-700 mass spectrometer (EI). Silica gel 60 N (spherical, neutral, 63–210 μm) was used for column chromatography. LC analyses were done on silica-gel 60 F254-precoated aluminum backed sheets (E. Merck). 3,3′-Dibromo-5,5′-dihexyl-2,2′-bithiophene (2) was synthesized according to the literature procedure.9 Other reagents were commercially available.The mixture of pyrene-1-boronic acid and 3,3′-dibromo-5,5′-dihexyl-2,2′-bithiophene (2, 3.65 mmol, 1.8 g) in 1,4-dioxane (50 mL) and 2 M aqueous K2CO3 solution (9 mL) was degassed under ultrasonic irradiation. To the mixture was added Pd(PPh3)4 (0.70 mmol, 813 mg), and the mixture was further degassed under ultrasonic irradiation. After the mixture was stirred at 95 °C for 12 h, water and dichloromethane were added to the mixture. The organic layer was separated and the aqueous layer was extracted with dichloromethane three times. The combined organic layer was washed with water and brine, and dried over anhydrous Na2SO4. After removal of the solvent under reduced pressure, crude product was purified with silica-gel column chromatography (hexane/toluene = 8![[thin space (1/6-em)]](https://www.rsc.org/images/entities/char_2009.gif) :
:![[thin space (1/6-em)]](https://www.rsc.org/images/entities/char_2009.gif) 1) followed by washing with hexane, and reprecipitated from ethyl acetate to give 5,5′-dihexyl-3,3′-di(pyren-1-yl)-2,2′-bithiophene (1) in 41% yield (1.1 g) as pale yellow powder.
1) followed by washing with hexane, and reprecipitated from ethyl acetate to give 5,5′-dihexyl-3,3′-di(pyren-1-yl)-2,2′-bithiophene (1) in 41% yield (1.1 g) as pale yellow powder.
41% yield; pale yellow solid; Mp. 125–126 °C; IR (KBr): vmax 3036, 2927, 2825, 1907, 1602, 1585, 1509, 1488, 1465, 1376, 1328, 1243, 1195, 1176, 1150, 1115, 1093, 1074, 961, 949, 930, 889, 839, 823, 792, 751, 717, 683 cm−1; 1H NMR (500 MHz, CDCl3, 283 K): δ (ppm) 8.07 (d, J = 7.6 Hz, 1H, Hr′), 7.92 (t, J = 7.6 Hz, 1H, Hs′), 7.81 (d, J = 7.6 Hz, 1H, Ht′), 7.65 (d, J = 8.3 Hz, 1H, Hm), 7.64 (d, J = 8.8 Hz, 1H, Hp′), 7.58 (d, J = 7.3 Hz, 1H, Hr), 7.54 (t, J = 7.3 Hz, 1H, Hs), 7.51 (d, J = 8.5 Hz, 1H, Ho), 7.47 (d, J = 7.3 Hz, 1H, Ht), 7.45 (d, J = 8.5 Hz, 1H, Hp), 7.44 (d, J = 8.3 Hz, 1H, Hl), 7.15 (d, J = 8.8 Hz, 1H, Ho′), 7.07 (d, J = 7.7 Hz, 1H, Hm′), 7.04 (d, J = 9.3 Hz, 1H, Hw′), 7.01 (d, J = 9.3 Hz, 1H, Hv), 7.00 (d, J = 7.7 Hz, 1H, Hl′), 6.96 (d, J = 9.3 Hz, 1H, Hw), 6.89 (d, J = 9.3 Hz, 1H, Hv′), 6.63 (s, 1H, Hh), 6.52 (s, 1H, Hh′), 2.84–2.77 (m, 4H, Hf, Hf′), 1.75–1.67 (m, 4H, He, He′), 1.42–1.36 (m, 4H, Hd, Hd′), 1.33–1.28 (m, 8H, Hb, Hb′, Hc, Hc′), 0.92–0.87 (m, 6H, Ha, Ha′); 13C NMR (126 MHz, CDCl3, 283 K): δ (ppm) 145.3 (Cg′), 145.1 (Cg), 138.9 (Ci), 137.5 (Ci′), 131.53 (Ck′), 131.52 (Ck), 130.9 (Cq′), 130.5 (Cu′), 130.2 (Cj′), 130.05 (Cj), 130.01 (Cq), 129.73 (Cn), 129.67 (Cu), 129.3 (Cn′), 129.0 (Ch′), 128.4 (Ch), 127.8 (Cx), 127.4 (Cl), 127.2 (Cx′), 126.8 (Cl′), 126.45 (Co′), 126.44 (Cp′), 126.3 (Co), 126.2 (Cp), 125.7 (Cv′), 125.6 (Cv), 125.2 (Cs′), 124.8 (Cs), 124.38 (Cw′, Ct′), 124.35 (Cm), 124.22 (Cz′), 124.17 (Cr′, Cr), 124.1 (Cy′), 123.8 (Ct), 123.6 (Cw), 123.5 (Cy), 123.4 (Cm′), 123.1 (Cz), 31.5 (Cc′, Cc), 31.4 (Ce), 31.3 (Ce′), 30.2 (Cf), 30.1 (Cf′), 28.8 (Cd), 28.7 (Cd′), 22.6 (Cb′, Cb), 14.2 (Ca′, Ca); HRMS-EI (m/z): [M]+ calcd for C52H46S2, 734.3041; found, 734.3029.
Conflicts of interest
There are no conflicts to declare.Acknowledgements
This work was partly supported by JSPS KAKENHI Grant Number 18H04508 in Grant-in-Aid for Scientific Research on Innovative Areas “Soft Crystals: Area No. 2903”, by the Tonen General Research Foundation, and by the CASIO Science Promotion Foundation. The authors are grateful to Drs. Hiroyuki Matsuzaki and Yusuke Okabayashi for the measurement of the fluorescence lifetime values (National Metrology Institute of Japan, National Institute of Advanced Industrial Science and Technology). The authors also thank Ms. Masayo Ishikawa (Suzukakedai Materials Analysis Division, Technical Department, Tokyo Institute of Technology) for EI-HRMS analyses.Notes and references
- For recent reviews, see: (a) Y. Sagara, S. Yamane, M. Mitani, C. Weder and T. Kato, Adv. Mater., 2016, 28, 1073 CrossRef CAS; (b) Z. Ma, Z. Wang, M. Teng, Z. Xu and X. Jia, ChemPhysChem, 2015, 16, 1811 CrossRef CAS ; For seminal examples on MCL dyes, see:; (c) Y. Sagara, T. Mutai, I. Yoshikawa and K. Araki, J. Am. Chem. Soc., 2007, 129, 1520 CrossRef CAS; (d) J. Kunzelman, M. Kinami, B. R. Crenshaw, J. D. Protasiewicz and C. Weder, Adv. Mater., 2008, 20, 119 CrossRef CAS; (e) H. Ito, T. Saito, N. Oshima, N. Kitamura, S. Ishizaka, Y. Hinatsu, M. Wakeshima, M. Kato, K. Tsuge and M. Sawamura, J. Am. Chem. Soc., 2008, 130, 10044 CrossRef CAS PubMed; (f) T. Abe, T. Itakura, N. Ikeda and K. Shinozaki, Dalton Trans., 2009, 711 RSC; (g) Y. Ooyama, Y. Kagawa, H. Fukuoka, G. Ito and Y. Harima, Eur. J. Org. Chem., 2009, 5321 CrossRef CAS; (h) G. Zhang, J. Lu, M. Sabat and C. L. Fraser, J. Am. Chem. Soc., 2010, 132, 2160 CrossRef CAS PubMed; (i) S. Perruchas, X. F. L. Goff, S. Maron, I. Maurin, F. Guillen, A. Garcia, T. Gacoin and J.-P. Boilot, J. Am. Chem. Soc., 2010, 132, 10967 CrossRef CAS PubMed; (j) X. Zhang, Z. Chi, H. Li, B. Xu, X. Li, W. Zhou, S. Liu, Y. Zhang and J. Xu, Chem. – Asian J., 2011, 6, 808 CrossRef CAS PubMed; (k) X. Zhang, Z. Chi, J. Zhang, H. Li, B. Xu, X. Li, S. Liu, Y. Zhang and J. Xu, J. Phys. Chem. B, 2011, 115, 7606 CrossRef CAS PubMed; (l) S.-J. Yoon and S. Y. Park, J. Mater. Chem., 2011, 21, 8338 RSC; (m) Y. Dong, B. Xu, J. Zhang, X. Tan, L. Wang, J. Chen, H. Lv, S. Wen, B. Li, L. Ye, B. Zou and W. Tian, Angew. Chem., Int. Ed., 2012, 51, 10782 CrossRef CAS; (n) K. Nagura, S. Saito, H. Yusa, H. Yamawaki, H. Fujihisa, H. Sato, Y. Shimoikeda and S. Yamaguchi, J. Am. Chem. Soc., 2013, 135, 10322 CrossRef CAS PubMed; (o) M. Krikorian, S. Liu and T. M. Swager, J. Am. Chem. Soc., 2014, 136, 2952 CrossRef CAS PubMed.
- For recent examples of single-component dyes that exhibit MCL based on crystal-to-amorphous transitions, see: (a) S. A. Sharber, K.-C. Shih, A. Mann, F. Frausto, T. E. Haas, M.-P. Nieh and S. W. Thomas, Chem. Sci., 2018, 9, 5415 RSC; (b) B. Li, K. Seth, B. Niu, L. Pan, H. Yang and H. Ge, Angew. Chem., Int. Ed., 2018, 57, 3401 CrossRef CAS; (c) D. T. Walters, R. B. Aghakhanpour, X. B. Powers, K. B. Ghiassi, M. M. Olmstead and A. L. Balch, J. Am. Chem. Soc., 2018, 140, 7533 CrossRef CAS; (d) L. Wilbraham, M. Louis, D. Alberga, A. Brosseau, R. Guillot, F. Ito, F. Labat, R. Métivier, C. Allain and I. Ciofini, Adv. Mater., 2018, 30, 1800817 CrossRef; (e) Y. Takeda, T. Kaihara, M. Okazaki, H. Higginbotham, P. Data, N. Tohnai and S. Minakata, Chem. Commun., 2018, 54, 6847 RSC; (f) T. Seki, K. Ida and H. Ito, Mater. Chem. Front., 2018, 2, 1195 RSC; (g) H. Mori, K. Nishino, K. Wada, Y. Morisaki, K. Tanaka and Y. Chujo, Mater. Chem. Front., 2018, 2, 573 RSC; (h) B. Xu, H. Wu, J. Chen, Z. Yang, Z. Yang, Y.-C. Wu, Y. Zhang, C. Jin, P.-Y. Lu, Z. Chi, S. Liu, J. Xu and M. Aldred, Chem. Sci., 2017, 8, 1909 RSC; (i) T. Seki, K. Kobayashi and H. Ito, Chem. Commun., 2017, 53, 6700 RSC; (j) Y. Jiang, G. Li, W. Che, Y. Liu, B. Xu, G. Shan, D. Zhu, Z. Su and M. R. Bryce, Chem. Commun., 2017, 53, 3022 RSC; (k) B. Y.-W. Wong, H.-L. Wong, Y.-C. Wong, V. K.-M. Au, M.-Y. Chan and V. W.-W. Yam, Chem. Sci., 2017, 8, 6936 RSC; (l) F. Wang, C. A. DeRosa, M. L. Daly, D. Song, M. Sabat and C. L. Fraser, Mater. Chem. Front., 2017, 1, 1866 RSC; (m) M. Okazaki, Y. Takeda, P. Data, P. Pander, H. Higginbotham, A. P. Monkman and S. Minakata, Chem. Sci., 2017, 8, 2677 RSC.
- For recent examples of single-component dyes that exhibit MCL between different crystalline states, see: (a) M. Jin, T. Sumitani, H. Sato, T. Seki and H. Ito, J. Am. Chem. Soc., 2018, 140, 2875 CrossRef CAS; (b) K. K. Neena, P. Sudhakar, K. Dipak and P. Thilagar, Chem. Commun., 2017, 53, 3641 RSC.
- We have previously reported several single-component organic dyes with MCL properties: (a) S. Ito, T. Taguchi, T. Yamada, T. Ubukata, Y. Yamaguchi and M. Asami, RSC Adv., 2017, 7, 16953 RSC; (b) S. Ito, T. Yamada and M. Asami, ChemPlusChem, 2016, 81, 1272 CrossRef; (c) S. Ito, T. Yamada, T. Taguchi, Y. Yamaguchi and M. Asami, Chem. – Asian J., 2016, 11, 1963 CrossRef CAS.
- (a) Z. Ma, Y. Ji, Z. Wang, G. Kuang and X. Jia, J. Mater. Chem. C, 2016, 4, 10914 RSC; (b) H.-J. Kim, D. R. Whang, J. Gierschner, C. H. Lee and S. Y. Park, Angew. Chem., Int. Ed., 2015, 54, 4330 CrossRef CAS.
- Only few single-component dyes exhibit tricolor MCL. For examples, see: (a) X. Wu, J. Guo, Y. Cao, J. Zhao, W. Jia, Y. Chen and D. Jia, Chem. Sci., 2018, 9, 5270 RSC; (b) W. Yang, C. Liu, S. Lu, J. Du, Q. Gao, R. Zhang, Y. Liu and C. Yang, J. Mater. Chem. C, 2018, 6, 290 RSC; (c) Z. Ma, Z. Wang, X. Meng, Z. Ma, Z. Xu, Y. Ma and X. Jia, Angew. Chem., Int. Ed., 2016, 55, 519 CrossRef CAS; (d) Y. Sagara and T. Kato, Angew. Chem., Int. Ed., 2011, 50, 9128 CrossRef CAS , See also ref. 2m and 4b.
- For a review, see: (a) R. Tan, S. Wang, H. Lan and S. Xiao, Curr. Org. Chem., 2017, 21, 236 CrossRef CAS; For recent examples, see: (b) C. Ge, J. Liu, X. Ye, Q. Han, L. Zhang, S. Cui, Q. Guo, G. Liu, Y. Liu and X. Tao, J. Phys. Chem. C, 2018, 122, 15744 CrossRef CAS; (c) P. S. Hariharan, G. Parthasarathy, A. Kundu, S. Karthikeyan, Y. Sagara, D. Moon and S. P. Anthony, Cryst. Growth Des., 2018, 18, 3971 CrossRef CAS; (d) C. Arivazhagan, P. Malakar, R. Jagan, E. Prasad and S. Ghosh, CrystEngComm, 2018, 20, 3162 RSC; (e) H. Zhu, S. Weng, H. Zhang, H. Yu, L. Kong, Y. Zhong, Y. Tian and J. Yang, CrystEngComm, 2018, 20, 2772 RSC.
- (a) G. Zografi and A. Newman, J. Pharm. Sci., 2017, 106, 5 CrossRef CAS PubMed; (b) Y. N. Thi, K. Rademann and F. Emmerling, CrystEngComm, 2015, 17, 9029 RSC.
- X. Guo, S. Wang, V. Enkelmann, M. Baumgarten and K. Müllen, Org. Lett., 2011, 13, 6062 CrossRef CAS.
- Dipyrenylbithiophene 1 should form intramolecular stacks of pyrene groups as shown in Fig. 2a, since the 1H NMR signals of the two non-equivalent pyrenyl groups in 1 are upfield shifted relative to those of pyrenyl groups of reported pyrenylthiophene derivatives. For 1H NMR spectra of pyrenylthiophene derivatives, see: (a) M. Ashizawa, K. Yamada, A. Fukaya, R. Kato, K. Hara and J. Takeya, Chem. Mater., 2008, 20, 4883 CrossRef CAS; (b) Y. Aso, T. Okai, Y. Kawaguchi and T. Otsubo, Chem. Lett., 2001, 30, 420 CrossRef.
- As the melting point of DMQA (286 °C, decomp.) is above 150 °C, only the fraction of bithiophene 1 should be liquefied upon heating to 150 °C.
- (a) H. Liu, F. Yan, W. Li, B. Chu, W. Su, Z. Su, J. Wang, Z. Hu and Z. Zhang, Appl. Phys. Lett., 2010, 96, 083301 CrossRef; (b) Z. Su, W. Li, B. Chu and S. Wu, Thin Solid Films, 2011, 519, 2540 CrossRef CAS.
- Another possible explanation for the bathochromically-shifted emission of BD-G is the partial quenching of the emission by the absorption of DMQA. However, this explanation would be less probable because there is only a slight difference between the solid-state absorption spectra of BD-M and BD-G (Fig. S7†).
- D. Q. M. Craig, V. L. Kett, J. R. Murphy and D. M. Price, Pharm. Res., 2001, 18, 1081 CrossRef CAS.
- B. M. Fung, A. K. Khitrin and K. Emolaev, J. Magn. Reson., 2000, 142, 97 CrossRef CAS.
- R. K. Harris, E. D. Becker, S. M. Cabral de Menezes, P. Granger, R. E. Hoffman and K. W. Zilm, Pure Appl. Chem., 2008, 80, 59 CAS.
Footnote |
| † Electronic supplementary information (ESI) available: Experimental details, spectral data, DSC thermograms, and fluorescence lifetime decays. See DOI: 10.1039/c8ce01698d |
| This journal is © The Royal Society of Chemistry 2019 |

