 Open Access Article
NiCo2O4 nanoarray on CNT sponge: a bifunctional oxygen electrode material for rechargeable Zn–air batteries†
Pranav K.
Gangadharan
ab,
Siddheshwar N.
Bhange
ab,
Nasrin
Kabeer
a,
Rajith
Illathvalappil
ab and
Sreekumar
Kurungot
 *ab
*ab
aPhysical and Materials Chemistry Division, CSIR-National Chemical Laboratory, Pune, Maharashtra, India 411008. E-mail: k.sreekumar@ncl.res.in
bAcademy of Scientific and Innovative Research (AcSIR), Ghaziabad 201002, India
First published on 8th July 2019
Abstract
Ni- and Co-based materials have of late gained prominence over conventional noble metal-based ones as catalysts for energy devices. Here, a high performance catalyst which can facilitate both the oxygen evolution reaction (OER) and oxygen reduction reaction (ORR) was developed by anchoring a NiCo2O4 nanowire array on a carbon nanotube sponge (NCS). The three-dimensional morphology of NCS ensured efficient transport of the reactants and products on the catalyst surface, thereby improving the activity of the material. The prepared catalyst showed remarkable OER activity, requiring an overpotential of 280 mV, which is comparable to that of noble-metal catalysts. In addition to the noteworthy OER performance, the catalyst performed well with respect to the ORR. The total oxygen electrode activity overpotential of the catalyst was found to be 0.83 V, which is lower than that of commercial electrodes such as Pt/C and RuO2. A rechargeable Zn–air battery constructed with NCS had an open circuit voltage of 1.42 V, a maximum power density of 160 mW cm−2, and an energy density of 706 W h kg−1. NCS exhibited bifunctional electrocatalytic activity and high stability for both the OER and ORR, proving to be a good replacement for noble metal electrodes in rechargeable metal–air batteries.
Introduction
The adverse effects of the continued use of fossil fuels urge the scientific world towards the practice of green and renewable energy technologies. The suitable application of metal–air batteries,1,2 fuel cells,3 and water electrolysers4–6 will have the potential to substitute conventional energy systems. All these energy systems involve two primary reactions, namely, the formation and dissociation of water.7,8 Among the different energy systems, Zn–air batteries are set apart by their high energy density.9,10 The battery uses Zn, which is an environmentally benign, earth-abundant metal, and the system has higher theoretical energy density than Li-ion batteries.11–13 However, the high overpotential due to the sluggish kinetics of the multistep ORR/OER precludes the effective commercialization of rechargeable Zn–air batteries.14,15 Noble metals such as Pt and RuO2 are the foremost contenders when considering catalyst systems for rechargeable Zn–air batteries.16 Despite precious metal catalysts being more active for the ORR/OER, their commercial use is limited by their high cost, scarcity, and poor durability.17,18 Moreover, these catalysts cannot perform satisfactorily in both the ORR and OER simultaneously. Substantial and inexpensive generation of energy requires the replacement of conventional noble metal catalysts with alternatives that can overcome these disadvantages.Recently, more efforts have been dedicated to developing alternatives for noble metal-based catalysts in oxygen reactions. Non-precious metal oxides, perovskites, and metal–organic frameworks have been reported as bifunctional catalysts for the ORR/OER.19–27 Among the various non-precious metal catalysts, Co3O4 spinel, which shows high activity in alkaline media for both the ORR and OER, has been well studied. Especially, the incorporation of Ni in the Co3O4 spinel matrix further improves the electrical conductivity with the generation of more active sites.28 Among the various non-noble metal-based catalysts, Ni- and Co-based mixed oxides with the spinel structure have shown significant activity for both the OER and ORR.29,30 The advantages of a mixed-valence metal oxide over a single metal oxide for electrocatalysis are well studied in NiCo2O4. The cost of this type of transition metal compound is significantly lower than that of noble metals for large-scale energy storage. Nanostructuring in NiCo2O4 is a crucial step in the field of metal oxide research. Despite its impressive electrocatalytic performance, NiCo2O4 required extensive tuning of its morphology to expose more sites for electrocatalysis.31,32 The anchoring of NiCo2O4 on a carbon support with an appropriate three-dimensional alignment can overcome the pertinent issues related to the activity and stability of NiCo2O4 towards the OER and ORR.
Herein, we achieved the anchoring of NiCo2O4 on a carbon nanotube sponge-based three-dimensional architecture, for increasing the availability of catalytic sites in NiCo2O4 and improving the mass transport. The synthesis of the NiCo2O4-CNT sponge (NCS) catalyst is a two-step process, involving the conversion of melamine sponge (MS) to carbon nanotube coated sponge (CS) in the first step, followed by the anchoring of NiCo2O4 on it by a solvothermal treatment in the second step. Such a three-dimensional structure possesses easily accessible active sites and high conductivity and it allows fast reactant/product transport. Along with high OER performance, NCS shows reasonable ORR activity in basic media. A realistic validation of the bifunctional aspect of the catalyst could be done by demonstrating a rechargeable Zn–air battery system composed of the electrode derived from the present catalyst. In terms of both activity and stability, the present system is found to outperform its counterparts based on the state-of-the-art precious metal catalysts.
Experimental
Synthesis of CS
Five hundred milligrams of sodium dodecyl benzene sulphonate were dispersed in 50 ml DI water using bath sonication for 30 min. 75 mg of CNTs was added to this solution followed by bath sonication for 30 min and probe sonication for 10 min. The melamine sponge (MS) was soaked in the CNT solution and kept for one hour for complete absorption after which it was dried under an IR lamp; the process was repeated until the CNT solution was completely absorbed. The thus-formed material is designated CS.Synthesis of NCS
Eighty millilitres each of ethanol and DI water were mixed well in a beaker. Urea (2.8 g), along with 2.32 g Co(NO3)2·6H2O and 1.16 g Ni(NO3)2·6H2O was added to the water–ethanol mixture and stirred well for about 1 h. The solution mixture was transferred to a Teflon-lined autoclave. CS was added to the autoclave and heated at 100 °C for 8 h. After the reaction, it was removed from the autoclave, washed with ethanol and heated in a tubular furnace at about 350 °C for 2 h to form the final NCS catalyst.Material characterization
SEM analysis was carried out using a Zeiss DSM 950 instrument. Transmission electron microscopy (TEM) images were obtained using an FEI Technai G2T20 instrument at an operation voltage of 200 kV. A PANalytical instrument was operated using Cu Kα radiation (λ = 1.54 Å) at a scanning rate of 2° min−1 and a step size of 0.02° in 2θ to acquire the X-ray diffraction spectra. XPS studies were carried out on a VG Micro Tech ESCA 3000 with a Mg Kα X-ray source. TGA was carried out on an SDTQ600 TG-DTA analyser in an oxygen environment with a 10 °C min−1 temperature ramp. A Quantachrome Quadrasorb automatic volumetric measurement instrument operated at 77 K using ultra-pure nitrogen gas was used for the BET surface area and pore size distribution analysis.Electrochemical characterization
All the electrochemical studies were conducted on a Biologic electrochemical workstation (VMP3) by using a conventional three-electrode setup. A GC rotating disc electrode coated with the catalyst (Pine Instruments Inc.) was used as the working electrode. A graphite rod as the counter electrode and Hg/HgO as the reference electrode with 1 M KOH electrolyte were used for electrochemical studies. The obtained current was converted into current density via dividing it by the geometrical surface area of the working electrode. Also, the applied potentials were normalized with respect to RHE.The catalyst ink was prepared by dispersing 10 mg of the catalyst in 2 ml of a 2![[thin space (1/6-em)]](https://www.rsc.org/images/entities/char_2009.gif) :
:![[thin space (1/6-em)]](https://www.rsc.org/images/entities/char_2009.gif) 3 mixture of isopropyl alcohol and water with the help of sonication. 10 μl of the catalyst slurry was dropcast on the GC electrode surface and dried under an IR lamp. Subsequently, 1 μl of 0.01 wt% fumion solution in ethanol was applied to the catalyst, which acts as a binder as well as an ionomer. Standard commercial catalysts (Pt/C and RuO2/C) for activity comparison were prepared by following the same protocol.
3 mixture of isopropyl alcohol and water with the help of sonication. 10 μl of the catalyst slurry was dropcast on the GC electrode surface and dried under an IR lamp. Subsequently, 1 μl of 0.01 wt% fumion solution in ethanol was applied to the catalyst, which acts as a binder as well as an ionomer. Standard commercial catalysts (Pt/C and RuO2/C) for activity comparison were prepared by following the same protocol.
Zn–air battery testing
For rechargeable Zn–air battery cells, a two-electrode configuration was used by pairing NCS loaded on a carbon paper electrode (cathode) having an active area of 1 cm2 with a Zn foil of the same area (Alfa Aesar) in 20 ml of 6 M KOH. The cathode (air electrode) was fabricated with a catalyst loading of 1 mg cm−2 over the GDL. Oxygen was continuously purged to the cell while testing the battery.Results and discussion
NCS was prepared by a simple two-step process. The synthesis procedure for NCS is illustrated in Scheme 1. Briefly, in the first step, commercially available inert MS was coated with a layer of CNTs (CS) by dipping MS in a CNT slurry that contained sodium dodecyl benzene sulphonate as a binder. The modification of MS as CS helps to induce electrical conductivity in the polymer template material. Usually, a high-temperature annealing process is required to generate conductivity in melamine foam by converting it into carbon nitride (CNx).33 On the other hand, the MS to CS modification by the dip coating method mentioned above helps to achieve conductivity at room temperature without the need for extra energy and without imparting morphological alterations to the sponge structure. In the next step, NiCo2O4 nanowire was grown on CS by hydrothermal treatment with Ni and Co precursors in a 1![[thin space (1/6-em)]](https://www.rsc.org/images/entities/char_2009.gif) :
:![[thin space (1/6-em)]](https://www.rsc.org/images/entities/char_2009.gif) 2 ethanol–water mixture in the presence of thiourea. After hydrothermal treatment, the sponge was heated at 350 °C in the presence of air for complete conversion of the precursor into metal oxide.
2 ethanol–water mixture in the presence of thiourea. After hydrothermal treatment, the sponge was heated at 350 °C in the presence of air for complete conversion of the precursor into metal oxide.
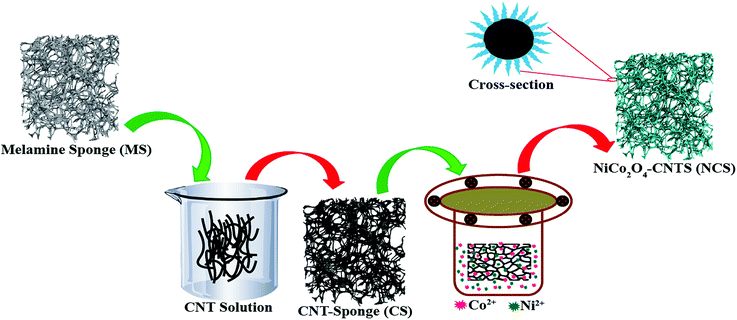 | ||
| Scheme 1 Schematic illustration of the NCS synthesis which depicts the stepwise transformation occurring in the melamine sponge precursor leading to the synthesis of NCS. | ||
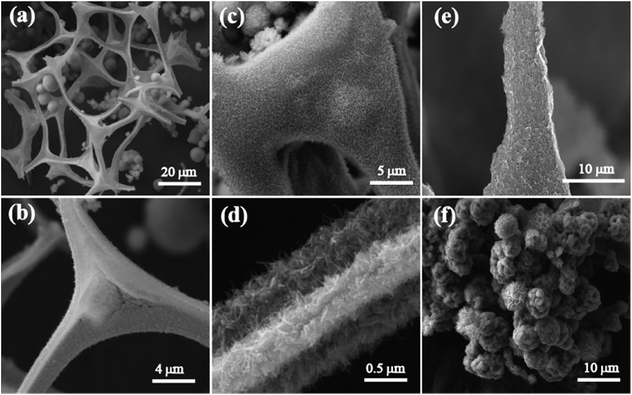
Fig. 1a–d show the field emission scanning electron microscopy (FESEM) images of NCS at different magnifications. The low magnification image in Fig. 1a shows the three-dimensional interconnected morphology of the as-prepared NCS. In the NCS structure, melamine foam acts as a backbone, which helps in the formation of the three-dimensional morphology. Fig. 1c and d depict the NiCo2O4 nanowire array over the CS surface. The as-formed NCS has an attractive morphology for electrocatalysis with its three-dimensional interconnected tetrapod structure, which will enhance the active passage of the reactant and products through the catalyst surface. The size of these interconnected tetrapod structures is in micrometres, with a typical length of ∼20 μm and width of 1–10 μm. For comparison, images of CS are also given in Fig. 1e. From Fig. 1e, we can observe that the CNT completely covers the arms of the melamine sponge. More high-resolution FESEM images of CS are given in Fig. S1.† The annealing of melamine foam in an inert atmosphere forms the CNx tetrapod structure that has low electronic conductivity. To elucidate the role of CS in the anchoring of NiCo2O4 over its surface, the above reaction was carried out with CNx instead of CS. However, under the same reaction conditions, NiCo2O4 formed a flower-like morphology (NMS) which was separated from the backbone structure implying that there was no interaction with CS and NiCo2O4. Instead of forming a nanoarray, the NiCo2O4 growth had a distinct flower-like morphology. In Fig. 1c, it is visible that NiCo2O4 grown on the CS surface has complete coverage of the structure. The conducting CNT-wrapped sponge surface helped the formation and growth of the NiCo2O4. Fig. 1d shows the magnified images of NiCo2O4-CNTs, which are very helpful for a detailed understanding of the morphology. The NiCo2O4 nanowires grow vertically on the CNT surface.
Fig. 2a shows the scanning electron microscopy (SEM) image of the section selected for NCS to perform the elemental mapping of the different elements present on its surface and the corresponding images are shown from Fig. 2b–d. From the SEM images, it is evident that Ni, Co and O are distributed uniformly on the NCS surface. The energy dispersive X-ray (EDAX) analysis of NCS ascertains the proportions of the different elements as given in Fig. S2.† The EDAX data show that the total weight percentages of Ni and Co are around 20%, while the total atomic percentage is around 5%. The weight percentage and atomic percentage of the sample confirms the 1![[thin space (1/6-em)]](https://www.rsc.org/images/entities/char_2009.gif) :
:![[thin space (1/6-em)]](https://www.rsc.org/images/entities/char_2009.gif) 2 stoichiometric ratio of Ni and Co. Fig. 2e and f show the transmission electron microscopy (TEM) images of NCS recorded at different magnifications. The TEM images help to reveal the interconnected NiCo2O4 nanowire array over the CS surface. It can be observed from the TEM images that the NiCo2O4 and CNTs have different aspect ratios and are evidently separated from each other. Both the NiCo2O4 nanoarray and CNTs have the same width around 15–20 nm, however the length of the nanoarray is restricted to below 100 nm, which is much lower than that of the CNTs. This significant difference in the aspect ratio clearly separates them in the TEM analysis. Also, in Fig. 2f, it is observable that CNTs are lying behind the NiCo2O4 nanoarray.
2 stoichiometric ratio of Ni and Co. Fig. 2e and f show the transmission electron microscopy (TEM) images of NCS recorded at different magnifications. The TEM images help to reveal the interconnected NiCo2O4 nanowire array over the CS surface. It can be observed from the TEM images that the NiCo2O4 and CNTs have different aspect ratios and are evidently separated from each other. Both the NiCo2O4 nanoarray and CNTs have the same width around 15–20 nm, however the length of the nanoarray is restricted to below 100 nm, which is much lower than that of the CNTs. This significant difference in the aspect ratio clearly separates them in the TEM analysis. Also, in Fig. 2f, it is observable that CNTs are lying behind the NiCo2O4 nanoarray.
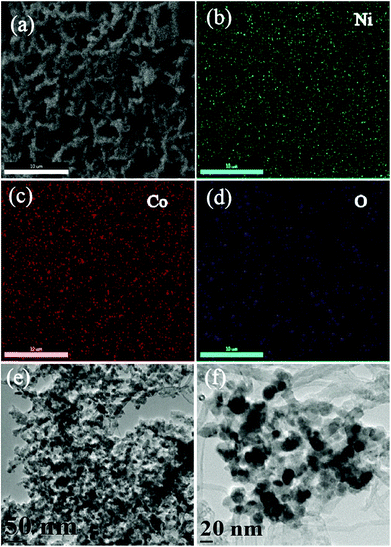 | ||
| Fig. 2 (a) SEM image of NCS; (b–d) corresponding Ni, Co, and O elemental mappings showing the uniform distribution of the elements; (e and f) TEM images of NCS at different magnifications. | ||
The X-ray diffraction (XRD) patterns of NCS and CS are shown in Fig. 3a. The crystal structure of NiCo2O4 in NCS has been investigated by powder XRD, and the characteristic spectrum is well indexed to the NiCo2O4 spinal structure (JCPDS card no. 20-0781). The broad peak observed at a 2θ value of 26° (200 plane) in the NCS spectrum arose from the CNTs, while all the other high intensity peaks were related to the NiCo2O4 crystal structure. Compared to the C peak, NiCo2O4 peaks are sharper and more intense. NiCo2O4 shows characteristic peaks at 2θ values of 18.9°, 31.15°, 36.7°, 44.62°, 59.1°, and 64.98°, which correspond to the (111), (220), (311), (400), (511), and (440) planes respectively. No other impure peaks such as those for NiO or Ni(OH)2 could be observed, indicating the complete formation of NiCo2O4. The NiCo2O4 in NCS has an inverse spinel crystal structure in which Co3+ occupies the tetrahedral sites, while Co3+ and Ni2+ occupy the octahedral sites. Since NiCo2O4 contains the same cation with different valencies, it displays higher electrical conductivity than the monometallic oxides of Ni and Co.34,35
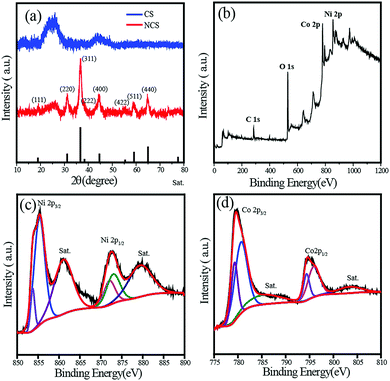 | ||
| Fig. 3 (a) XRD spectra of NCS and CS; (b) XPS survey spectrum representing the elements in NCS; (c) and (d) deconvoluted Ni2p and Co2p XPS spectra of NCS. | ||
The surface composition and elemental analysis of NCS is further investigated using X-ray photoelectron spectroscopy (XPS). The full-scan survey spectrum in Fig. 3b demonstrates the presence of Ni, Co, O, and C in NCS. The high-resolution Ni2p spectrum is shown in Fig. 3c, which consists of two spin–orbit doublets characteristic of Ni2+ and Ni3+ along with two shakeup satellite peaks. The peaks at 853.7 and 872.1 eV are indexed to Ni2+, while those at 855.4 and 873.1 eV can be assigned to Ni3+. Two shakeup satellite peaks appear at the positions 860.9 and 879.5 eV, respectively. Similarly, the Co2p XPS spectrum was also deconvoluted to two spin–orbit doublets with shakeup satellite peaks. The binding energies at 780.7 and 795.9 eV are ascribed to Co2+, and the binding energies at 779.3 and 794.4 eV are attributed to Co3+. To gain insight into the role of CS in the NiCo2O4-nanowire growth, XPS analysis of NMS was performed (Fig. S3†). The Ni2p and Co2p XPS spectra of NCS exhibit a negative shift in binding energy compared to NMS. The interaction between the C layer and metal oxide is responsible for this shift in the binding energy. This lightens the role of the CNT sponge platform in the growth of the NiCo2O4 nanowire. Furthermore, the metal oxide–C interaction is confirmed by the O1s spectra comparison of both NCS and NMS (Fig. S4†). The deconvoluted O1s spectrum of NMS contained a 26% M–O–M peak at 529.4 eV, while it increases to 45% in the case of NCS. The higher percentage in NCS justifies the assumption of metal oxide interaction with the CNT layer.
The thermogravimetric analysis (TGA) of NCS was carried out in an oxygen atmosphere. Fig. S5† shows the typical TGA curve of the metal oxide-supported carbon morphology. In the TGA profile, the initial losses up to a temperature of 400 °C was due to the removal of adsorbed moisture from the catalyst surface. After this initial region of the temperature profile, a sudden weight loss is observed in the temperature range of 400–550 °C owing to the burning (oxidation) of the carbonaceous components of the catalyst. Above 850 °C, the metal oxide residue alone remains and the total NiCo2O4 content in the NCS as obtained from TGA is 40%. The Brunauer–Emmett–Teller (BET) surface area and pore volume of NCS were also calculated from nitrogen adsorption–desorption studies (Fig. S6†). The BET surface area is found to be 86 m2 g−1. The adsorption isotherm shows type IV features in the relative pressure range from 0.4 to 0.9. Along with the larger surface area, NCS is mesoporous with pore sizes ranging from 3 to 20 nm. The interconnected architecture with the mesoporous metal oxide anchored on a surface that has a large area enhances the reactant–product transport and thus improves the electrocatalytic activity.
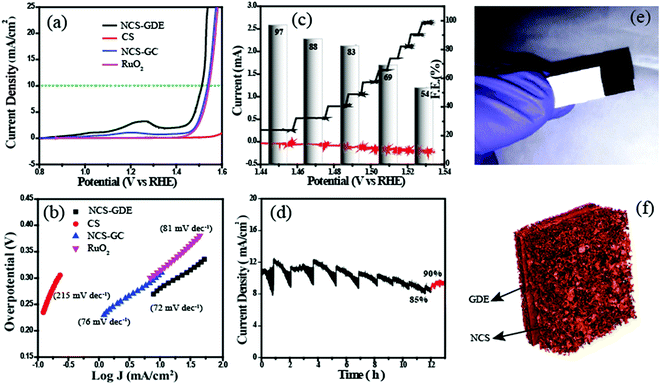
The electrocatalytic activity of NCS was analysed using cyclic voltammetry (CV) in a conventional three-electrode electrochemical cell in 1 M KOH with Hg/HgO as the reference electrode and a graphite rod as the counter electrode. All the experimental results pertaining to the OER on the catalysts are reported as current density vs. iR-corrected applied potential (V vs. RHE). Fig. S7† shows the CV plots of NCS in 1 M KOH solution. It has three potential regions: the non-faradaic double layer region, Ni redox couple region, and oxygen evolution region. Furthermore, for a detailed study of the OER, we performed linear sweep voltammetry (LSV). In Fig. 4a, the NCS-coated glassy carbon (NCS-GC) electrode has an onset potential of 1.48 V, and it reaches the benchmark current density of 10 mA cm−2 at the potential of 1.53 V. While evaluating the overpotential, it was found that NCS has a 300 mV overpotential, which is lower than that of the commercial electrode catalysts based on IrO2 and RuO2. For exploring the advantages of the three-dimensional interconnected electrode and for mimicking a real cell electrode, the same experiments were repeated by replacing the NCS-GC electrode with an NCS pasted gas diffusion electrode (NCS-GDE). The three-dimensional morphology of NCS is better retained on the NCS-GDE electrode than on the NCS-GC electrode, and this augments the reactant and product gas distribution through the catalyst surface. The advantage of this morphology is well reflected in the oxygen evolution performance of the material as well. The overpotential for NCS-GC is reduced from 300 to 280 mV by using a NCS-GDE. For a comparative evaluation of the performance of the NCS-coated electrode for the OER, state-of-the-art RuO2 and CS electrodes were also studied under the same reaction conditions. It was observed that CS does not exhibit any visible activity for the OER; however, RuO2 required an overpotential of 310 mV to attain the current density of 10 mA cm−2.
The Tafel plots given in Fig. 4b exhibit a lower Tafel slope of 72 mV dec−1 for NCS-GDE compared to that of NCS-GC (76 mV dec−1) and CS (215 mV dec−1), suggesting the more favourable kinetics of the NCS material towards the OER. This Tafel slope value is lower than that of the reference RuO2 (81 mV dec−1) catalyst. In addition, the electrochemical active surface areas of all the catalysts were calculated by the double-layer method (Fig. S8†). CV was performed in the double-layer region with different scan rates ranging from 20 to 200 mV s−1, revealing a linear trend in the increment of anodic and cathodic current with the scan rate. Furthermore, the anodic and cathodic currents at a potential of 0.06 V are plotted against the scan rate; the slope of the straight line is indicative of the double layer capacitance. The obtained electro-active area is higher than that of some recently reported OER catalysts. The slopes of NCS-GDE, NCS-GC, RuO2 and CS electrodes were found to be 31.1 × 10⁻⁴ μF cm−2, 5.36 × 10⁻⁴ μF cm−2, 3.84 × 10⁻⁴ μF cm−2, and 3.03 × 10⁻⁴ μF cm−2 respectively. The considerable difference in the electroactive surface area of the NCS-GDE electrode compared to the other catalysts indicates the importance of the three-dimensional interconnected surfaces for electrocatalysis. This higher electroactive surface area provides a higher density of active sites.
The faradaic efficiency (ε) of the NCS catalyst is determined by using the rotating ring-disk electrode (RRDE) technique in 1 M KOH in an N2-saturated atmosphere. During the RRDE measurement, oxygen evolved at the disk electrode, and was collected and reduced at the Pt-ring electrode with the corresponding current response. The faradaic efficiency (ε) was calculated from RRDE data using eqn (S1).†Fig. 4c shows the plots of the faradaic efficiency obtained against the applied disk current, with the corresponding disk and ring currents and detected potential. Approximately 97% faradaic efficiency was obtained at an applied current density of 1 mA cm−2. This indicates the oxygen generation at the disc and the corresponding reduction at the Pt-ring. While incrementing the applied current density from 1 mA cm−2 to 10 mA cm−2, it was found that faradaic efficiency decreased. The faradaic efficiency at 10 mA cm−2 reached a low value of 54%. The gradual decrease in the faradaic efficiency with the applied current density is due to the inefficiency of the Pt-ring in collecting all the evolved oxygen. The faradaic efficiency obtained at 1 mA cm−2 is considered as the actual value since this current density is sufficient to produce a substantial amount of oxygen. Finally, the higher faradaic efficiency obtained confirms the OER on the disk electrode surface instead of other side reactions. After evaluating the oxygen evolution performance of NCS, the stability of the catalyst was measured by the chronoamperometric technique (Fig. 4d). We applied a potential of 1.51 V (overpotential of 280 mV) and performed continuous analysis for 12 h. After 12 h, the current density decreased to 8.5 mA cm−2 from the initial value of 10 mA cm−2. The 85% retention in the activity of the material observed after 12 h points to the high stability of the catalyst. Due to the bubble formation and removal during the OER, a zig-zag behaviour was observed during chronoamperometry. During bubble formation, active sites are blocked by these bubbles from further reaction, and this decreases the current. The accumulated bubbles are released abruptly, causing an increase in current. After 12 h of operation, the electrode was taken out and dried to remove the gases from the surface, and chronoamperometry was restarted resulting in an increase in the current density up to 9 mA cm−2. This shows that the 5% decrease in activity can be attributed to the gas bubbles. This experiment ascertains the durability of the catalyst for real-life applications.
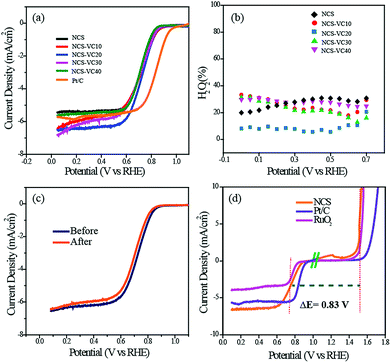
Along with OER activity, the ORR activity of the catalyst was also analyzed. While preparing the slurry for ORR activity analysis, we added carbon black (Vulcan Carbon XC-72) to prevent distortion of the structure and block the restacking to ensure that the catalyst surfaces are well exposed.36,37 Fig. S9† shows the cyclic voltammogram of NCS in O2- and N2-saturated electrolytes. The characteristic oxygen reduction peak starting at 0.92 V was observed in the O2-saturated atmosphere but not in the N2-saturated electrolyte, thus confirming the high ORR activity of the catalyst. We conducted LSV measurements of NCS with different ratios of VC ranging from 10 to 40% of the NCS to identify the optimum combination. For comparison, the ORR activity of the commercially available Pt/C was also measured under the same experimental conditions (Fig. 5a). The onset potential of the Pt/C was observed as 1.0 V vs. RHE. However, all the NCS samples had onset potentials in the range of 0.920 V. The catalyst with 20% VC (NCS-VC20) was found to exhibit the best performance among all the NCS samples. NCS-VC20 has an onset potential value of 0.920 V and E1/2 value of 0.75 V. Even though the NCS-VC20 performance is inferior to Pt/C in terms of potential, it has a higher limiting current density compared to the Pt system. This points towards the availability of more number of accessible and exposed active centers in the system, presumably achieved through the 3D interconnected and distributed structure of the catalyst.
RRDE analysis was performed for evaluating the ORR kinetics of the different NCS samples. The number of electrons involved in the oxygen reduction process and the quantity of the H2O2 intermediate formed during the reaction were calculated from the RRDE data. The number of electrons involved was found to be in the range from 3.4 to 3.8, indicating the predominance of the theoretical four-electron pathway corresponding to the formation of H2O as the end product of the reduction process. NCS-VC20, which showed the best performance, displays an electron transfer number of 3.8, the closest value to 4 among all the samples (Fig. S10†). The formation of intermediate H2O2 was also measured using the RRDE study. Among the different samples, the NCS-VC20 catalyst is detected with less than 10% of H2O2, whereas the other samples generated H2O2 in the range of 20 to 34%. The increase in the H2O2 percentage is indicative of the less preferred ORR kinetics on the catalyst surface. The stability of the NCS for the ORR was evaluated by cycling the potential in the kinetic region for 5000 cycles. After 5000 cycles, it was found that NCS displays only a 20 mV shift in E1/2 while compared to a 35 mV shift displayed for the Pt/C catalyst under the same conditions (Fig. 5c & S11†).
The oxygen electrode activity (OEA) of the NCS catalyst for the bifunctional catalysis was calculated by combining the LSV plots of the ORR and OER. The catalyst with the minimum potential difference (ΔE) for the ORR and OER is found to be the ideal catalyst for the oxygen electrode. The OEA can be measured by subtracting the OER potential at a current density of 10 mV cm−2 from the E1/2 potential of the ORR. The OEA of the NCS calculated from Fig. 5d is found to be 0.83 V. It is lower than that of commercial catalyst coated electrodes such as Pt/C (0.92 V) and RuO2 (0.87). These studies suggest that NCS, with its promising bifunctional activity, has the potential to replace traditional precious metal catalyst systems.
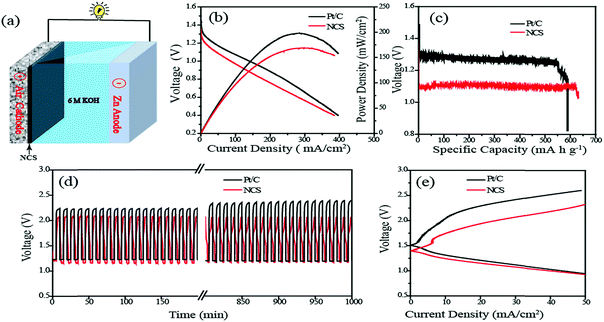
Finally, as a realistic system level validation to understand the bifunctional characteristics of the NCS catalyst, a rechargeable Zn–air battery (ZAB) was fabricated using NCS coated GDE as the cathode, Zn foil as the anode and 6 M KOH as the electrolyte (Fig. 6a). For comparison, a similar system constructed with the commercial Pt/C coated GDE was used as the air electrode and analysed under the same conditions. In the Zn–air battery, the OER and ORR take place at the air electrode in the course of charging and discharging processes, respectively. In the discharging process, the oxygen supplied at the air cathode undergoes reduction to form hydroxyl ions. As-generated hydroxyl ions diffuse towards the anode side of the battery and react with the Zn ions, which are generated by the anodic oxidation of the Zn electrode, to produce the intermediate zincate (Zn(OH)42−) ions. The as-formed intermediate further decomposed into zinc oxide (ZnO) at a supersaturated concentration. During the charging of the battery, reverse reactions occur at the respective electrodes, i.e., the OER will occur at the air electrode interface with the release of oxygen, and the generated ZnO gets redeposited from the electrolyte at the anode. The reaction mechanism of the charging and discharging processes is summarized as follows:
Discharge:
Air electrode:
| O2 + 2H2O + 4e− → 4OH− |
Zinc electrode:
| Zn + 4OH− → Zn(OH)42− + 2e− |
| Zn(OH)42− → ZnO + H2O + 2OH− |
Recharge:
Air electrode:
| 4OH− → O2 + 2H2O + 4e− |
Zinc electrode:
| ZnO + H2O + 2OH− → Zn(OH)42− |
| Zn(OH)42− + 2e− → Zn + 4OH− |
The Zn–air battery has a theoretical open circuit voltage (OCV) of 1.65 V based on the above reaction mechanisms. However, the OCVs of the real cells are normally slightly lower, mainly due to the overpotential associated with the air electrode. In the present case, the OCVs measured for the Zn–air batteries fabricated with NCS and Pt/C are observed to be 1.42 and 1.46 V, respectively. The discharge current–voltage (I–V) polarization plots of the systems obtained in the primary battery mode are shown in Fig. 6b. Maximum power densities of 160 and 200 mW cm−2 respectively are obtained for the systems based on the NCS and Pt/C cathodes, indicating that the newly developed Pt-free system can be a potential candidate for fabricating a cost-effective ZAB system. The rechargeable Zn–air battery made with NCS was quite robust. To explore the robustness of the battery, we conducted galvanostatic discharging of the systems based on NCS and Pt/C as the air electrodes (Fig. S12†). No apparent voltage drop was observed for 22 h during the discharge process, suggesting the higher ORR stability of NCS. The final drop in the continuous discharging occurred due to the complete consumption of the Zn foil. Also, we found that mechanical recharging by replacing the Zn anode could regenerate the battery with the same cathode material at the same potential for a long duration. The specific capacity normalised to the mass of the consumed Zn was calculated to be 636 mA h g−1 for the NCS and 587 for the Pt/C based systems (Fig. 6c). The energy density calculated from the capacity was 706 W h kg−1 and 686 W h kg−1 for the NCS and Pt/C systems, respectively. Furthermore, the ZAB performance evaluation was conducted in the rechargeable mode. The reversing of the primary reaction requires high overpotential, which is almost higher than 2 V. The higher overpotential comes from the sluggish kinetics of the air electrode and dendrite formation at the Zn anode. The three-dimensional interconnected porous NCS can overcome the activation loss in the air electrode. Fig. 6d shows the typical charge–discharge cycling stability test of the ZAB recorded at a high current density of 10 mA cm−2. The NCS exhibits an initial charge–discharge voltage gap of 0.89 V which is lower than that of Pt/C (0.96 V). After a long run of 1000 min at a rate of 10 min per cycles, the same charge–discharge potential gap is observed to be maintained for NCS. However, in the case of the Pt/C based system, the potential gap increases and reaches 1.18 V. The continuous oxidation–reduction reactions during the course of the charge–discharge cycle can trigger corrosion of the catalyst in the air electrodes. Initial charging of the Pt/C electrode requires 2.21 V, which increases to 2.37 V after 1000 cycles of charge–discharge. The high potential required for the charging initiates the carbon corrosion with concomitant platinum leaching. However, the NCS catalyst appears to be sustained in the corrosive environment without any noticeable change in the charge–discharge potential in the course of the process cycles. Furthermore, Fig. 6e shows the charge–discharge polarization of the rechargeable Zn–air battery. The NCS system exhibits a lower charge–discharge potential gap of 0.78 V at a current density of 20 mA cm−2 compared to the Pt/C based system (1.06 V). This low overpotential gap of the in-house system compared to the system based on the expensive Pt/C electrode points towards the feasibility of developing cost-effective Zn-batteries for realistic applications by using the NCS catalyst as the air electrode.
Conclusion
In this work, we have developed an innovative method for the production of an active electrocatalyst which can facilitate both oxygen evolution and oxygen reduction reactions (OER and ORR, respectively). A low-priced melamine sponge (MS) was used as the template material for the preparation of the three-dimensional interconnected electrocatalyst material (NCS). The NCS catalyst possesses a 3-D morphology with a carbon-nanotube coated melamine foam base and a NiCo2O4 nanoarray over it. The CNT wrapping on MS gives electrical conductivity to the template for further anchoring of the NiCo2O4 nanoarray. The role of the CNT layer in the growth of the NiCo2O4 nanoarray was uncovered by FESEM analysis. TEM analysis identified the two distinct CNT and NiCo2O4 phases in NCS. The interconnected macroporous morphology exposes more active sites and also enables the efficient reactant–product transport on the catalyst surface. Since the catalyst showed bifunctional electrocatalytic activity for the OER and ORR in alkaline medium, its total oxygen electrode activity was found to be higher than that of the state-of-the-art commercial catalyst systems. The NCS catalyst exhibited better performance in rechargeable Zn–air battery. This study concludes that the newly developed bifunctional catalyst can be used as a single electrode material instead of using separate electrode for both ORR and OER in rechargeable Zn–air battery. The low-cost material with a simple synthetic protocol, albeit with higher activity and stability, is an ideal replacement for state-of-the art systems.Conflicts of interest
There are no conflicts to declare.Acknowledgements
PKG acknowledges the Council of Scientific and Industrial Research (CSIR), New Delhi, India, for the research fellowship. KS acknowledges CSIR for the research funding. (Project code: TLP003526). We also thank Mr Fayis for providing the tomography images.References
- D. Larcher and J. M. Tarascon, Nat. Chem., 2014, 7, 19 CrossRef.
- Z.-L. Wang, D. Xu, J.-J. Xu and X.-B. Zhang, Chem. Soc. Rev., 2014, 43, 7746–7786 RSC.
- B. C. Steele and A. Heinzel, Nature, 2001, 414, 345–352 CrossRef CAS.
- J. A. Turner, Science, 1999, 285, 687–689 CrossRef CAS.
- N. Armaroli and V. Balzani, Angew. Chem., Int. Ed., 2007, 46, 52–66 CrossRef CAS.
- S. Park, Y. Shao, J. Liu and Y. Wang, Energy Environ. Sci., 2012, 5, 9331–9344 RSC.
- V. R. Stamenkovic, D. Strmcnik, P. P. Lopes and N. M. Markovic, Nat. Mater., 2016, 16, 57 CrossRef.
- N. M. Markovic, Nat. Mater., 2013, 12, 101–102 CrossRef CAS.
- Y. Li and H. Dai, Chem. Soc. Rev., 2014, 43, 5257–5275 RSC.
- P. Gu, M. Zheng, Q. Zhao, X. Xiao, H. Xue and H. Pang, J. Mater. Chem. A, 2017, 5, 7651–7666 RSC.
- V. Neburchilov, H. Wang, J. J. Martin and W. Qu, J. Power Sources, 2010, 195, 1271–1291 CrossRef CAS.
- G. Girishkumar, B. McCloskey, A. C. Luntz, S. Swanson and W. Wilcke, J. Phys. Chem. Lett., 2010, 1, 2193–2203 CrossRef CAS.
- J. S. Lee, S. T. Kim, R. Cao, N. S. Choi, M. Liu, K. T. Lee and J. Cho, Adv. Energy Mater., 2011, 1, 2 CrossRef.
- Y. Gorlin and T. F. Jaramillo, J. Am. Chem. Soc., 2010, 132, 13612–13614 CrossRef CAS PubMed.
- D. U. Lee, J. Y. Choi, K. Feng, H. W. Park and Z. Chen, Adv. Energy Mater., 2014, 4, 1301389 CrossRef.
- W. T. Hong, Energy Environ. Sci., 2015, 8, 1404–1427 RSC.
- F. Cheng and J. Chen, Chem. Soc. Rev., 2012, 41, 2172–2192 RSC.
- Q. Liu, Y. Wang, L. Dai and J. Yao, Adv. Mater., 2016, 28, 3000–3006 CrossRef CAS.
- J. Masa, W. Xia, I. Sinev, A. Zhao, Z. Sun, S. Grützke, P. Weide, M. Muhler and W. Schuhmann, Angew. Chem., Int. Ed., 2014, 53, 8508–8512 CrossRef CAS.
- M. Jahan, Z. Liu and K. P. Loh, Adv. Funct. Mater., 2013, 23, 5363–5372 CrossRef CAS.
- J. I. Jung, H. Y. Jeong, J. S. Lee, M. G. Kim and J. Cho, Angew. Chem., 2014, 126, 4670–4674 CrossRef.
- C. Jin, X. Cao, L. Zhang, C. Zhang and R. Yang, J. Power Sources, 2013, 241, 225–230 CrossRef CAS.
- J.-I. Jung, M. Risch, S. Park, M. G. Kim, G. Nam, H.-Y. Jeong, Y. Shao-Horn and J. Cho, Energy Environ. Sci., 2016, 9, 176–183 RSC.
- B. Y. Xia, Y. Yan, N. Li, H. B. Wu, X. W. Lou and X. Wang, Nat. Energy, 2016, 1, 15006 CrossRef CAS.
- S. Gadipelli, T. Zhao, S. A. Shevlin and Z. Guo, Energy Environ. Sci., 2016, 9, 1661–1667 RSC.
- C. Zhang, M. Antonietti and T. P. Fellinger, Adv. Funct. Mater., 2014, 24, 7655–7665 CrossRef CAS.
- X. Liu, M. Park, M. G. Kim, S. Gupta, G. Wu and J. Cho, Angew. Chem., Int. Ed., 2015, 54, 9654–9658 CrossRef CAS.
- H. B. Wu, H. Pang and X. W. Lou, Energy Environ. Sci., 2013, 6, 3619–3626 RSC.
- C. Jin, F. Lu, X. Cao, Z. Yang and R. Yang, J. Mater. Chem. A, 2013, 1, 12170–12177 RSC.
- D. U. Lee, B. J. Kim and Z. Chen, J. Mater. Chem. A, 2013, 1, 4754–4762 RSC.
- S. Chen and S.-Z. Qiao, ACS Nano, 2013, 7, 10190–10196 CrossRef CAS.
- H. Hu, B. Guan, B. Xia and X. W. Lou, J. Am. Chem. Soc., 2015, 137, 5590–5595 CrossRef CAS.
- P. K. Gangadharan, S. M. Unni, N. Kumar, P. Ghosh and S. Kurungot, ChemElectroChem, 2017, 4, 2643–2652 CrossRef CAS.
- L. Hu, L. Wu, M. Liao, X. Hu and X. Fang, Adv. Funct. Mater., 2012, 22, 998–1004 CrossRef CAS.
- M. N. Iliev, P. Silwal, B. Loukya, R. Datta, D. H. Kim, N. D. Todorov, N. Pachauri and A. Gupta, J. Appl. Phys., 2013, 114, 033514 CrossRef.
- V. Kashyap, S. K. Singh and S. Kurungot, ACS Appl. Mater. Interfaces, 2016, 8, 20730–20740 CrossRef CAS.
- Y. Ma, H. Wang, S. Ji, J. Goh, H. Feng and R. Wang, Electrochim. Acta, 2014, 133, 391–398 CrossRef.
Footnote |
| † Electronic supplementary information (ESI) available. See DOI: 10.1039/c9na00311h |
| This journal is © The Royal Society of Chemistry 2019 |

