1T-phase MoS2 quantum dots as a superior co-catalyst to Pt decorated on carbon nitride nanorods for photocatalytic hydrogen evolution from water†
Zhangqian
Liang
,
Yichen
Guo
,
Yanjun
Xue
,
Hongzhi
Cui
 * and
Jian
Tian
 *
*
School of Materials Science and Engineering, Shandong University of Science and Technology, Qingdao, 266590, China. E-mail: cuihongzhi1965@163.com; jiantian@sdust.edu.cn
First published on 5th June 2019
Abstract
Molybdenum disulfide (MoS2) has been confirmed to be a promising non-precious-metal co-catalyst for photocatalytic hydrogen (H2) evolution; however, its low-density of active sites and poor electron transfer efficiency have essentially limited its photocatalytic properties. Here we report that 1T-MoS2 quantum dots (QDs) can exceed the performance of noble metals like Pt as co-catalysts in assisting photocatalytic H2 evolution upon forming a heterostructure with C3N4 nanorods (denoted as 1T-MoS2@C3N4 NRs). The presence of 1T-MoS2 QDs is found to improve light harvesting, enhance electronic conductivity as well as boost the density of active sites, resulting in an excellent light absorption range up to the near-infrared (NIR) region and a highly efficient spatial charge separation and transfer process. As a result, the optimized 1T-MoS2@C3N4 NR composite (5.0 wt%) exhibits an extraordinary photocatalytic H2 production rate of 565 μmol h−1 g−1 under simulated solar light irradiation, obviously higher than that of noble metal Pt loaded C3N4 NRs (318 μmol h−1 g−1). Moreover, the 1T-MoS2@C3N4 NR composites exhibit good stability in the cyclic runs for photocatalytic H2 production. This study indicates that the highly active MoS2 as a co-catalyst is highly promising as a substitute for Pt for photocatalytic H2 evolution.
1. Introduction
Due to the emerging energy crisis and global environmental awareness,1–3 the conversion of solar energy into perfect hydrogen (H2) energy via photocatalytic water splitting using semiconductors as catalysts has attracted significant attention.4–7 Hydrogen is considered as an ideal, clean and sustainable candidate to replace exhaustible fossil fuels.8–11 Until now, a rich variety of semiconductor materials have been explored as photocatalysts for hydrogen production.12–15 As a promising semiconductor photocatalyst, C3N4 nanorods (NRs) exhibit a suitable band gap (about 1.38 eV), broader visible-light absorption range than g-C3N4 nanosheets (about 2.47 eV) and a negative conduction band edge potential (below the reduction potential of H2O/H2) for splitting water.16,17 However, bare C3N4 NRs show extremely low activity for the photocatalytic H2 evolution reaction due to the rapid recombination of photogenerated electrons and holes and lack of active sites for photocatalysis.18 Integration of co-catalysts, such as noble metals Au and Pt, into C3N4 NRs has proven to be an effective way for suppressing electron–hole recombination and accelerating photocatalytic H2 evolution.19 However, the scale-up application of the commonly used noble metal co-catalysts is still largely restricted due to their low abundance and high cost.19,20 Therefore, there is in an urgent need to seek noble-metal free alternative co-catalysts compounded with C3N4 NRs for synthesizing C3N4 NR-based heterostructures with significantly enhanced photocatalytic activity.As a typical layered transition metal sulfide, molybdenum disulfide (MoS2), with a sandwich structure of three stacked atomic layers (S–Mo–S), has been considered a promising alternative for noble-metal co-catalysts due to its abundance and low cost.21–24 MoS2 has been designed with various nanostructures, such as nanoparticles,25,26 nanowires,27,28 nanoflowers,29,30 nanosheets,31,32 and quantum dots (QDs).33,34 Interestingly, MoS2 QDs have attracted more significant attention due to their better solubility in aqueous solvents and more edge atoms compared with other MoS2 nanostructures or bulk-MoS2.35 It is well known that MoS2 usually has two phase structures, including a trigonal phase (1T-MoS2) and a hexagonal phase (2H-MoS2).36,37 Natural MoS2 usually exists in the stable 2H phase, showing semiconducting properties with a tunable bandgap of 1.3–1.9 eV.21 However, the inherent semiconducting character of 2H-MoS2 with a low density of active sites and poor conductivity restricts its catalytic performance.1 As reported previously,38 1T-MoS2 offers dense active sites containing catalytically active edges and basal planes, while 2H-MoS2 only possesses edge sites. Besides, compared to 2H-MoS2, the metallic 1T-MoS2 displays excellent conductivity characteristics at ambient temperature, making it suitable as a co-catalyst to accept the electrons for H2 evolution.39
This study aims to prepare highly active MoS2 substituting for noble metal Pt for photocatalytic H2 evolution and clearly certify the electron transfer process between C3N4 and MoS2. Herein, we prepare 1T-MoS2 QD decorated C3N4 NRs (1T-MoS2@C3N4 NRs) by a sonication-assisted hydrothermal method. The obtained 1T-MoS2@C3N4 NR composites exhibit a broad visible and near-infrared (NIR) light absorption range, excellent photocurrent response and charge transfer activity. The 1T-MoS2@C3N4 NR composite with optimal 1T-MoS2 QD loading of 5.0 wt% exhibits a drastically enhanced photocatalytic H2 evolution rate of 565 μmol h−1 g−1, which is almost 1.8 times higher than that of Pt@C3N4 NRs (318 μmol h−1 g−1) under simulated solar light irradiation, as well as good stability in photocatalytic cyclic runs. The 1T-MoS2 QDs apparently show metallic characteristics like Pt, and a series of experimental studies have proven the photo-generated electron transfer process and photocatalytic mechanism.
2. Experimental section
2.1. Synthesis of C3N4 nanorods (NRs)
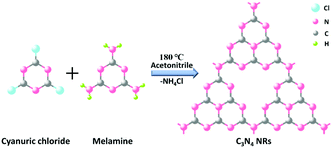
In a typical procedure (Scheme 1), 2.7675 g of 1,3,5-trichlorotriazine and 0.9459 g of melamine powder were dissolved in 60 mL of acetonitrile. The mixture was stirred for 12 h, and then put into a 100 mL Teflon-lined stainless steel autoclave, which was sealed and maintained at 180 °C for 96 h. After heating at a certain temperature, the autoclave was allowed to cool to room temperature naturally. The obtained product was sequentially washed with acetonitrile, distilled water and absolute ethanol several times to remove residual impurities and then the resulting powder was dried at 60 °C for 12 h to get the final products.2.2. Preparation of 1T-MoS2 quantum dots (QDs)
1T-MoS2 QDs were prepared by a simple hydrothermal method (Scheme 2). Specifically, 0.4 g of Na2MoO4·2H2O and 0.38 g of C14H14S2 were dissolved in 30 mL of deionized water and 30 mL of ethanol with sonication for 30 min, respectively. Then, C14H14S2 solution was added to the Na2MoO4·2H2O solution. After sonication for 30 min, the mixture was then transferred to a 100 mL Teflon-lined stainless steel autoclave and heated at 180 °C for 20 h. After the autoclave was cooled to room temperature naturally, the light yellow supernatant was discarded and then 30 mL of deionized water was added to disperse the black product. The resulting suspension was then centrifuged for 90 min at 12![[thin space (1/6-em)]](https://www.rsc.org/images/entities/char_2009.gif) 000 rpm to separate the supernatant and sediment, and the supernatant was 1T-MoS2 QDs. In order to determine the concentration of the 1T-MoS2 QD solution, the supernatant was treated by freeze drying to obtain a powder. Therefore, the concentration of the as-prepared 1T-MoS2 QD solution was determined to be about 0.2 mg mL−1 in terms of the measured weight and the volume of solution before freeze drying.
000 rpm to separate the supernatant and sediment, and the supernatant was 1T-MoS2 QDs. In order to determine the concentration of the 1T-MoS2 QD solution, the supernatant was treated by freeze drying to obtain a powder. Therefore, the concentration of the as-prepared 1T-MoS2 QD solution was determined to be about 0.2 mg mL−1 in terms of the measured weight and the volume of solution before freeze drying.
 | ||
| Scheme 2 Schematic illustration of the synthetic route for 1T-MoS2 QDs through a hydrothermal technique. | ||
2.3. Preparation of 1T-MoS2@C3N4 NR composites
200 mg of C3N4 NRs and 50 mL (0.2 mg mL−1) of the as-prepared 1T-MoS2 QD solution were mixed and then sonicated for over 2 h. Subsequently, the obtained mixture was centrifuged and dried at 60 °C to gain the target product (1T-MoS2@C3N4 NRs with 1T-MoS2 QD loading of 5.0 wt%). Similarly, a series of hybrid catalysts, including 1T-MoS2@C3N4 NRs with 1T-MoS2 QD loading of 0.5 wt%, 1.0 wt%, 3.0 wt% and 7.0 wt%, were obtained by adjusting the volume of the 1T-MoS2 QD solution as 5, 10, 30 and 70 mL, respectively.2.4. Characterization
The synthesized products were characterized by X-ray diffraction (XRD, D/Max 2500PC Rigaku, Japan) utilizing a Cu Kα (λ = 1.5418 Å) radiation source operated at 40 kV at a scan rate of 4° min−1. The nanostructure and surface characteristics of the products were studied on a high-resolution scanning electron microscope (FESEM, FEI Nova Nanosem 450, USA). The morphology and crystal structure of the samples were characterized by transmission electron microscopy (TEM) and high resolution TEM (HRTEM) (JEOL JEM 2100F) with an accelerating voltage of 200 kV, and their composition was examined using energy-dispersive X-ray spectroscopy (EDS) attached to the TEM instrument. X-ray photoelectron spectroscopy (XPS) was carried out with a Thermo ESCALAB 250XI spectrometer using Al Kα radiation at a voltage of 1486.6 eV and calibrated with the C 1s binding energy of 284.8 eV. The XPS results were deconvoluted with XPSPEAK software. The UV-vis-NIR diffuse reflectance spectra (DRS) of the samples were recorded on a UV-vis-NIR spectrophotometer (Hitachi UV-3101) with an integrating sphere attachment within the 200–2000 nm range and with BaSO4 as the reflectance standard. The Brunauer–Emmett–Teller (BET) specific surface area measurements were carried out by N2 adsorption at 77 K using a Micromeritics ASAP2020 nitrogen adsorption–desorption apparatus with prior out gassing of the sample overnight at 120 °C under a primary vacuum. Raman spectra were measured with solid samples using a HORIBA LabRAM HR Evolution Raman microscope. Transient photoluminescence curves of the as-prepared samples were obtained on a FLS980 Series fluorescence lifetime spectrophotometer.2.5. Photoelectrochemical measurements
The photocurrent response and electrochemical impedance of the samples were tested by using an electrochemical workstation (Shanghai Chenhua CHI660D) in a three-electrode system, in which the sample electrode was used as the photocathode, Ag/AgCl as the reference electrode, a Pt wire as the counter electrode, and 0.5 M Na2SO4 aqueous solution as the electrolyte. The working electrodes were prepared as follows: 5 mg of the photocatalyst (1T-MoS2@C3N4 NRs composites) and 1 mg of ethyl cellulose were dispersed into a solution containing 250 μL of ethanol and 250 μL of terpineol by 60 min sonication to prepare a homogeneous slurry. Then, 250 μL of the slurry was dropped onto pretreated stannic oxide (FTO) conductive glass with an exposed area of 4.0 cm2 (2 cm × 2 cm). A 500 W Xe arc lamp equipped with an AM-1.5 filter was adopted as the light source.2.6. Photocatalytic H2 evolution
Photocatalytic H2 production experiments were carried out in an outer irradiation type photoreactor (100 mL quartz glass) in a N2 environment. 20 mg of the 1T-MoS2@C3N4 NR composite photocatalyst was dispersed with mechanical stirring in 100 mL of an aqueous solution containing 20 vol% triethanolamine for further photocatalytic H2 production experiments. Before irradiation, the photocatalytic system was thoroughly degassed to remove air by bubbling N2 for 20 min. The irradiation light source used in this study was a 300 W Xe arc lamp (CELHXF300, Beijing China Education Au-light Co., Ltd), which was equipped with an AM-1.5 filter. The evolved gas was analyzed using a gas chromatograph (Techcomp GC-7920) equipped with a thermal conductivity detector (TCD). The apparent quantum efficiency (AQE) was measured under similar photocatalytic reaction conditions except that a 300 W Xe arc lamp with an AM-1.5 filter was used as the light source. The focused intensity for the 300 W Xe arc lamp with the AM-1.5 filter was ca. 4601.7 W m−2. The apparent quantum efficiency (AQE) was measured and calculated according to the equation:3. Results and discussion
Firstly, the C3N4 NRs were prepared by solvothermally treating cyanuric chloride and melamine in acetonitrile solution at 180 °C for 96 h. Under these conditions, the C3N4 frameworks could be formed due to the condensation of triazine tectons from cyanuric chloride and melamine, accompanied by the release of NH4Cl (Scheme 1). Then, 1T-MoS2 QDs were fabricated by a simple hydrothermal method (Scheme 2). The obtained 1T-MoS2 QDs not only act as electron acceptors with high electrical conductivity, but also offer abundant reaction sites for H2 evolution. Ultimately, 1T-MoS2@C3N4 NR composite photocatalysts were prepared via ultrasonic mixing; in this process, 1T-MoS2 QDs were perfectly decorated on the surface of C3N4 NRs and offer dense active sites containing catalytically active edges and basal planes, just as schematically shown in Scheme 3.The phases of C3N4 NRs and 1T-MoS2@C3N4 NR composites with varying loadings of 1T-MoS2 QDs (0.5, 1.0, 3.0, 5.0 and 7.0 wt%) were investigated by the X-ray diffraction (XRD) patterns (Fig. 1). For comparison, g-C3N4 was obtained by the thermal polymerization of urea. As shown in Fig. S1 (ESI†), g-C3N4 exhibits two peaks located at 13.0° and 27.5°, which can be well indexed to the (100) and (002) planes of g-C3N4, respectively.40,41 Compared with g-C3N4, C3N4 NRs only display one characteristic diffraction peak located at 27.5°, which corresponds to the (002) plane of g-C3N4 due to the interlayer stacking of the conjugated aromatic systems.42 After 1T-MoS2 QD decoration, all 1T-MoS2@C3N4 NR samples exhibit similar diffraction patterns and show no XRD peak shift compared to pure C3N4 NRs. This indicates that the C3N4 NR is the basic structure of the obtained samples, and its structure does not change after 1T-MoS2 QD loading.42 It is obvious that no diffraction peaks of 1T-MoS2 QDs can be observed even for 1T-MoS2@C3N4 NRs (7.0 wt%) due to the low concentration and/or low crystallinity of 1T-MoS2 in the composites.43,44
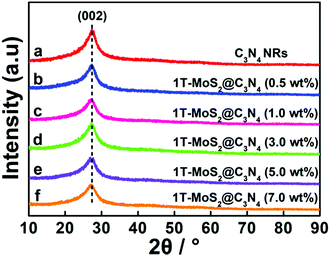 | ||
| Fig. 1 XRD patterns of C3N4 NRs and 1T-MoS2@C3N4 NR composites containing different amounts of 1T-MoS2 QDs (0.5, 1.0, 3.0, 5.0 and 7.0 wt%). | ||
The elemental composition and chemical status of 1T-MoS2@C3N4 NR composites were further investigated by X-ray photoelectron spectroscopy (XPS). The XPS survey spectrum (Fig. S2, ESI†) indicates that the 1T-MoS2@C3N4 NR composites are composed of C, N, Mo and S elements. In addition, the O 1s peak can also be found, due to the surface absorption and oxidation during the preparation process.45 To further analyze the 1T-MoS2@C3N4 NR composites, the high-resolution spectra for C 1s, N 1s Mo 3d and S 2p of the 1T-MoS2@C3N4 NR composites are depicted (Fig. 2). The C 1s spectrum (Fig. 2a) of the samples shows three peaks at 284.8, 286.3 and 288.4 eV, which can be attributed to the carbon nitride matrix group (C–C), the sp2-hybridized carbon atoms bonded to nitrogen atom in the aromatic ring group (C–N–C) and the sp2-hybridized carbon atoms bonded to three nitrogen atoms in the aromatic ring attached to the NH2 group (C–(N)3), respectively.46,47 The N 1 s spectrum (Fig. 2b) can be fitted into three peaks at 398.8, 399.6 and 400.5 eV, which arise from the sp2-hybridized nitrogen atom (C–N–C), sp3-hybridized nitrogen atom (N–(C)3) and amino groups carrying hydrogen (C–NHx), respectively.16,48 To better illustrate the existence of 1T-MoS2, the Mo 3d and S 2p XPS spectra of the 1T-MoS2@C3N4 NR composites are given in Fig. 2c and d. The Mo 3d spectrum (Fig. 2c) can be resolved into five peaks. The two small peaks located at 229.5 eV (Mo 3d5/2) and 232.5 eV (Mo 3d3/2) indicate the 4+ oxidation state of 2H-phase MoS2, and the main peaks at 228.0 and 231.9 eV suggest the formation of 1T-phase MoS2.49,50 The peak located at 235.5 eV was assigned to Mo6+, probably owing to the oxidation of 1T-MoS2@C3N4 NRs by the exposure to air. Fig. 2d shows the S 2p spectrum, in which the main two peaks at 161.2 eV (S 2p3/2) and 162.2 eV (S 2p1/2) represent the 1T-phase MoS2, and the two small peaks at 161.9 eV (S 2p3/2) and 163.3 eV (S 2p1/2) indicate the 2H-phase MoS2.49,50 The concentration of the 1T phase in the 1T-MoS2@C3N4 NR composites is approximately calculated to be ∼79%, which indicates the predominance of the 1T phase over its 2H counterpart. The above results further confirm the existence of C3N4 and 1T-MoS2 in 1T-MoS2@C3N4 NR samples. The vibrational properties of the prepared C3N4 NRs and 1T-MoS2@C3N4 NR composites (5.0 wt%) were determined by Raman spectroscopy. As can be seen in Fig. S3 (ESI†), the band at 978 cm−1 corresponds to the stretching vibration of the CN heterocycle in the g-C3N4 structure.51 The band at 740 cm−1 is also ascribed to g-C3N4, which appears in both spectra. No peaks ascribed to 1T-MoS2 QDs can be detected in the 1T-MoS2@C3N4 NRs (5.0 wt%), due to the low content of MoS2 in the hybrid. This result is consistent with the XRD data as shown in Fig. 1.
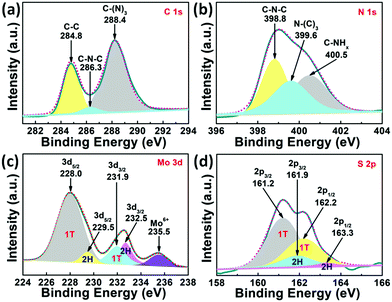 | ||
| Fig. 2 High-resolution peak-fitting XPS spectra of (a) C 1s, (b) N 1s, (c) Mo 3d and (d) S 2p of 1T-MoS2@C3N4 NR composites (5.0 wt%). | ||
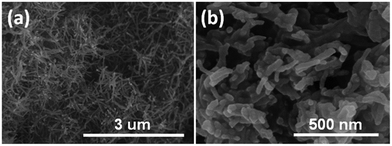
The morphology and size of C3N4 NRs and 1T-MoS2@C3N4 NR composites were investigated by scanning electron microscopy (SEM). Obviously, the C3N4 sample exhibits a rod-like structure with a length of 300–500 nm (Fig. 3a). Subsequently, the surface decoration of C3N4 NRs with 1T-MoS2 QDs was carried out by sonication of the C3N4 NRs in an aqueous solution of 1T-MoS2 QDs for over 2 h. In this process, 1T-MoS2 QDs could be absorbed on the surface of C3N4 NRs, resulting in the assembly of 1T-MoS2 QDs on C3N4 NRs (Scheme 3). The obtained 1T-MoS2@C3N4 NR composites still retained the rod-shaped structure (Fig. 3b). 1T-MoS2 QDs were difficult to discern through SEM due to their very small size.
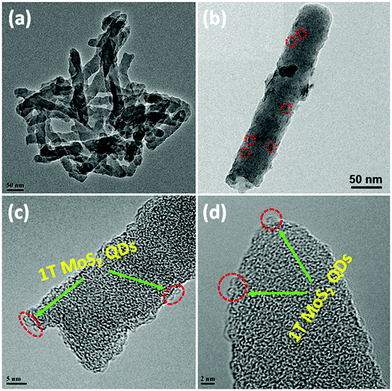
In order to further visualize the morphology and microstructure of the as-prepared pure 1T-MoS2 QDs and 1T-MoS2@C3N4 NR composites, TEM images were employed (Fig. 4 and 5). Obviously, Fig. 4a reveals that pure 1T-MoS2 QDs are distributed homogeneously without apparent aggregation, which possess well-dispersed ultrasmall particles of size about 2–3 nm. From the HRTEM image (Fig. 4b) of 1T-MoS2 QDs, no typical (002) lattice plane of crystalline MoS2 is observed, indicating that 1T-MoS2 QDs contain only a single layer or very few layers.52 The atomic force microscopy (AFM) image shown in Fig. S4 (ESI†) also confirms the formation of the 1T-MoS2 QDs with good dispersion. Furthermore, the 1T-phase MoS2 can be clearly visualized (inset in Fig. 4b), evidently displaying the trigonal lattice areas (octahedral coordination) of the 1T phase of MoS2 QDs.50,53 As displayed in Fig. 5a, the 1T-MoS2@C3N4 NR composites exhibit a 1D rod-shaped morphology. However, plenty of black dot-like structures (the regions enclosed by the red circles) are seen decorating the nanorod with a diameter of several nanometers (Fig. 5b). A closer inspection of the TEM image (Fig. 5c and d) indicates that these nanodots (1T-MoS2 QDs) are closely attached on the surface of the nanorod. Such a heterostructure with close contact interfaces ensures the fast separation and transfer of charge carriers across the interfaces. Moreover, the EDS mapping (Fig. 6) analysis of 1T-MoS2@C3N4 NR composites displays the uniform distribution of C, N, Mo and S, further confirming that 1T-MoS2 QDs are successfully loaded on the surface of C3N4 NRs.
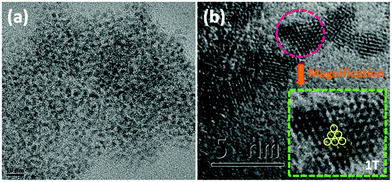 | ||
| Fig. 4 (a) TEM images and (b) HRTEM image of 1T-MoS2 QDs (the inset shows the magnification of the region enclosed by the pink circle). | ||
 | ||
| Fig. 6 Selected HAADF image and corresponding EDS elemental mappings of 1T-MoS2@C3N4 NR composites (5.0 wt%). | ||
To determine the surface area of the as-synthesized samples, the N2 adsorption–desorption isotherms were measured for the samples. The nitrogen adsorption–desorption isotherms and the corresponding pore size distribution curves of the samples are shown in Fig. S5 (ESI†), and the specific surface areas of the samples are listed in Table S1 (ESI†). The N2 adsorption–desorption isotherms of all the samples are typical Langmuir type IV isotherms with a typical H3 hysteresis loop at high pressure, indicating the presence of mesopores in all samples.54,55 The pore size distribution curves (Fig. S5b–f, ESI† inset) reveal that the pore size diameter of the 1T-MoS2@C3N4 NR composites is about 2 nm, while the pore size diameter of pure C3N4 NRs is about 4 nm (Fig. S5a, ESI† inset). Besides, the results show that the 1T-MoS2@C3N4 NR composites containing different amounts of 1T-MoS2 QDs have similar specific surface areas (Table S1, ESI†). Thus, the effect of the BET surface area on the hydrogen evolution activity of the 1T-MoS2@C3N4 NR composites is uncertain in this work.
The optical properties of the samples were measured by UV-vis-NIR diffuse reflectance spectroscopy (DRS) (Fig. 7 and Fig. S6a, ESI†). As shown in Fig. S6a (ESI†), g-C3N4 nanosheets exhibit a short-wavelength absorption with an edge at ∼470 nm. For the C3N4 NR sample, it exhibits a wide photoabsorption range from the UV to visible region with an absorption edge at ∼754 nm, indicating a large redshift compared with that of pure g-C3N4 (∼470 nm). The UV-vis-NIR absorption spectrum of 1T-MoS2 QDs gives a smooth line without any obvious absorption band (Fig. S7, ESI†), confirming the metallic characteristics of 1T-MoS2 QDs. Furthermore, it is obvious that loading the 1T-MoS2 QD co-catalysts onto the surface of C3N4 NRs can broaden the absorption range to the NIR light region (Fig. 7). Importantly, the 1T-MoS2@C3N4 NR composites (5.0 wt%) display stronger optical absorption with an edge at ∼850 nm, indicating a large red-shift compared with that of C3N4 NRs and 1T-MoS2@C3N4 NR composites containing other amounts of 1T-MoS2 QDs (0.5, 1.0, 3.0 and 7.0 wt%). Thus, the enhanced light absorption of 1T-MoS2@C3N4 NR composites is favorable to produce more photo-generated electrons and holes, which is in turn beneficial to the photocatalytic HER activity.56 Furthermore, the band gap energy of g-C3N4 and C3N4 NRs could be computed from the formula (αhν)1/2 ∝ hν − Eg, where α, h, ν, and Eg are the absorption coefficient, Planck's constant, light frequency, and band gap energy, respectively. Then the estimated Eg of g-C3N4 and C3N4 NRs is 2.47 and 1.38 eV, respectively (Fig. S6b, ESI†).
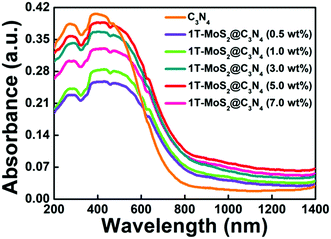 | ||
| Fig. 7 UV-vis-NIR light absorption spectra of C3N4 NRs and 1T-MoS2@C3N4 NR composites containing different amounts of 1T-MoS2 QDs (0.5, 1.0, 3.0, 5.0 and 7.0 wt%). | ||
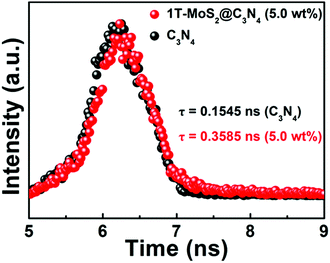
We further tested the photoexcited charge carrier lifetimes of pure C3N4 NRs and 1T-MoS2@C3N4 NR composites by using time-resolved fluorescence decay spectroscopy. As shown in Fig. 8, by fitting the fluorescence lifetime decay curve, we conclude that both pure C3N4 NRs and 1T-MoS2@C3N4 NR composites show single exponential decay. The intensity-average lifetime (τ) of pure C3N4 NRs is 0.1545 ns, which is lower than that of the 1T-MoS2@C3N4 NR composites (0.3585 ns). The extension of the trapped carrier lifetimes in 1T-MoS2@C3N4 NR composites indicates the advantages of surface decoration of C3N4 NRs by 1T-MoS2 QDs, which promotes electron–hole separation and hinders their efficient recombination.
To gain deep insights into the charge transfer behaviors in the 1T-MoS2@C3N4 NR composites, the photocurrent responses were studied and electrochemical impedance spectroscopy (EIS) was carried out. Fig. 9a shows the periodic on/off photocurrent response of all samples when irradiated under solar light. It can be seen that all the samples show an immediate rise in the photocurrent response when the light is on. In contrast, the photocurrent rapidly decreases to zero when the light is turned off. The on–off cycles of photocurrent are reproducible, which indicates that the photogenerated electrons are transferred to the back contact across the samples to form the photocurrent under light irradiation.57 The pure C3N4 NR electrode generates a relatively low photocurrent density of 0.019 μA cm−2. The photocurrent response curves (Fig. 9a) show an increased current density in all 1T-MoS2@C3N4 NR samples as compared with pure C3N4 NRs, indicating a noticeable improvement of the electron–hole separation efficiency by the introduction of 1T MoS2 QD co-catalysts.56 The 1T-MoS2@C3N4 NR composite (5.0 wt%) electrode shows the highest photocurrent density of 0.108 μA cm−2, which is about 5.7 times higher than that of a bare C3N4 NR electrode. On the one hand, 1T-MoS2@C3N4 NR composites (5.0 wt%) have a wider absorption range and stronger photoabsorption ability, resulting in more photogenerated carriers. On the other hand, 1T-MoS2 QDs can act as electron acceptors to capture photo-generated electrons before they recombine with holes, leading to more effective separation of electron–hole pairs. The EIS measurement is also an effective approach to study the charge transfer process. In general, a smaller arc radius on an EIS Nyquist plot means a smaller charge-transfer resistance on the electrode surface and a higher separation efficiency of electron–hole pairs.58 As illustrated in Fig. 9b, the order of arc size for the samples under solar light irradiation is 1T-MoS2@C3N4 NR composites (5.0 wt%) < 1T-MoS2@C3N4 NR composites (3.0 wt%) < 1T-MoS2@C3N4 NR composites (7.0 wt%) < 1T-MoS2@C3N4 NR composites (1.0 wt%) < 1T-MoS2@C3N4 NR composites (0.5 wt%) < pure C3N4 NRs, suggesting that the 1T-MoS2@C3N4 NR composites (5.0 wt%) display the most effective separation of photogenerated charges. Apparently, this is in good agreement with luminescence decay and photocurrent results, validating that the 1T-MoS2@C3N4 NR composites would obviously improve the charge transfer rate. Note that the higher interfacial charge transfer ability of the 1T-MoS2@C3N4 NR composites implies that the recombination rate of electrons and holes has been reduced, thereby contributing to the enhanced photocatalytic efficiency and stability toward hydrogen production.
 | ||
| Fig. 9 (a) The transient photocurrent responses and (b) the electrochemical impedance spectra (EIS) of the samples under solar light irradiation. | ||
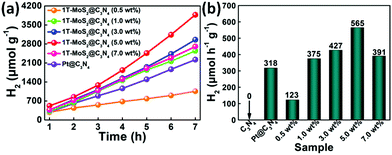
The photocatalytic activity for H2 evolution was evaluated under simulated sunlight irradiation using a 300 W Xe arc lamp with an AM-1.5 filter. Fig. 10 presents a comparison of the photocatalytic H2 production activities of C3N4 NRs (Pt as co-catalyst) and 1T-MoS2@C3N4 NR composites containing different amounts of co-catalyst (0.5, 1.0, 3.0, 5.0 and 7.0 wt% 1T-MoS2 QDs) in aqueous solution with TEOA. It can be seen that no H2 is detected for C3N4 NRs in the absence of a co-catalyst (Fig. S8, ESI†), which can be ascribed to their limited light-harvesting efficiency and fast recombination of photoinduced charge carriers. Notably, after the assembly of 1T-MoS2 QDs, a significantly improved photocatalytic performance was observed, with the highest photocatalytic H2 evolution rate of 565 μmol h−1 g−1 occurring for the 5.0 wt% MoS2 sample (Fig. 10). The 1T-MoS2@C3N4 NR composites (0.5, 1.0 and 3.0 wt%), which are composed of a small amount of MoS2, display a lower photocatalytic performance compared with 1T-MoS2@C3N4 NR composites (5.0 wt%), because of the relatively poor light absorption (Fig. 7). Furthermore, with increasing the content of MoS2 from 5.0 wt% to 7.0 wt%, a decrease in the photocatalytic activity of the 1T-MoS2@C3N4 NR composites is discovered, which is due to the light-screening effect of the excessive amount of co-catalysts.59,60
Besides, the photocatalytic H2 evolution rate of 1T-MoS2@C3N4 NR composites (5.0 wt%) also exceeds that of Pt@C3N4 NRs (318 μmol h−1 g−1). Moreover, the photocatalytic H2 production catalyzed by 1T-MoS2@C3N4 NR composites (5.0 wt%) is measured under prolonged simulated solar light irradiation for 21 h (Fig. S9, ESI†), and no obvious decay of photocatalytic HER is discerned, suggesting good durability and practical application for 1T-MoS2@C3N4 NR composites. High-resolution peak-fitting XPS spectra of Mo 3d of 1T-MoS2@C3N4 NR composites (5.0 wt%) after cycling under simulated solar light irradiation are measured (Fig. S10, ESI†). As shown in Fig. S10 (ESI†), there is almost no change in the Mo6+ (MoO3) XPS peaks of the 1T-MoS2@C3N4 NR composites (5.0 wt%) before cycling and after cycling, which further confirms the excellent stability of the 1T-MoS2@C3N4 NR composites. We further evaluated the apparent quantum efficiency (AQE) of the samples under a 300 W Xe arc lamp with an AM-1.5 optical filter. Table S2 (ESI†) shows the comparison of AQE values over C3N4 NRs, Pt@C3N4 NRs and 1T-MoS2@C3N4 NR composites containing different amounts of 1T-MoS2 QDs (0.5, 1.0, 3.0, 5.0 and 7.0 wt%): 0 (C3N4 NRs) < 0.47% (1T-MoS2@C3N4-0.5 wt%) < 0.99% (Pt@C3N4 NRs) < 1.13% (1T-MoS2@C3N4-1.0 wt%) < 1.21% (1T-MoS2@C3N4-7.0 wt%) < 1.31% (1T-MoS2@C3N4-3.0 wt%) < 1.73% (1T-MoS2@C3N4-5.0 wt%). Therefore, the 1T-MoS2@C3N4 NR composites can be used as an efficient and stable photocatalyst.
To further explore the photocatalytic mechanism of 1T-MoS2@C3N4 NR composites, Mott–Schottky plots were recorded to evaluate the conduction band (CB) levels of C3N4 NRs. As shown in Fig. S11 (ESI†), by extrapolating the x intercept of the linear region, the flat band potentials (EFB) of C3N4 NRs were obtained to be −0.71 V vs. Ag/AgCl from the Mott–Schottky plots, corresponding to −0.51 V vs. the normal hydrogen electrode (NHE). It is widely accepted that the conduction band potential (ECB) of an n-type semiconductor is more negative by about 0.1 V than its EFB value,61 therefore, the ECB of C3N4 NRs could be approximated to be −0.61V vs. NHE. Combined with the Eg of C3N4 NRs (1.38 eV) obtained from the UV-vis DRS spectra (Fig. S6b, ESI†), the estimated valence band potential (EVB) of C3N4 NRs is 0.77 eV vs. NHE.
Based on the above results, a possible photocatalytic HER process of 1T-MoS2@C3N4 NR composites under simulated solar light irradiation is proposed and schematically displayed in Scheme 4. Typically, under simulated solar light irradiation, electron–hole pairs are generated in C3N4 NRs, and then the photo-excited electrons rapidly transfer to the 1T-MoS2 QD co-catalyst quickly, because the 1T-MoS2 QDs are good electron acceptors due to their metallic characteristics. As photoelectron acceptors, 1T-MoS2 QDs act as active sites for H2 evolution. In addition, in the 1T-MoS2@C3N4 NR composites, small-sized 1T-MoS2 QDs well attached on the C3N4 NRs enable electron transfer from C3N4 NRs to 1T-MoS2 QDs in a short distance and simultaneously provide more reaction sites on both basal planes and edges for the evolution of H2. The holes would react with the sacrificial agent (TEOA) (Scheme 4). This effective electron transport between C3N4 NRs and 1T-MoS2 QDs tremendously decreases the recombination of electron–hole pairs and prolong the charge lifetime.
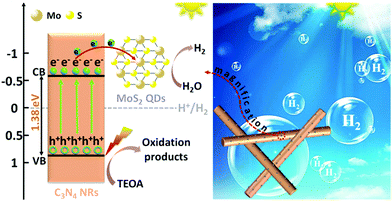 | ||
| Scheme 4 Schematic illustration of the photocatalytic mechanism of 1T-MoS2@C3N4 NR composites under simulated solar light irradiation. | ||
4. Conclusions
1T-MoS2 QDs were successfully synthesized and subsequently assembled with C3N4 NRs as effective co-catalysts for photocatalytic H2 evolution over noble metal Pt. Specifically, an optimized 1T-MoS2@C3N4 NR composite (5.0 wt%) attains a remarkable increased solar light photocatalytic H2 evolution rate of 565 μmol h−1 g−1 which is apparently higher than that of Pt@C3N4 NRs (318 μmol h−1 g−1). The highly efficient photocatalytic performance of the 1T-MoS2@C3N4 NR composite is primarily attributed to the following facts: (1) 1T-MoS2 QDs in cooperation with C3N4 NRs can enhance the light absorption intensity and broaden the light absorption range to NIR light; (2) the tiny particle size of 1T-MoS2 QD co-catalysts can provide more active sites, which is helpful for the photocatalytic reaction; (3) the close contact layer between metallic 1T-MoS2 QDs and C3N4 NRs is more favorable to transfer photo-generated electrons from the CB of C3N4 to the surface of conductive 1T-MoS2, and then the electrons would rapidly participate in photocatalytic HER.Conflicts of interest
There are no conflicts to declare.Acknowledgements
The authors are thankful for funding from the National Natural Science Foundation of China (No. 51872173), Taishan Scholarship of Young Scholars (No. tsqn201812068), Natural Science Foundation of Shandong Province (No. ZR2017JL020), Taishan Scholarship of Climbing Plan (No. tspd20161006), and the Key Research and Development Program of Shandong Province (No. 2018GGX102028).Notes and references
- Y. Cheng, G. Yang, H. Jiang, S. G. Zhao, Q. Liu and Y. Xie, ACS Appl. Mater. Interfaces, 2018, 10, 38880–38891 CrossRef CAS PubMed.
- Y. Ma, L. Yin, G. Cao, Q. Huang, M. He, W. Wei, H. Zhao, D. Zhang, M. Wang and T. Yang, Small, 2018, 1703613 CrossRef PubMed.
- Y. Wang, W. Wei, X. Liu and Y. Gu, Sol. Energy Mater. Sol. Cells, 2012, 98, 129–145 CrossRef CAS.
- X. Li, X. Lv, N. Li, J. Wu, Y. Z. Zheng and X. Tao, Appl. Catal., B, 2019, 243, 76–85 CrossRef CAS.
- X. Zhang, Y. Guo, J. Tian, B. Sun, Z. Liang, X. Xu and H. Cui, Appl. Catal., B, 2018, 232, 355–364 CrossRef CAS.
- M. Zhu, S. Kim, L. Mao, M. Fujitsuka, J. Zhang, X. Wang and T. Majima, J. Am. Chem. Soc., 2017, 139, 13234–13242 CrossRef CAS PubMed.
- H. Zhang, G. Liu, L. Shi, H. Liu, T. Wang and J. Ye, Nano Energy, 2016, 22, 149–168 CrossRef CAS.
- H. Li, X. Zhao, H. Liu, S. Chen, X. Yang, C. Lv, H. Zhang, X. She and D. Yang, Small, 2018, 1802824 CrossRef PubMed.
- L. Hang, T. Zhang, Y. Sun, D. Men, X. Lyu, Q. Zhang, W. Cai and Y. Li, J. Mater. Chem. A, 2018, 6, 19555–19562 RSC.
- P. Li, X. Duan, Y. Kuang, Y. Li, G. Zhang, W. Liu and X. Sun, Adv. Energy Mater., 2018, 8, 1703341 CrossRef.
- W. Zhang, Y. Zou, H. Liu, S. Chen, X. Wang, H. Zhang, X. She and D. Yang, Nano Energy, 2019, 56, 813–822 CrossRef CAS.
- Y. Li, Z. Yin, G. Ji, Z. Liang, Y. Xue, Y. Guo, J. Tian, X. Wang and H. Cui, Appl. Catal., B, 2019, 246, 12–20 CrossRef CAS.
- Y.-N. Liu, C.-C. Shen, N. Jiang, Z.-W. Zhao, X. Zhou, S.-J. Zhao and A.-W. Xu, ACS Catal., 2017, 7, 8228–8234 CrossRef CAS.
- Y. Tan, Z. Shu, J. Zhou, T. Li, W. Wang and Z. Zhao, Appl. Catal., B, 2018, 230, 260–268 CrossRef CAS.
- D. Zeng, T. Zhou, W.-J. Ong, M. Wu, X. Duan, W. Xu, Y. Chen, Y.-A. Zhu and D.-L. Peng, ACS Appl. Mater. Interfaces, 2019, 11, 5651–5660 CrossRef CAS PubMed.
- Y. Cui, Z. Ding, X. Fu and X. Wang, Angew. Chem., Int. Ed., 2012, 124, 11984–11988 CrossRef.
- Y. Li, Y. Xue, J. Tian, X. Song, X. Zhang, X. Wang and H. Cui, Sol. Energy Mater. Sol. Cells, 2017, 168, 100–111 CrossRef CAS.
- D. Zeng, W. Xu, W.-J. Ong, J. Xu, H. Ren, Y. Chen, H. Zheng and D.-L. Peng, Appl. Catal., B, 2018, 221, 47–55 CrossRef CAS.
- Y. Chang, Z. Li, X. Shen, B. Zhu, D. K. Macharia, Z. Chen and L. Zhang, J. Hazard. Mater., 2018, 344, 1188–1197 CrossRef CAS PubMed.
- H.-J. Li, D.-J. Qian and M. Chen, ACS Appl. Mater. Interfaces, 2015, 7, 25162–25170 CrossRef CAS PubMed.
- K. Chang, X. Hai, H. Pang, H. Zhang, L. Shi, G. Liu, H. Liu, G. Zhao, M. Li and J. Ye, Adv. Mater., 2016, 28, 10033–10041 CrossRef CAS PubMed.
- D. Lu, H. Wang, X. Zhao, K. K. Kondamareddy, J. Ding, C. Li and P. Fang, ACS Sustainable Chem. Eng., 2017, 5, 1436–1445 CrossRef CAS.
- N. Qina, J. Xiong, R. Lianga, Y. Liu, S. Zhang, Y. Li, Z. Li and L. Wu, Appl. Catal., B, 2017, 202, 374–380 CrossRef.
- X.-L. Yin, L.-L. Li, W.-J. Jiang, Y. Zhang, X. Zhang, L.-J. Wan and J.-S. Hu, ACS Appl. Mater. Interfaces, 2016, 8, 15258–15266 CrossRef CAS PubMed.
- Y. Jiang, X. Li, S. Yu, L. Jia, X. Zhao and C. Wang, Adv. Funct. Mater., 2015, 25, 2693–2700 CrossRef CAS.
- Y. Li, H. Wang, L. Xie, Y. Liang, G. Hong and H. Dai, J. Am. Chem. Soc., 2011, 133, 7296–7299 CrossRef CAS PubMed.
- H. Xu, S. Liu, Z. Ding, S. J. R. Tan, K. M. Yam, Y. Bao, C. T. Nai, M.-F. Ng, J. Lu, C. Zhang and K. P. Loh, Nat. Commun., 2016, 7, 12904 CrossRef CAS PubMed.
- C. Ling, Y. Ouyang, L. Shi, S. Yuan, Q. Chen and J. Wang, ACS Catal., 2017, 7, 5097–5102 CrossRef CAS.
- J. M. Wu, W. E. Chang, Y. T. Chang and C. K. Chang, Adv. Mater., 2016, 28, 3718–3725 CrossRef CAS PubMed.
- X. Lu, Y. Lin, H. Dong, W. Dai, X. Chen, X. Qu and X. Zhang, Sci. Rep., 2017, 7, 42309 CrossRef CAS PubMed.
- C. Liu, L. Wang, Y. Tang, S. Luo, Y. Liu, S. Zhang, Y. Zeng and Y. Xu, Appl. Catal., B, 2015, 164, 1–9 CrossRef CAS.
- W. Zhou, Z. Yin, Y. Du, X. Huang, Z. Zeng, Z. Fan, H. Liu, J. Wang and H. Zhang, Small, 2013, 9, 140–147 CrossRef CAS PubMed.
- X. Hao, Z. Jin, H. Yang, G. Lu and Y. Bi, Appl. Catal., B, 2017, 210, 45–56 CrossRef CAS.
- D. Gopalakrishnan, D. Damien and M. M. Shaijumon, ACS Nano, 2014, 8, 5297–5303 CrossRef CAS PubMed.
- W. Gu, Y. Yan, C. Zhang, C. Ding and Y. Xian, ACS Appl. Mater. Interfaces, 2016, 8, 11272–11279 CrossRef CAS PubMed.
- G. Eda, H. Yamaguchi, D. Voiry, T. Fujita, M. Chen and M. Chhowalla, Nano Lett., 2011, 11, 5111–5116 CrossRef CAS PubMed.
- U. Maitra, U. Gupta, M. De, R. Datta, A. Govindaraj and C. N. R. Rao, Angew. Chem., Int. Ed., 2013, 125, 13295–13299 CrossRef.
- D. Voiry, M. Salehi, R. Silva, T. Fujita, M. Chen, T. Asefa, V. B. Shenoy, G. Eda and M. Chhowalla, Nano Lett., 2013, 13, 6222–6227 CrossRef CAS PubMed.
- Q. Li, Q. Shang, A. Khalil, Q. Fang, S. Chen, Q. He, T. Xiang, D. Liu, Q. Zhang, Y. Luo and L. Song, ChemCatChem, 2016, 8, 1–7 CrossRef.
- D. Ruan, S. Kim, M. Fujitsuka and T. Majima, Appl. Catal., B, 2018, 238, 638–646 CrossRef CAS.
- S. Martha, A. Nashim and K. M. Parida, J. Mater. Chem. A, 2013, 1, 7816–7824 RSC.
- L. Kong, Y. Ji, Z. Dang, J. Yan, P. Li, Y. Li and S. Liu, Adv. Funct. Mater., 2018, 28, 1800668 CrossRef.
- X. L. Yin, L. L. Li, W. J. Jiang, Z. Yun, Z. Xiang, L. J. Wan and J. S. Hu, ACS Appl. Mater. Interfaces, 2016, 8, 15258 CrossRef CAS PubMed.
- M. Liu, F. Li, Z. Sun, L. Ma, L. Xu and Y. Wang, Chem. Commun., 2014, 50, 11004–11007 RSC.
- W.-J. Ong, L. K. Putri, L.-L. Tan, S.-P. Chai and S.-T. Yong, Appl. Catal., B, 2016, 180, 530–543 CrossRef CAS.
- A. Thomas, A. Fischer, F. Goettmann, M. Antonietti, J. Müller, R. Schlçgl and J. M. Carlsson, J. Mater. Chem., 2008, 18, 4893 RSC.
- Y. Chang, Z. Liu, X. Shen, B. Zhu, D. K. Macharia, Z. Chen and L. Zhang, J. Hazard. Mater., 2018, 344, 1188–1197 CrossRef CAS PubMed.
- J. Li, Y. Yin, E. Liu, Y. Ma, J. Wan, J. Fan and X. Hu, J. Hazard. Mater., 2017, 321, 183–192 CrossRef CAS PubMed.
- M. A. Lukowski, A. S. Daniel, F. Meng, A. Forticaux, L. Li and S. Jin, J. Am. Chem. Soc., 2013, 135, 10274–10277 CrossRef CAS PubMed.
- Q. Liu, Q. Fang, W. Chu, Y. Wan, X. Li, W. Xu, M. Habib, S. Tao, Y. Zhou, D. Liu, T. Xiang, A. Khalil, X. Wu, M. Chhowalla, P. M. Ajayan and L. Song, Chem. Mater., 2017, 29, 4738–4744 CrossRef CAS.
- N. Li, J. Zhou, Z. Sheng and W. Xiao, Appl. Surf. Sci., 2018, 430, 218–224 CrossRef CAS.
- X. Ren, L. Pang, Y. Zhang, X. Ren, H. Fan and S. Liu, J. Mater. Chem. A, 2015, 3, 10693–10697 RSC.
- X. Geng, W. Sun, W. Wu, B. Chen, A. Al-Hilo, M. Benamara, H. Zhu, F. Watanabe, J. Cui and T. P. Chen, Nat. Commun., 2016, 7, 10672 CrossRef CAS PubMed.
- Z. Liang, X. Bai, P. Hao, Y. Guo, Y. Xue, J. Tian and H. Cui, Appl. Catal., B, 2019, 243, 711–720 CrossRef CAS.
- Y. Li, X. Deng, J. Tian, Z. Liang and H. Cui, Appl. Mater. Today, 2018, 13, 217–227 CrossRef.
- B. Han, S. Liu, N. Zhang, Y. J. Xu and Z. R. Tang, Appl. Catal., B, 2017, 202, 298–304 CrossRef CAS.
- A. Meng, J. Zhang, D. Xu, B. Cheng and J. Yu, Appl. Catal., B, 2016, 198, 286–294 CrossRef CAS.
- X. Hu, S. Lu, J. Tian, N. Wei, X. Song, X. Wang and H. Cui, Appl. Catal., B, 2019, 24, 329–337 Search PubMed.
- L. Shen, M. Luo, Y. Liu, R. Liang, F. Jing and L. Wu, Appl. Catal., B, 2015, 166–167, 445–453 CrossRef CAS.
- Y. Hou, A. B. Laursen, J. Zhang, G. Zhang, Y. Zhu, X. Wang, S. Dahl and I. Chorkendorff, Angew. Chem., Int. Ed., 2013, 125, 3709–3713 CrossRef.
- T. N. Trung, D. B. Seo, N. D. Quang, D. Kim and E. T. Kim, Electrochim. Acta, 2018, 260, 150–156 CrossRef CAS.
Footnote |
| † Electronic supplementary information (ESI) available. See DOI: 10.1039/c9qm00223e |
| This journal is © the Partner Organisations 2019 |

