 Open Access Article
Co-adsorption of an anionic dye in the presence of a cationic dye and a heavy metal ion by graphene oxide and photoreduced graphene oxide†
Xiaorong Zhangab,
Chengbing Qin *ab,
Yani Gongab,
Yunrui Songab,
Guofeng Zhangab,
Ruiyun Chenab,
Yan Gaoab,
Liantuan Xiao*ab and
Suotang Jiaab
aState Key Laboratory of Quantum Optics and Quantum Optics Devices, Institute of Laser Spectroscopy, Shanxi University, Taiyuan, Shanxi 030006, China. E-mail: chbqin@sxu.edu.cn; xlt@sxu.edu.cn
bCollaborative Innovation Center of Extreme Optics, Shanxi University, Taiyuan, Shanxi 030006, China
First published on 12th February 2019
Abstract
To investigate the adsorption behavior of contaminants with different adsorbents and co-adsorbates under identical conditions, the adsorption capacities of anionic orange II (OII) dye onto graphene oxide (GO) and photoreduced GO (PRGO) in a single-component system and in the presence of cationic methylene blue (MB) dye as well as heavy metal ion Pb2+ were explored. In this work, PRGO was prepared by solar light irradiation of a GO dispersion. GO and PRGO were characterized by Fourier transform infrared spectroscopy, X-ray photoelectron spectroscopy, X-ray diffraction, Raman spectroscopy, atomic force microscopy, scanning electron microscopy, and transmission electron microscopy. The adsorption isotherms of OII, MB, and Pb2+ onto GO and PRGO in single and binary systems have been studied and analyzed by the Langmuir model. In the single system, the adsorption capacity of OII on GO can be promoted from 8.4 mg g−1 to 32.5 mg g−1 after solar light irradiation. While the adsorption capacities of MB and Pb2+ are not affected by the photoreduction process. In the binary system, a marked synergistic effect for the adsorption of OII has been determined in the presence of both MB and Pb2+, where the adsorption capacity of OII on PRGO has been improved from 8.4 mg g−1 to 295 mg g−1 and 105 mg g−1, enhancements of 35- and 12.5-fold, respectively. In contrast, the presence of OII leads to a mildly antagonistic effect on the adsorption of MB and Pb2+. These findings show that the adsorption of anionic dyes by graphene-based materials can be strongly improved in the presence of either cationic dyes or heavy metal ions, which will be of great value in practical applications.
1. Introduction
The shortage of fresh and clean water has become one of the most important challenges around the world, with serious water pollution arising from the rapid development of industry endangering human health.1,2 Among water pollutants, organic dyes and heavy metal ions have attracted great attention because they are non-biodegradable and tend to accumulate in living organisms.3 Various technologies have been developed for the removal of these dyes and metal ions from wastewater, including membrane separation,4 ion exchange,5 chemical precipitation6 and adsorption. Of all these technologies proposed, adsorption is considered as a globally acclaimed water treatment process due to its versatility, economic feasibility and wide applicability.3 In the last 70 years,7 many adsorbents have been investigated, such as activated carbon,8,9 magnetic carbon,10,11 chitosan,12,13 clay,14 ethyl cellulose15 and so on.As newly developed types of carbon materials, very recently graphene and its derivatives have been considered as effective adsorbents, due to their unique physical and chemical properties, such as superior mechanical flexibility, ultrahigh specific surface area, and abundant surface functionality with oxygen-containing functional groups.16–18 The adsorption behaviors of graphene-based materials, such as graphene oxide (GO) and reduced graphene oxide (RGO), for different contaminants have been studied, where they usually showed outstanding adsorption capacities. For example, the adsorption capacity of polypyrrole–RGO hybrid material for Hg2+ has been reported to reach 980 mg g−1.19 Obtained by in situ reduction of GO with sodium hydrosulfite, RGO provides a maximum adsorption capacity of 3300 mg g−1 for acridine orange dye.20 In particular, graphene-based materials are now available commercially in high production volume.21,22 These materials exhibited comparable or better adsorption capacities than commercial activated carbon in some conditions.23–26 Consequently, they can serve as alternative adsorbents for removing contaminants from sewage water. However, so far the investigations of adsorption behaviors of contaminants by graphene-based materials have generally been performed in single-component systems.27,28 While in practical applications of wastewater treatment, several kinds of contaminants often coexist as pollutants. In such cases, investigating the co-adsorption behaviors of adsorbents for coexisting contaminants is of vital importance for selecting and utilizing these graphene-based materials.
To our knowledge, only a few works have been focused on the co-adsorption of dyes and heavy metal ions29–31 by GO and its hybrid materials, where the adsorption behaviors and mechanisms are still controversial. Xiao and coworkers have reported that the presence of anionic indigo carmine lowered the removal ability of cationic neutral red by L-cysteine-reduced graphene oxide (CRG),32 while there emerged a remarkable synergistic effect when adsorbing onto CRG/poly(vinyl alcohol) aerogel.33 For metal ion-dye binary systems, the adsorption behaviors are more noteworthy. Deng et al. found that the adsorption capacity of Cd2+ onto magnetic GO was suppressed with increasing methylene blue (MB) initial concentration.34 While Liu and coworkers reported that the presence of MB in water promoted the adsorption of Pb2+ on montmorillonite-pillared GO.35 Furthermore, the Kang group determined that the adsorption capacity of Cr6+ onto magnetite (Fe3O4)/non-oxidative graphene was not affected by increasing of MB concentration.36 That is, for different adsorbents or co-adsorbates, the presence of MB may lead to completely different effects. Therefore, it is necessary to investigate the adsorption behaviors of contaminants with different adsorbents and co-adsorbates under identical conditions to compare their capacities. These results will be of vital importance for the optimization of adsorption capacities and practical applications.
In this work, we employed commercial GO and photoreduced GO (PRGO) as the adsorbents to evaluate the adsorption of dyes and metal ions in single and binary systems by batch experiments. The anionic dye orange II (OII) and cationic dye MB, and Pb2+ were chosen as model dyes and heavy metal ion, respectively, owing to their wide use in leather dyeing and battery manufacturing processes. An environmentally friendly and cost-free method was used to produce PRGO, which was prepared by exposing GO dispersion to solar light irradiation in sealed glasses with different duration times. GO and PRGO were characterized by Fourier transform infrared (FTIR) spectroscopy, Raman spectroscopy, X-ray diffraction (XRD), X-ray photoelectron spectroscopy (XPS), atomic force microscopy (AFM), scanning electron microscopy (SEM), and transmission electron microscopy (TEM). The adsorption isotherms of GO and PRGO for OII, MB, and Pb2+ in single-component systems, as well as in OII-MB and OII-Pb2+ binary systems have been investigated. The results revealed that the adsorption capacities of OII are remarkably enhanced in the presence of MB and Pb2+, while those of MB and Pb2+ are suppressed in the presence of OII. Also, the main adsorption mechanism through relevant models has been discussed.
2. Materials and methods
2.1 Materials
GO powder (diameter of 0.5–5 μm and thickness of 1–3 nm) was supplied by Nanjing XFNANO Materials Tech Co. Ltd. OII, MB and lead nitrate (Pb(NO3)2) were purchased from J&K Scientific Ltd. 0.22 μm Millipore syringe filters were obtained from Tianjin Navigator Lab Instrument Co. Ltd. An Elix® Advantage system (Millipore Q, USA) was used to produce deionized water. All regents were used without further purification.2.2 Preparation of PRGO
In our previous work,37 we presented an environmentally friendly and cost-free method to prepare PRGO dispersion. The reduction of GO was carried out by exposing 0.67 mg mL−1 dispersion to solar light with duration times of each of 24, 48, and 72 hours. In order to maintain the same reduction conditions, the experiments were performed at the same weather temperature (generally from 10 a.m. to 4 p.m. between June and September) and atmospheric environment (cloudless). Initial pH value of the dispersion was measured to be 5.0 ± 0.3 and no significant change was observed after photoreduction. The PRGO obtained with these three irradiation durations are named hereinafter as PRGO-1, PRGO-2, and PRGO-3, respectively.2.3 Sample characterizations
The concentrations of dyes were determined using a UV-visible spectrometer (Ocean Optics May2000Pro). The chemical structure and elemental composition of GO and PRGO were characterized by means of FTIR and Raman spectroscopies, XRD, and XPS. FTIR spectra were recorded on a Si substrate with a commercial Bruker FTIR spectrometer (Thermo Scientific Nicolet iS50). Raman spectra were obtained with a home-built scanning confocal system, the details of which can be found in our previous works.37,38 XRD measurements were performed by use of a Rigaku BD 2000 system with Cu Kα X-rays (0.154 nm) operating at 30 kV and 20 mA. XPS analysis was conducted using an AXIS ULTRA DLD spectrometer (Thermo Kratos British) with Al Kα irradiation as the exciting source (300 W). AFM (5000N, JEOL) was used to measure the height of GO and PRGO. The surface morphology of nanomaterials was observed using SEM (SU8010, Hitachi) and TEM (Philips model CM10).2.4 Batch adsorption experiments
 | (1) |
3. Results and discussion
3.1 Characterizations of GO and PRGO
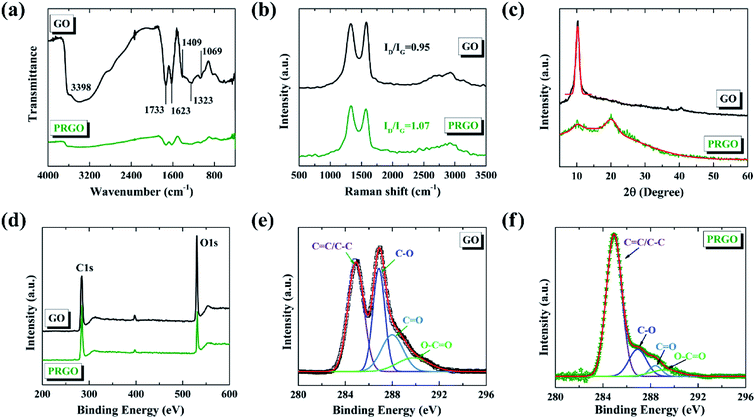
The chemical components of GO before and after solar light irradiation were investigated by FTIR and Raman spectroscopies and XRD. Fig. 1a presents the FTIR spectra of GO and PRGO with irradiation duration of 72 hours. For original GO, the strong and broad band centered at 3398 cm−1 is attributed to the vibration mode of O–H bond (hydroxyl). The peaks at 1733, 1623, and 1069 cm−1 correspond to the stretching vibrations of C![[double bond, length as m-dash]](https://www.rsc.org/images/entities/char_e001.gif) O (carbonyl and carboxyl), C
O (carbonyl and carboxyl), C![[double bond, length as m-dash]](https://www.rsc.org/images/entities/char_e001.gif) C, and C–O (alkoxy) bonds, respectively. The bands at 1409 cm−1 and 1323 cm−1 are assigned to the bending vibration of C–OH group as well as C–O–C asymmetric stretching vibration of epoxy group. The presence of these functional groups is consistent with previous reports.37,39 For PRGO, the intensities of bands corresponding to O–H, C
C, and C–O (alkoxy) bonds, respectively. The bands at 1409 cm−1 and 1323 cm−1 are assigned to the bending vibration of C–OH group as well as C–O–C asymmetric stretching vibration of epoxy group. The presence of these functional groups is consistent with previous reports.37,39 For PRGO, the intensities of bands corresponding to O–H, C![[double bond, length as m-dash]](https://www.rsc.org/images/entities/char_e001.gif) O, and C
O, and C![[double bond, length as m-dash]](https://www.rsc.org/images/entities/char_e001.gif) C bonds are much weaker compared with those of GO, and the other bands are even absent. These results indicate that many oxygen-containing functional groups are successfully removed via solar light irradiation. Fig. 1b displays the Raman spectra of GO and PRGO. Two prominent peaks can be clearly determined, which correspond to D and G bands, respectively. No obvious shifts of the two bands before and after solar light irradiation are determined; however, the increased ID/IG ratio from 0.95 for GO to 1.07 for PRGO indicates the decreased sizes but the increased numbers of sp2 frameworks.40 The XRD patterns of GO and PRGO are shown in Fig. 1c. GO exhibits a sharp peak at 10.24°, corresponding to an interlayer separation of 0.863 nm. For PRGO, this peak almost disappears whereas a broad and weak peak at 20.20° becomes prominent. The new peak corresponds to an interlayer spacing of 0.439 nm. The significant reduction of the interlayer spacing further indicates the removal of oxygen-containing functional groups.41
C bonds are much weaker compared with those of GO, and the other bands are even absent. These results indicate that many oxygen-containing functional groups are successfully removed via solar light irradiation. Fig. 1b displays the Raman spectra of GO and PRGO. Two prominent peaks can be clearly determined, which correspond to D and G bands, respectively. No obvious shifts of the two bands before and after solar light irradiation are determined; however, the increased ID/IG ratio from 0.95 for GO to 1.07 for PRGO indicates the decreased sizes but the increased numbers of sp2 frameworks.40 The XRD patterns of GO and PRGO are shown in Fig. 1c. GO exhibits a sharp peak at 10.24°, corresponding to an interlayer separation of 0.863 nm. For PRGO, this peak almost disappears whereas a broad and weak peak at 20.20° becomes prominent. The new peak corresponds to an interlayer spacing of 0.439 nm. The significant reduction of the interlayer spacing further indicates the removal of oxygen-containing functional groups.41
Here, we also used XPS to qualify the degree of photoreduction. The C/O ratio can be determined from the atomic percentage by the survey XPS spectra,42 as shown in Fig. 1d. The C/O ratio of GO before and after solar light irradiation increases from 2.47 to 6.79, further revealing the removal of oxygen-containing functional groups from GO. Fig. 1e and f present the C1s deconvolution spectra of GO and PRGO, respectively. Both spectra can be curve-fitted into four peaks. The binding energies of the fitted peaks are about 284.9, 286.9, 288.4, and 289.4 eV, corresponding to C![[double bond, length as m-dash]](https://www.rsc.org/images/entities/char_e001.gif) C/C–C, C–O (hydroxyl and epoxy), C
C/C–C, C–O (hydroxyl and epoxy), C![[double bond, length as m-dash]](https://www.rsc.org/images/entities/char_e001.gif) O (carbonyl), and O
O (carbonyl), and O![[double bond, length as m-dash]](https://www.rsc.org/images/entities/char_e001.gif) C–O (carboxyl) species.43 Compared with GO, the oxygen-bound C components in PRGO, especially the peak of C–O, are decreased sharply in intensity. This further confirms that most of the oxygen functional groups have been removed by solar light irradiation.
C–O (carboxyl) species.43 Compared with GO, the oxygen-bound C components in PRGO, especially the peak of C–O, are decreased sharply in intensity. This further confirms that most of the oxygen functional groups have been removed by solar light irradiation.
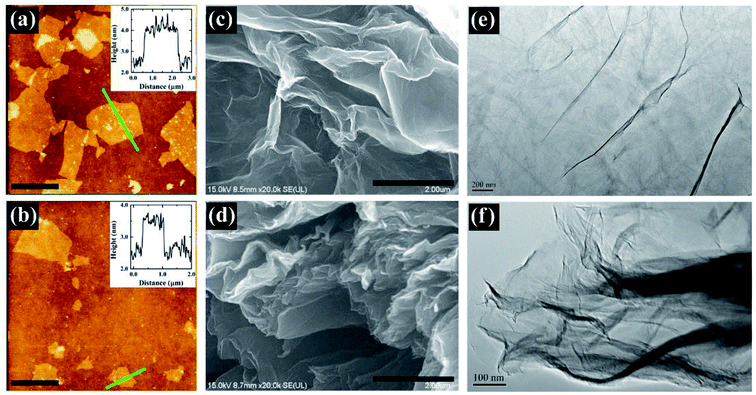
The surface morphologies of GO before and after solar light irradiation were characterized by AFM, SEM, and TEM, as shown in Fig. 2. It can be seen that GO nano-sheets are exfoliated into monolayers with lateral size in the region of 2–4 μm and height of ∼1.5 nm (Fig. 2a), coinciding with previous works.37,44 After solar light irradiation, the lateral size of nano-sheets slightly decreased. As shown in Fig. 2b, the height of PRGO was decreased to ∼1.0 nm, indicating the effective removal of functional groups on the basal plane of GO. Fig. 2c–f present the SEM and TEM images of GO and PRGO. GO presents a single- or a few-layer microstructure with wrinkles on the surface, which may be due to large amounts of functional groups.45,46 These groups expand the interlayer distance of graphite and result in the wrinkle phenomenon, in accordance with the XRD results. However, PRGO presents a different morphology as fluffy and transparent layers with rich wrinkles and fluctuation.45 The fluctuation may be essential to sustain the thermodynamics stability of two-dimensional natural crystal structure of graphene sheets. These disordered reduced graphene sheets could connect as a three-dimensional porous network, which will improve the adsorption of contaminants. This hypothesis can be proven by the measurement of surface areas using the BET technique (Fig. S4†), where the surface area of PRGO (62.8 m2 g−1) is higher than that of GO (20.2 m2 g−1). Furthermore, energy dispersive X-ray spectroscopy (EDS) was also performed to analyze the chemical components of GO and PRGO, as shown in Fig. S5.† From the analysis, we can find that the main elements on the prepared samples are C and O. The significant decrease of O element further reveals the removal of oxygen functional groups. Note that the atomic percentage of C/O ratio increasing from 1.58 to 5.16 agrees reasonably well with the analysis from the survey XPS spectra.
3.2 Adsorption kinetics and isotherms in single-component system
 | ||
| Fig. 3 Adsorption kinetics of GO and PRGO-1, -2, and -3 for (a) OII, (b) MB, and (c) Pb2+. The solid lines are the pseudo-second-order model simulations. | ||
The pseudo-second-order model is generally used to depict the chemisorption process with a rate-limiting step,47 which can be represented as the equation:
 | (2) |
| V0 = k2qe2 | (3) |
The results are presented in Table 1. The linear correlation coefficients (R2) for these adsorption conditions are between 0.991 and 0.999, indicating that the experimental data are in good agreement with the pseudo-second-order model. The adsorption rates of GO and PRGO for MB and Pb2+ are significantly higher than those for OII. Furthermore, with increasing reduction degree, the adsorption rate of MB is slightly decreased and that of OII is clearly increased, while the adsorption rate of Pb2+ shows negligible change.
| GO | PRGO-1 | PRGO-2 | PRGO-3 | ||
|---|---|---|---|---|---|
| OII | qe (mg g−1) | 4.87 | 15.0 | 21.9 | 31.9 |
| k2 (g (mg min)−1) | 0.05 | 0.29 | 0.35 | 0.40 | |
| V0 (mg (g min)−1) | 0.24 | 4.3 | 7.8 | 12.9 | |
| R2 | 0.998 | 0.999 | 0.999 | 0.999 | |
| MB | qe (mg g−1) | 149 | 148 | 148 | 149 |
| k2 (g (mg min)−1) | 6.9 | 3.6 | 4.7 | 3.3 | |
| V0 (mg (g min)−1) | 1024 | 537 | 847 | 505 | |
| R2 | 0.991 | 0.994 | 0.996 | 0.993 | |
| Pb2+ | qe (mg g−1) | 290 | 296 | 293 | 294 |
| k2 (g (mg min)−1) | 4.9 | 4.5 | 3.9 | 4.1 | |
| V0 (mg (g min)−1) | 1425 | 1446 | 1161 | 1198 | |
| R2 | 0.995 | 0.993 | 0.997 | 0.992 | |
 | (4) |
 | ||
| Fig. 4 Adsorption isotherms of GO and PRGO-1, -2, and -3 for (a) OII, (b) MB, and (c) Pb2+. The solid lines are the Langmuir model simulations. | ||
| GO | PRGO-1 | PRGO-2 | PRGO-3 | ||
|---|---|---|---|---|---|
| OII | qmax (mg g−1) | 8.4 | 16.8 | 22.6 | 32.5 |
| KL (L mg−1) | 7.5 × 10⁻² | 1.1 × 10⁻¹ | 1.3 × 10⁻¹ | 2.1 × 10⁻¹ | |
| R2 | 0.971 | 0.975 | 0.965 | 0.982 | |
| MB | qmax (mg g−1) | 429 | 415 | 380 | 386 |
| KL (L mg−1) | 0.28 | 0.26 | 0.27 | 0.23 | |
| R2 | 0.988 | 0.993 | 0.997 | 0.993 | |
| Pb2+ | qmax (mg g−1) | 431 | 459 | 444 | 446 |
| KL (L mg−1) | 0.5 × 10⁻¹ | 4.2 × 10⁻¹ | 4.0 × 10⁻¹ | 4.3 × 10⁻¹ | |
| R2 | 0.995 | 0.980 | 0.985 | 0.979 | |
3.3 Co-adsorption investigations of OII-MB binary system
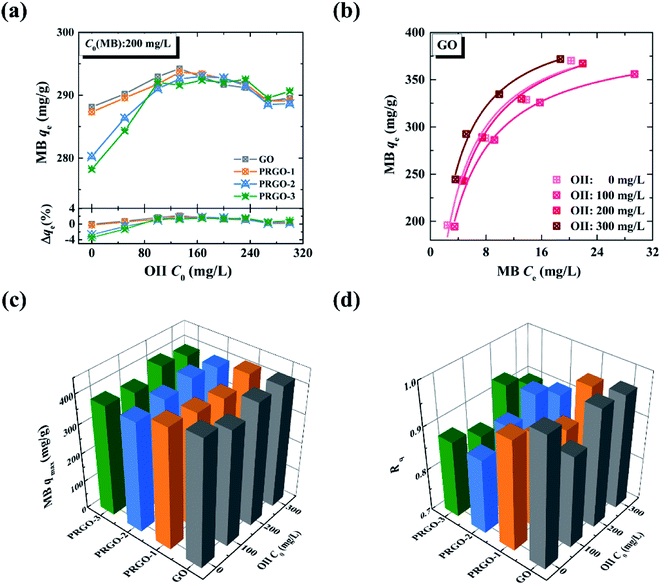
Co-adsorption investigations of the OII-MB binary system have been classified into two categories: the adsorption isotherm of MB in the presence of OII, and the adsorption isotherm of OII in the presence of MB. These two categories are designated in the forms of MB/OII and OII/MB for short, as discussed in Section 2.4.2.On the other hand, to compare the maximum adsorption capacities of MB in the absence/presence of OII, we also obtained the adsorption isotherms of MB under different OII concentrations, as shown in Fig. 5b. Note that the adsorption isotherms of MB in the presence of OII (100, 200, and 300 mg L−1) are similar to that in the absence of OII (0 mg L−1); thus they are also analyzed by the Langmuir model. The maximum adsorption capacities are shown in Fig. 5c (the corresponding fitted results can be found in Fig. S7 and Table S3†). At a glance, the maximum adsorption capacities of MB on GO and PRGO in the absence and presence of OII have no significant difference, and they are all around 400 mg g−1.
To gain an insight into the co-adsorption behaviors, the ratio of adsorption capacity Rq is often used:29,36
 | (5) |
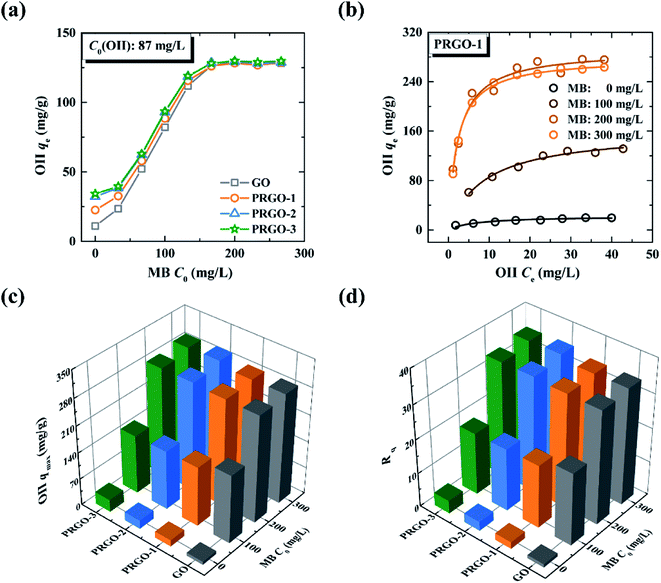
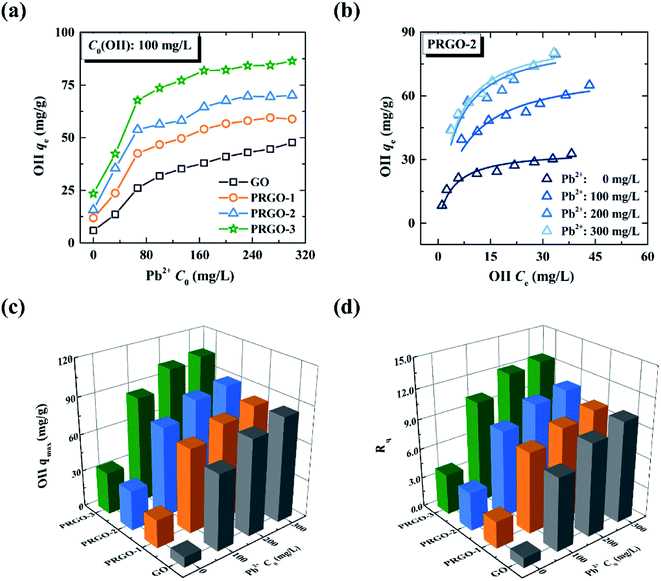
The maximum adsorption capacities of OII on GO and PRGO in the presence of MB, and the corresponding ratios Rq are shown in Fig. 6c and d, respectively (the maximum adsorption capacities were determined by the Langmuir model, and the detailed fitted results can be found in Tables S5 and S6†). For GO, Rq is 34.3 when the MB concentration is 300 mg L−1, indicating that a remarkable synergistic effect is observed for the removal of OII by GO in the presence of MB. This yields an exceptionally high adsorption capacity of OII. On the other hand, in the presence of MB, Rq of PRGO is almost the same as that of GO. This result hints that the promoting effect for OII by the reduction process can be ignored, comparing with the synergistic effect from simultaneous adsorption of MB.
3.4 Co-adsorption investigations of OII-Pb2+ binary system
3.5 Adsorption mechanisms
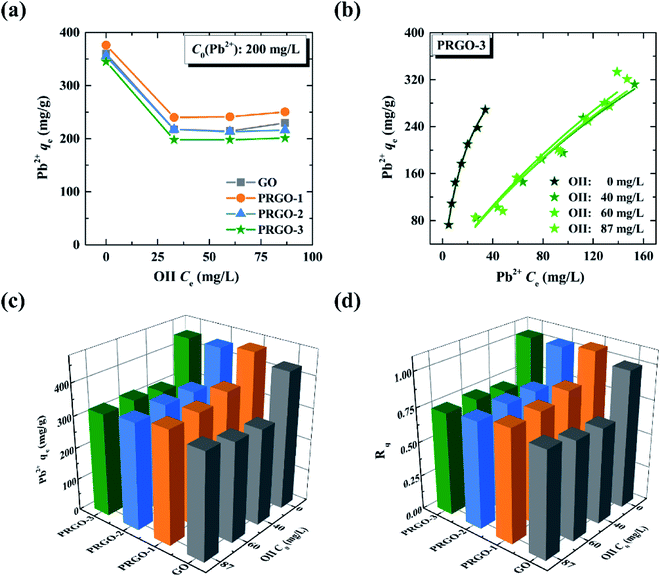
Based on the adsorption investigations of ionic dyes and heavy metal ion onto GO and PRGO in single-component and binary systems, we can find that the reduction of GO can improve the adsorption capacity of anionic OII dye, while it has a negligible effect for both cationic MB and positively charged Pb2+. More importantly, the presence of both MB and Pb2+ can strongly enhance the adsorption of OII (synergistic effect), while the presence of OII inhibits the adsorption of MB and Pb2+ (antagonistic effect). According to previous work,35 MB mildly enhanced the adsorption of Pb2+, while the presence of Pb2+ will suppress the adsorption of MB. These phenomena can be understood from two aspects: the effect of the reduction process and the presence of co-adsorbent.Generally, the adsorption mechanisms of contaminants on graphene-based materials can be considered from two aspects: the electrostatic interaction between the contaminants and the oxygen-containing functional groups of graphene-based materials, as well as the π–π interaction between the aromatic structure of the dyes and the π-conjugation frameworks of graphene sheets.32,51,52 Meanwhile, original GO is highly negatively charged, resulting from the abundant oxygen-containing functional groups on its basal plane. While the negative charge of PRGO will be less, due to the removal of functional groups by photoreduction.53,54 Therefore, GO has extremely low adsorption capacity for anionic OII dye, due to the strong electrostatic repulsion interaction between negative GO and anionic OII. This repulsion will become weak after photoreduction. Thus, the adsorption capacity of anionic OII gradually enhances, during GO conversion into PRGO by photoreduction. For MB, both π–π interaction and electrostatic interaction will contribute to its adsorption capacity. For GO, the electrostatic interaction may dominate the adsorption process, due to the highly negatively charged GO and positively charged MB. For PRGO, the π–π interaction may be predominant, due to the restoration of π-conjugation frameworks during photoreduction.37 Consequently, a competition between these two interactions occurs, resulting in a negligible effect of the reduction process. This interpretation is appropriate for the adsorption of Pb2+ as well, where the main adsorption mechanisms between Pb2+ and graphene-based materials are electrostatic interaction and cation–π interaction.55,56 Thus, the adsorption capacities for both MB and Pb2+ present no obvious change from GO to PRGO.
In the MB/OII binary system, OII will occupy some adsorption sites through π–π interaction, which will inhibit the adsorption of MB. However, comparing with the adsorption capacity of MB on GO of 429 mg g−1, that of OII is only 8.4 mg g−1. Thus the presence of OII leads to a mildly antagonistic effect on the adsorption of MB. In contrast, in the OII/MB binary system, the presence of MB remarkably enhances the adsorption of OII, because the electronegativity of GO after adsorption of MB is significantly decreased. The decrease of the repulsion interaction between OII and GO will remarkably enhance the adsorption of OII. It can also explain the synergistic effect of OII in the presence of Pb2+. On the other hand, the π–π interaction between OII and GO will suppress the cation–π interaction between Pb2+ and π-conjugation frameworks of graphene-based materials, and thus the presence of OII shows an antagonistic effect on Pb2+.
4. Conclusion
In order to simultaneously remove anionic and cationic dyes as well as heavy metal ions from wastewater, GO and its reduced counterpart PRGO were prepared, where PRGO was synthesized by a green and cost-free method based on the solar light irradiation of GO suspensions. FTIR, Raman, XRD, XPS, AFM, SEM, and TEM studies show that the oxygen-containing functional groups had been successfully removed from PRGO. Compared with the original GO, the adsorption capacity of OII on PRGO is improved by 4 times in a single-component system, while that of MB and Pb2+ show negligible change. In a binary system, a remarkable synergistic effect has been determined for the adsorption of anionic OII dye, in the presence of either cationic MB or positively charged Pb2+. The enhancement reached 34.3- and 12.5-fold, respectively. This synergistic effect may result from the decrease of the electronegativity of GO. On the other hand, in the presence of OII, the adsorption capacity of neither MB nor Pb2+ is suppressed. The antagonistic effect originates from the occupation of adsorption sites by OII through π–π interaction, where MB will adsorb on GO or PRGO by π–π interaction, and Pb2+ will adsorb through cation–π interaction. Consequently, the maximum adsorption capacity of OII by PRGO has reached 296 mg g−1 in this work, which is comparable to the adsorption by activated carbon previously reported.57,58 Hence, we provide a new insight for the treatment of anionic dyes and the removal of coexisting contaminants in polluted wastewater by GO and PRGO, which can be considered as alternative adsorbents to conventional carbon-based adsorbents for removing contaminants from wastewater.Conflicts of interest
The authors declare no competing financial interest.Acknowledgements
The project is sponsored by the National Key Research and Development Program of China (grant no. 2017YFA0304203), National Natural Science Foundation of China (grant no. 11434007), Natural Science Foundation of China (no. 61875109, 61527824, U1510133, 61675119, 11504216, and 61605104), PCSIRT (no. IRT_17R70), 1331KSC and 111 project (grant no. D18001).References
- I. Ali, Chem. Rev., 2012, 112, 5073–5091 CrossRef CAS PubMed.
- J. Eliasson, Nature, 2015, 517, 6 CrossRef CAS PubMed.
- M. Yusuf, F. M. Elfghi, S. A. Zaidi, E. C. Abdullah and M. A. Khan, RSC Adv., 2015, 5, 50392–50420 RSC.
- M. R. S. Kebria, M. Jahanshahi and A. Rahimpour, Desalination, 2015, 367, 255–264 CrossRef CAS.
- J. Labanda, J. Sabaté and J. Llorens, J. Membr. Sci., 2009, 340, 234–240 CrossRef CAS.
- G. C. Silva, V. S. T. Ciminelli, A. M. Ferreira, N. C. Pissolati, P. R. P. Paiva and J. L. López, Mater. Res. Bull., 2014, 49, 544–551 CrossRef CAS.
- İ. Duru, D. Ege and A. R. Kamali, J. Mater. Sci., 2016, 51, 6097–6116 CrossRef.
- M. Jafari, M. R. Rahimi, M. Ghaedi and K. Dashtian, Chem. Eng. Res. Des., 2017, 125, 408–421 CrossRef CAS.
- A. A. Oladipo and M. Gazi, J. Taiwan Inst. Chem. Eng., 2015, 47, 125–136 CrossRef CAS.
- B. Qiu, H. Gu, X. Yan, J. Guo, Y. Wang, D. Sun, Q. Wang, M. Khan, X. Zhang, B. L. Weeks, D. P. Young, Z. Guo and S. Wei, J. Mater. Chem. A, 2014, 2, 17454–17462 RSC.
- B. Qiu, Y. Wang, D. Sun, Q. Wang, X. Zhang, B. L. Weeks, R. O'Connor, X. Huang, S. Wei and Z. Guo, J. Mater. Chem. A, 2015, 3, 9817–9825 RSC.
- G. Z. Kyzas, P. I. Siafaka, E. G. Pavlidou, K. J. Chrissafis and D. N. Bikiaris, Chem. Eng. J., 2015, 259, 438–448 CrossRef CAS.
- H. C. Yang, J. L. Gong, G. M. Zeng, P. Zhang, J. Zhang, H. Y. Liu and S. Y. Huan, J. Colloid Interface Sci., 2017, 505, 67–78 CrossRef CAS PubMed.
- V. Vimonses, S. Lei, B. Jin, C. W. K. Chow and C. Saint, Chem. Eng. J., 2009, 148, 354–364 CrossRef CAS.
- K. Liu, L. Zhang, T. Cao, C. Jin, D. Qiu, Q. Zhou, A. Zettl, P. Yang, S. G. Louie and F. Wang, Nat. Commun., 2014, 5, 4966 CrossRef CAS PubMed.
- G. Ersan, O. G. Apul, F. Perreault and T. Karanfil, Water Res., 2017, 126, 385–398 CrossRef CAS PubMed.
- W. Peng, H. Li, Y. Liu and S. Song, J. Mol. Liq., 2017, 230, 496–504 CrossRef CAS.
- I. Khurana, A. Saxena, Bharti, J. M. Khurana and P. K. Rai, Water, Air, Soil Pollut., 2017, 228, 180 CrossRef.
- V. Chandra and K. S. Kim, Chem. Commun., 2011, 47, 3942–3944 RSC.
- L. Sun, H. Yu and B. Fugetsu, J. Hazard. Mater., 2012, 203–204, 101–110 CrossRef CAS PubMed.
- Y. Zhu, H. Ji, H.-M. Cheng and R. S. Ruoff, Natl. Sci. Rev., 2018, 5, 90–101 CrossRef.
- W. Ren and H. M. Cheng, Nat. Nanotechnol., 2014, 9, 726–730 CrossRef CAS PubMed.
- O. G. Apul, Q. Wang, Y. Zhou and T. Karanfil, Water Res., 2013, 47, 1648–1654 CrossRef CAS PubMed.
- N. Cai and P. Larese-Casanova, J. Colloid Interface Sci., 2014, 426, 152–161 CrossRef CAS PubMed.
- S. Chang, C. Lu and K.-Y. A. Lin, Appl. Surf. Sci., 2015, 326, 187–194 CrossRef CAS.
- F. Wang, X. Lu, W. Peng, Y. Deng, T. Zhang, Y. Hu and X.-y. Li, ACS Omega, 2017, 2, 5378–5384 CrossRef CAS.
- L. Chen, Y. Li, Q. Du, Z. Wang, Y. Xia, E. Yedinak, J. Lou and L. Ci, Carbohydr. Polym., 2017, 155, 345–353 CrossRef CAS PubMed.
- Z. Y. Sui, Y. Cui, J. H. Zhu and B. H. Han, ACS Appl. Mater. Interfaces, 2013, 5, 9172–9179 CrossRef CAS PubMed.
- Q. Kong, C. Wei, S. Preis, Y. Hu and F. Wang, Environ. Sci. Pollut. Res. Int., 2018, 25, 21164–21175 CrossRef CAS PubMed.
- M. Lv, L. Yan, C. Liu, C. Su, Q. Zhou, X. Zhang, Y. Lan, Y. Zheng, L. Lai, X. Liu and Z. Ye, Chem. Eng. J., 2018, 349, 791–799 CrossRef CAS.
- J. Xiao, J. Zhang, W. Lv, Y. Song and Q. Zheng, Carbon, 2017, 123, 354–363 CrossRef CAS.
- J. Xiao, W. Lv, Z. Xie, Y. Tan, Y. Song and Q. Zheng, J. Mater. Chem. A, 2016, 4, 12126–12135 RSC.
- J. Xiao, W. Lv, Z. Xie, Y. Song and Q. Zheng, J. Mater. Sci., 2017, 52, 5807–5821 CrossRef CAS.
- J.-H. Deng, X.-R. Zhang, G.-M. Zeng, J.-L. Gong, Q.-Y. Niu and J. Liang, Chem. Eng. J., 2013, 226, 189–200 CrossRef CAS.
- L. Liu, Y. Zhang, Y. He, Y. Xie, L. Huang, S. Tan and X. Cai, RSC Adv., 2015, 5, 3965–3973 RSC.
- M. Zheng, Y. Ahn, Y. Yoon, W. K. Park, Y. Jung, M. Kwon, W. S. Yang and J.-W. Kang, Sep. Sci. Technol., 2016, 51, 2958–2969 CrossRef CAS.
- Y. Gong, C. Qin, W. He, Z. Qiao, G. Zhang, R. Chen, Y. Gao, L. Xiao and S. Jia, RSC Adv., 2017, 7, 53362–53372 RSC.
- W. He, C. Qin, Z. Qiao, G. Zhang, L. Xiao and S. Jia, Carbon, 2016, 109, 264–268 CrossRef CAS.
- V. Le Borgne, H. Bazi, T. Hayashi, Y. A. Kim, M. Endo and M. A. El Khakani, Carbon, 2014, 77, 857–867 CrossRef CAS.
- H. Feng, R. Cheng, X. Zhao, X. Duan and J. Li, Nat. Commun., 2013, 4, 1539 CrossRef PubMed.
- Z. Bo, X. Shuai, S. Mao, H. Yang, J. Qian, J. Chen, J. Yan and K. Cen, Sci. Rep., 2014, 4, 4684 CrossRef PubMed.
- J. Chen, B. Yao, C. Li and G. Shi, Carbon, 2013, 64, 225–229 CrossRef CAS.
- Q. Zhang, H. Zheng, Z. Geng, S. Jiang, J. Ge, K. Fan, S. Duan, Y. Chen, X. Wang and Y. Luo, J. Am. Chem. Soc., 2013, 135, 12468–12474 CrossRef CAS PubMed.
- Y. Gao, C. Qin, Z. Qiao, B. Wang, W. Li, G. Zhang, R. Chen, L. Xiao and S. Jia, Carbon, 2015, 93, 843–850 CrossRef CAS.
- Y. Gong, D. Li, Q. Fu and C. Pan, Prog. Nat. Sci., 2015, 25, 379–385 CrossRef CAS.
- A. Navaee and A. Salimi, RSC Adv., 2015, 5, 59874–59880 RSC.
- Y. Qi, M. Yang, W. Xu, S. He and Y. Men, J. Colloid Interface Sci., 2017, 486, 84–96 CrossRef CAS PubMed.
- J. N. Tiwari, K. Mahesh, N. H. Le, K. C. Kemp, R. Timilsina, R. N. Tiwari and K. S. Kim, Carbon, 2013, 56, 173–182 CrossRef CAS.
- M. Heidarizad and S. S. Şengör, J. Mol. Liq., 2016, 224, 607–617 CrossRef CAS.
- Y. Wang, Y. Xie, Y. Zhang, S. Tang, C. Guo, J. Wu and R. Lau, Chem. Eng. J., 2016, 114, 258–267 CAS.
- S. Bai, X. Shen, X. Zhong, Y. Liu, G. Zhu, X. Xu and K. Chen, Carbon, 2012, 50, 2337–2346 CrossRef CAS.
- R. Yu, Y. Shi, D. Yang, Y. Liu, J. Qu and Z. Z. Yu, ACS Appl. Mater. Interfaces, 2017, 9, 21809–21819 CrossRef CAS PubMed.
- H. Yuan, E. Debroye, G. Caliandro, K. P. Janssen, J. van Loon, C. E. Kirschhock, J. A. Martens, J. Hofkens and M. B. Roeffaers, ACS Omega, 2016, 1, 148–159 CrossRef CAS PubMed.
- M. J. Li, C. M. Liu, H. B. Cao and Y. Zhang, Adv. Mater. Res., 2013, 716, 127–131 Search PubMed.
- N. Pan, L. Li, J. Ding, S. Li, R. Wang, Y. Jin, X. Wang and C. Xia, J. Hazard. Mater., 2016, 309, 107–115 CrossRef CAS PubMed.
- J. P. Gallivan and D. A. Dougherty, J. Am. Chem. Soc., 2000, 122, 870–874 CrossRef CAS.
- M. Kousha, E. Daneshvar, M. S. Sohrabi, M. Jokar and A. Bhatnagar, Chem. Eng. J., 2012, 192, 67–76 CrossRef CAS.
- E. R. Garcia, R. L. Medina, M. M. Lozano, I. Hernandez Perez, M. J. Valero and A. M. M. Franco, Materials, 2014, 7, 8037–8057 CrossRef PubMed.
Footnote |
| † Electronic supplementary information (ESI) available: Batch adsorption experiments in single-component and binary systems, absorption spectra of OII and MB in single-component solute as well as that of OII/MB in binary solute, BET measurements of GO and PRGO, Freundlich and Temkin model simulations for OII, MB, and Pb2+ in single-component system and corresponding fitted parameters, Langmuir model simulation for MB/OII, OII/MB, OII/Pb2+, and Pb2+/OII binary systems and corresponding fitted parameters. See DOI: 10.1039/c8ra09438a |
| This journal is © The Royal Society of Chemistry 2019 |

