 Open Access Article
Bacterial community mapping of the intestinal tract in acute pancreatitis rats based on 16S rDNA gene sequence analysis†
Xufeng
Tao
a,
Fangyue
Guo
b,
Qi
Zhou
b,
Fenglin
Hu
b,
Hong
Xiang
 *c,
Gary Guishan
Xiao
*a and
Dong
Shang
*bd
aSchool of Pharmaceutical Science and Technology, Dalian University of Technology, Dalian, China. E-mail: gxiao@dlut.edu.cn
bInstitute (College) of Integrative Medicine, Dalian Medical University, Dalian 116011, China. E-mail: shangdong@dmu.edu.cn; Fax: +86-411-83622844; Tel: +86-411-83635963
cClinical Laboratory of Integrative Medicine, The First Affiliated Hospital of Dalian Medical University, Dalian 116011, China. E-mail: xianghong0806@163.com
dDepartment of General Surgery, Pancreatico-Biliary Center, The First Affiliated Hospital of Dalian Medical University, Dalian 116011, China
First published on 11th February 2019
Abstract
Numerous studies have revealed that the status of intestinal microbiota has a marked impact on inflammation, which may progressively aggravate the systemic inflammatory response caused by acute pancreatitis (AP). However, our understanding of microbial communities in the intestinal tract is still very limited. Therefore, the aim of this paper is deciphering bacterial community changes in AP rats. In this study, samples taken from AP rats were subjected to 16S rDNA gene sequence-based analysis to examine the characteristic bacterial communities along the rat intestinal tract, including those present in the small intestine, colon and feces, with samples from rats with a sham operation (SO) as the control group. Operational taxonomic units (OTUs) network analyses displayed that the small intestine and colon of the AP rats had a “core microbiota” composed of bacteria belonging to Firmicutes, Proteobacteria and Bacteroidetes, whereas the “core microbiota” of feces included Firmicutes, Bacteroidetes, Proteobacteria, Tenericutes and Actinobacteria. Bacterial diversity analysis showed that the species richness and diversity of the small intestine, colon and feces in AP rats were lower than those in the SO rats, and species difference between the AP and SO groups were observed. In addition, at different levels of bacterial classification, dramatic alterations in the predominant intestinal microbiota were observed along intestinal tracts in AP rats compared to the SO rats. COG and KEGG analyses indicated that the significantly differential flora were involved several clusters and signaling networks. Thus, this work systematically characterizes bacterial communities from the intestinal tract of AP rats and provides substantial evidence supporting a prospective strategy to alter the intestinal microbiota improving AP.
Introduction
The adult human intestine is home to microbial communities comprised of at least 1000 bacterial resident species and up to 1014 microorganisms.1 Host–microbe interaction is crucial for host normal physiology, ranging from metabolic activity to immune homeostasis; perturbation of microbial communities is now regarded as a promoter of secondary infection and systemic inflammation in a range of diseases outside the gut, especially pancreatic disease.2–6Acute pancreatitis (AP) is an inflammatory disorder of the pancreas encountered in emergency settings with an annual incidence range of 13–45/100![[thin space (1/6-em)]](https://www.rsc.org/images/entities/char_2009.gif) 000 inhabitants.7–9 Approximately 20% of AP patients develop necrotizing pancreatitis with a high mortality risk, mostly attributed to sepsis and infection of pancreatic and peripancreatic necrotic tissue induced by gut-derived bacteria overgrowth and subsequent bacterial translocation.10 Recently, it has been established that disruption of gut microflora is significantly correlated with “second hit summit” involved in the progression of AP, which demonstrated that gut microbiota is a promising modulator of inflammatory cascade in AP pathophysiology.11 Recent studies indicate that inflammatory cascade in AP is dependent on damage-associated molecular patterns (DAMPs)-mediated cytokine activation (IL-1β, IL-6 and TNF-α) causing the translocation of intestinal flora into the circulation and their induction of innate immune responses in acinar cells. Watanabe, et al., have reviewed that the innate responses involve activation of responses by an innate factor, nucleotide-binding oligomerization domain 1 (NOD1), and that such NOD1 responses have a critical role in the activation/production of nuclear factor-kappa B (NF-κB) and type I interferon (IFN).12 The balance of the intestinal microbiota through the administration of probiotics has been considered to be one of the reasonable treatment option for AP with the potential benefit of lower costs and side effects.13 However, evidence from previous studies concerning the effects of probiotics is inconclusive and sometimes, even contradictory due to lack of awareness of specific strains, dosages and clinical situations. Therefore, better insight into the diversity and composition of intestinal microbiota is urgently needed to develop adequate prophylaxis and treatment strategies for AP.
000 inhabitants.7–9 Approximately 20% of AP patients develop necrotizing pancreatitis with a high mortality risk, mostly attributed to sepsis and infection of pancreatic and peripancreatic necrotic tissue induced by gut-derived bacteria overgrowth and subsequent bacterial translocation.10 Recently, it has been established that disruption of gut microflora is significantly correlated with “second hit summit” involved in the progression of AP, which demonstrated that gut microbiota is a promising modulator of inflammatory cascade in AP pathophysiology.11 Recent studies indicate that inflammatory cascade in AP is dependent on damage-associated molecular patterns (DAMPs)-mediated cytokine activation (IL-1β, IL-6 and TNF-α) causing the translocation of intestinal flora into the circulation and their induction of innate immune responses in acinar cells. Watanabe, et al., have reviewed that the innate responses involve activation of responses by an innate factor, nucleotide-binding oligomerization domain 1 (NOD1), and that such NOD1 responses have a critical role in the activation/production of nuclear factor-kappa B (NF-κB) and type I interferon (IFN).12 The balance of the intestinal microbiota through the administration of probiotics has been considered to be one of the reasonable treatment option for AP with the potential benefit of lower costs and side effects.13 However, evidence from previous studies concerning the effects of probiotics is inconclusive and sometimes, even contradictory due to lack of awareness of specific strains, dosages and clinical situations. Therefore, better insight into the diversity and composition of intestinal microbiota is urgently needed to develop adequate prophylaxis and treatment strategies for AP.
Previous studies have provided a detailed description on the characteristic of bacterial species in patients and rats with AP.14–16 In detail, the paper of Li et al., provided a detailed description on the features of bacterial species and the prevalence of bacteremia in patients with AP.14 Şenocak et al., proved that prophylactic total colectomy was associated with elevated bacterial translocation to the pancreas in AP rats.15 Zhang et al., found that the intestinal microbes of AP patients were different from those of healthy volunteers through detecting the fecal samples.16 However, these studies have several limitations: (1) they usually focused on studying the microbiota in one intestinal site of AP; (2) the microbiota in colonic mucosal sites is quite different than fecal microbial communities according to previous studies,17 however there was no enough researches about the colon microbiota; (3) the composition and functional analysis of the intestinal microbiota in AP had not been sufficiently explored. Consequently, our understanding of microbiota in different sections along with the mammalian gastrointestinal tract is still very limited, especially for rat, which is one of the most commonly used animals for studying the pathogenesis of AP.18
Because rat models used to study the dysbiosis of gut microbiota involved in the progression of AP have major advantages over clinical studies, such as the availability of study subjects, ability to perform invasive tests, and extensive tissue sampling. Deciphering the comprehensive characterization of gut microbiota in AP and normal rats is a critical prerequisite to exploring and predicting these microbiota alterations in relation to disease, and it can also lay the new foundation for the study of the pathogenesis of AP. In this study, we characterized the bacterial community mapping in the small intestine, colon and feces obtained from AP rats induced by administering 5% sodium taurocholate using a high-throughput 16S rDNA sequencing technology, which contributes to elucidate the alterations of intestinal microbiota and its role in AP progression.
Results and discussion
AP induced pancreatic injury
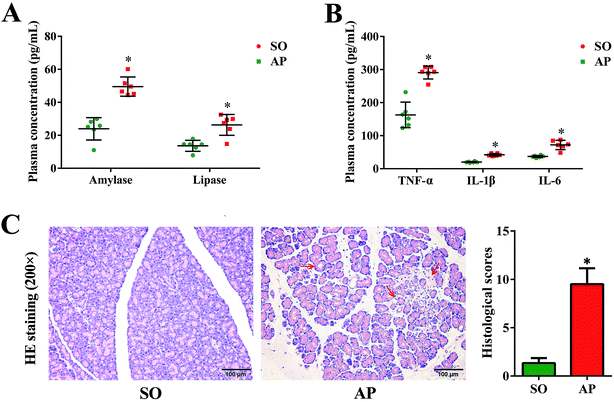
Since the first case of experimental pancreatitis established by injection of bile into the pancreatic duct of a rat, AP rat model has been indispensable in providing insight in pathophysiology and therapy of this disease. Advantages of this model are the quick procedure of AP induction and the reproducibility of results. In order to establish possible associations between the intestinal flora changes and AP pathophysiology, we had conducted the rat with AP induced by retrograde injection of 5% sodium taurocholate into the pancreatic duct in this investigation, which simulates AP due to bile reflux into the pancreas. According to the AP diagnosis and treatment guidelines, pancreatic digestive enzymes, especially amylase and lipase, are the most usually recommended as biochemical markers.19 In the present work, we detected activities of these two enzymes by enzyme-linked immunosorbent assay (ELISA). As shown in Fig. 1A, compared with the sham operation (SO) group, the increased levels of amylase and lipase in plasma were detected when AP was induced. Furthermore, inflammatory cascade activated by trypsin-mediated pancreatic autodigestion is a critical risk factor for AP. The ELISA results proved that the plasma levels of the tumor necrosis factor (TNF)-α, interleukin (IL)-1β and IL-6 in the AP group were markedly increased compared with the SO group (Fig. 1B). In addition, H&E staining was performed to observe the pathological changes of pancreatic tissue, the typical images shown none distinct pathological changes in the SO group, whereas pancreatic injury featured by large areas of interstitial edema and hemorrhage, acinar cell necrosis and vacuolization, together with leukocyte infiltration (the red arrow) in AP group (Fig. 1C). The grading was based on the number of the presence of interstitial edema, inflammation and vacuolization, and to what extent these characteristics affected the pancreas (0 being normal and 4 being severe), giving a maximum score of 12 (Table 1); and the results of histological scores indicated that the AP group (9.5 ± 1.6) was significantly increased compared with the SO group (1.3 ± 0.5). Therefore, the rat model induced by retrograde injection of 5% sodium taurocholate into the pancreatic duct can be used to evaluate possible associations between the intestinal flora changes and AP pathophysiology.| Condition | Score | Description |
|---|---|---|
| Edema | 0 | Absent |
| 1 | Diffuse expansion of interlobular septa | |
| 2 | 1 + diffuse expansion of interlobular septa | |
| 3 | 2 + diffuse expansion of interlobular septa | |
| 4 | 3 + diffuse expansion of intercellular septa | |
| Inflammation (%) | 0 | Absent |
| 1 | Around ductal margin | |
| 2 | In parenchyma (<50 of lobules) | |
| 3 | In parenchyma (51–75 of lobules) | |
| 4 | In parenchyma (>75 of lobules) | |
| Vacuolization (%) | 0 | Absent |
| 1 | Periductal (<5) | |
| 2 | Focal (5–20) | |
| 3 | Diffuse (21–50) | |
| 4 | Severe (>50) |
High-throughput 16S rDNA sequencing of the small intestine, colon and feces
Previous studies reported gut-derived bacteria overgrowth and higher intestinal colonization of Gram negative bacteria occurs in AP rat models by conventional culture techniques.20,21 However, 80% of gut bacteria are novel species that cannot be cultivated, and only 20% of intestinal microbiota can be identified using culture-based methods.22 Furthermore, although polymerase chain reaction (PCR) has been used to identification of bacterial DNA in blood samples, it fails to detect several microorganisms in a single specimen.23 Thus far, the diversity and species composition of the intestinal microbiome in rats with AP have not been sufficiently explored, not to mention the molecular mechanism of intestinal flora destruction involved in the pathogenesis of AP. In recent years, 16S rDNA gene sequence-based analysis provides a high-throughput approach to investigate the biodiversity and abundance of gut microbiota in health and disease.24 In this study, a total of 749![[thin space (1/6-em)]](https://www.rsc.org/images/entities/char_2009.gif) 142 high-quality clean tags were obtained from 36 samples (small intestine, colon and feces) in AP rats and the SO rats after quality control: removed barcode and connector sequences; combined each paired-end reads into a longer tag; removed sequences with more than one ambiguous base; and filtered chimeric sequences. Each sample was covered by an average of 20, 809 reads. The value of Q 30% of all samples averaged 94.98 ± 2.30% (mean ± SD, ranging from 83.39% to 97.10%), which indicates that the probability of a base misalignment caused by the sequencing instrument is less than 0.1% in the sequencing result (ESI Table S1†). The count of sequences with a length of less than 200 bp is 45, 917, 200–300 bp is 100, 095, 300–400 bp is 246, 016, and 400–500 bp is 357, 114, accounting for 6.13%, 13.36%, 32.84% and 47.67% of the total, respectively. Therefore, all samples met the requirements for library establishment, and they could be performed the subsequent operational taxonomic units (OTUs) analysis.
142 high-quality clean tags were obtained from 36 samples (small intestine, colon and feces) in AP rats and the SO rats after quality control: removed barcode and connector sequences; combined each paired-end reads into a longer tag; removed sequences with more than one ambiguous base; and filtered chimeric sequences. Each sample was covered by an average of 20, 809 reads. The value of Q 30% of all samples averaged 94.98 ± 2.30% (mean ± SD, ranging from 83.39% to 97.10%), which indicates that the probability of a base misalignment caused by the sequencing instrument is less than 0.1% in the sequencing result (ESI Table S1†). The count of sequences with a length of less than 200 bp is 45, 917, 200–300 bp is 100, 095, 300–400 bp is 246, 016, and 400–500 bp is 357, 114, accounting for 6.13%, 13.36%, 32.84% and 47.67% of the total, respectively. Therefore, all samples met the requirements for library establishment, and they could be performed the subsequent operational taxonomic units (OTUs) analysis.
OTUs analysis across different anatomic sites of the rat intestinal tract
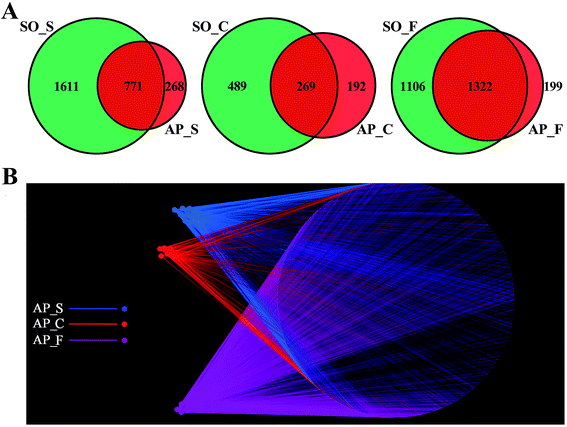
In order to facilitate the study of the species diversity information of the sample species, we clustered the effective sequences of all samples and clustered these sequences into OTUs according to 97% sequence similarity.25 At the OTU level, the similarities and differences between different samples were statistically analyzed, and the common or unique OTUs between different samples were shown through the Venn diagrams (Fig. 2A). OTU network analyses for the gut confirmed the existence of some core OTUs, a common microbial composition, among the different sections. Moreover, fecal samples shared more OTUs, both in terms of numbers and more diverse compositions, than the small intestine and colon did, and the selective pressures of unique physicochemical conditions of anatomical regions on microbiota may account for this difference, such as intestinal motility, pH, nutrient supplies and host secretions.26,27 In addition, as shown in Fig. 2B, OTUs and small intestine, colon and feces of AP rats were labeled as nodes in bipartite network. OTUs were linked with the samples, and their sequences would be found in OTU-nodes.28 The OTUs network-based analyses displayed that some core OTUs were found in the intestinal tract site collected from different individuals. Different anatomical parts shared different common “core microbiota” both in amount and compositions, which might manipulate unique functions from an intestinal tract site to other sites. The small intestine (ESI Table S2†) and colon (ESI Table S3†) of the 6 individuals had a small “core microbiota” (43 and 31 OTUs) composed of bacteria belonging to Firmicutes, Proteobacteria and Bacteroidetes, whereas the feces of them had a relatively bigger “core microbiota” (202 OTUs) comprised of bacteria belonging to Firmicutes, Bacteroidetes, Proteobacteria, Tenericutes and Actinobacteria (ESI Table S4†). These results would provide supports for the hypothesis that the unique physicochemical environments of different anatomical regions play critical roles in the forming of intestinal microbiota due to selective pressures on microbiota. Although it was not clear that whether these shared microbiota were the “permanent residents” or the “passengers” from the foods, the “core microbiota” in the different intestinal tract sites should be paid more attentions. Furthermore, the unique microbiota along the intestinal tract is expected to be the gut microbial marker in the near future.Alpha diversity analyses of the bacterial community
To characterize intestinal microbes in AP rats, bacterial diversity analysis was performed. Chao1 and Observed species were estimated to reflect the number of OTUs in a sample, and the values of which are positively correlated with the species richness of the sample. Moreover, Shannon and Simpson indicates reflect the averaging or uniformity of the abundance of different species in a sample, which are positively correlated with the species diversity. Alpha diversity analyses including the values of Chao1, Observed species, Shannon and Simpson are the comprehensive indicators of species richness and uniformity in community ecology. In this paper, we implemented the alpha diversity analyses, and the results showed that the samples from feces had the highest Chao1, Observed species, Shannon and Simpson values, which indicated that the fecal bacteria had the highest level of species richness and diversity (Fig. 3A–D). In addition, as shown in Fig. 3A and B, the alpha diversity indexes (Chao1 and Observed species) showed the species richness of the small intestine and feces in the AP group were significantly reduced compared to the SO group (p < 0.05). However, there was no significant differences in the species richness of colonic bacteria in SO and SAP groups. Furthermore, as shown in Fig. 3C and D, the alpha diversity indexes (Shannon and Simpson) showed that the species diversities of microbiota in SO and AP group had no notable differences (p > 0.05). Therefore, the microbiota in fecal samples had the greatest species richness, and the microbiota in colon samples had the least species richness; and these results indicated that fecal samples maybe the most suitable for the researches of gut microbiota. Moreover, AP induced the decrease in the species richness of gut microbiota in rats, which further proved that gut microbiota played an crucial role in AP pathophysiology.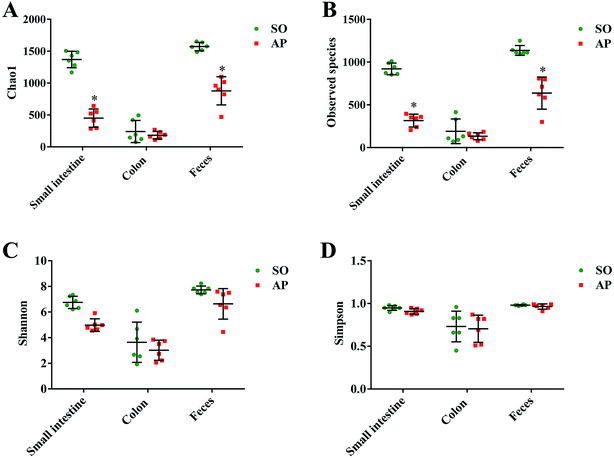 | ||
| Fig. 3 Alpha diversity analysis. Chao1 (A), observed species (B), Shannon (C) and Simpson (D) indexes of each samples. The data are presented as the mean ± SD, n = 6. *p < 0.05 versus the SO group. | ||
PCoA and RDA analyses
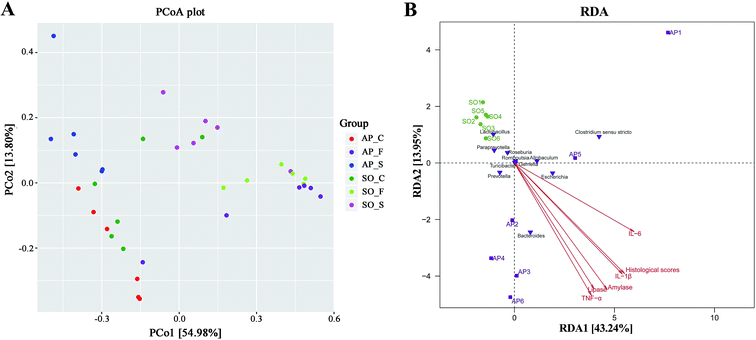
Beta diversity refers to species differences between different environmental communities, and it also can be used to evaluate the overall heterogeneity of the species or the environmental community. Principal coordinate analysis (PCoA) is the most suitable presentation method for the beta diversity analysis. As shown in Fig. 4A, PCoA plots using weighted UniFrac distances clustered samples mainly by sites, the different colors in the result represent different anatomical sites and groups, and the closer the sample distance is, the more similar the microbial composition between the samples is, and the smaller the difference is. PCoA analysis revealed that bacterial communities in the feces samples clustered closely to one another while those from small intestinal and colon samples did not (Fig. 4A). These results showed that inter-rat variations of fecal microbiota were lower than those of small intestinal and colon samples, and it suggested that fecal microbiota had better individual similarity. Therefore, beta diversity analyses further proved the studies on intestinal micro-organisms in AP rats may give priority to the use of fecal samples. In addition, as shown in Fig. 4B, redundancy analysis (RDA) proved that bacterial species in fecal samples, such as the Escherichia, Bacteroides, Allobaculum and Prevotella, had a positive correlation with AP; and the severity of AP was also positively correlated with the plasma concentration of amylase, lipase, TNF-α, IL-1β and IL-6, and the histological scores. Therefore, there were significant differences in species composition between different intestinal anatomy sites in SO and AP groups, which also supported the view of intestinal flora disorder in AP.Analysis of bacterial composition in AP rats
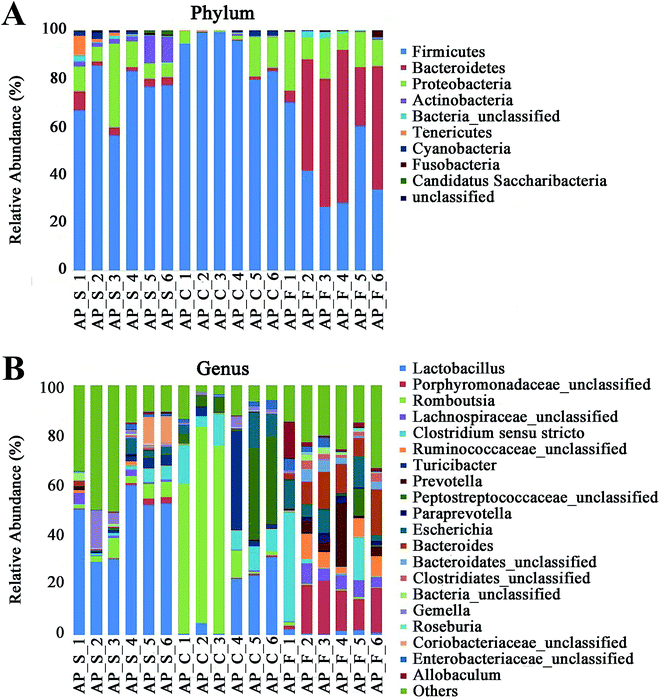
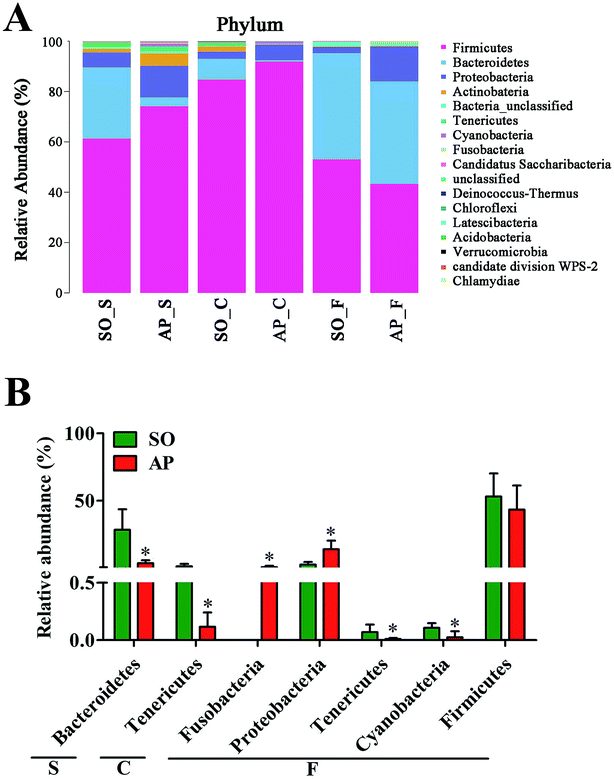
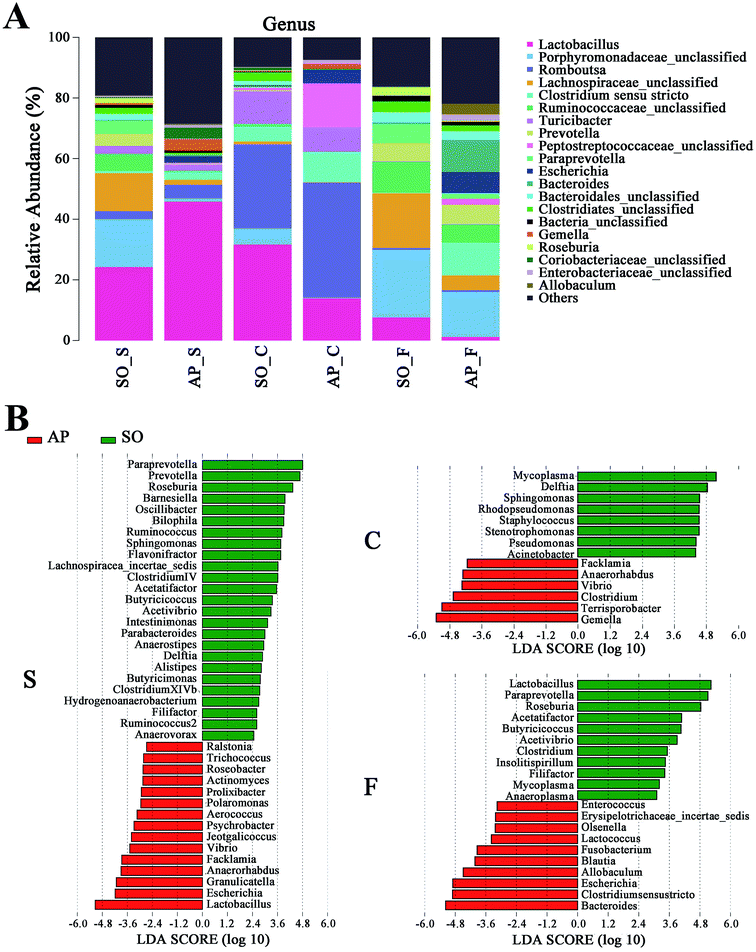
For taxonomy community analysis of the AP rat intestinal tract, eight different bacterial phyla were identified. As shown in Fig. 5A and ESI Table S5,† the majority of the sequences belonged to Firmicutes, Bacteroidetes, Proteobacteria, Actinobacteria, Tenericutes, Cyanobacteria, Fusobacteria and Candidatus Saccharibacteria. However, only Firmicutes, Bacteroidetes, Proteobacteria and Actinobacteria were found in all samples. The results indicated that the communities within the different anatomical regions differed largely in their compositions and proportions of the major bacteria. In addition, Firmicutes was the most abundant phyla in all samples, and the relative abundance of Firmicutes was significantly higher (p < 0.05) in colon (91.89%) than that in the small intestine (74.19%) and feces (43.31%). Moreover, the increased relative abundance of Bacteroidetes in the feces (40.70%) was detected compared with the other two sites (small intestine, 3.49%; colon, 0.52%). These results showed that Firmicutes and Bacteroidetes were the “core microbiota” of colon and feces, respectively. In detail, as shown in Fig. 5B and ESI Table S6,† Lactobacillus (belonged to Firmicutes) was enriched in small intestine, and decreased from colon to feces. The relative abundance of Romboutsia (belonged to Firmicutes) was significantly higher (p < 0.05) in colon than that in the small intestine and feces, and a larger proportion of Paraprevotella (belonged to Bacteroidetes) and Bacteroides (belonged to Bacteroidetes) were observed in feces than in the other sites. According to previous reference, the cause may be the higher oxygen availability of small intestine. Conversely, a larger proportion of Paraprevotella and Bacteroides were observed in feces where less oxygen is available. Therefore, the analysis of bacterial composition in AP rats indicated that the “core microbiota” of small intestine, colon and feces are as follow: Lactobacillus, Romboutsia, and Paraprevotella/Bacteroides. There are many differences between various gut regions, selection of the sampling site along the intestinal tract is therefore crucial for the investigation of microbiota-related health and disease issues.Bacterial taxonomic composition in AP rats compared to the SO rats
To explore the effects of AP on the intestinal micro ecology, we compared bacterial communities in different anatomic sites of AP rats with SO rats. As shown in Fig. 6A and B, at phylum level, the relative abundances of Bacteroidetes in small intestine and Tenericutes in colon of the AP rats were all significantly decreased compared with the SO group (p < 0.05). Moreover, the relative abundance of Fusobacteria and Proteobacteria were higher in feces samples from the AP group than those in the SO group, in contrary to the relative abundance of Tenericutes and Cyanobacteria (p < 0.05). In addition, because Firmicutes was the most abundant phyla in all samples, we compared its difference abundance between AP and SO rats, and the results showed that Firmicutes were decreased in the feces of the AP group compared to the SO group, but there is no statistically significant differences.Furthermore, as shown in Fig. 7A and B, the relative abundances of 40 species at genus level were obviously changed in the small intestine of AP rats compared with the SO group (p < 0.05), while the numbers of genus changes in the colon and feces were 14 and 21, respectively. Linear discriminant analysis (LDA) is a linear classifier which assigns objects into groups based on their Mahalanobis distance to group centres,29 and it was usually used to evaluate the difference in relative abundances of intestinal flora. In this paper, we calculated the LDA scores of genus changes between AP and SO rats, and found that the relative abundances of Lactobacillus, Gemella and Bacteroides were significantly increased in the small intestine and feces of AP rats, separately. These bacterial colonies maybe the targets for the treatment of AP.
COG and KEGG analyses
The COG database consists of proteins from complete genomes of bacteria, archaea and eukaryotes, and each categorized COG term represents an ancient conserved domain.30 As shown in Fig. 8A, the results proved that COG terms of differential flora in small intestine (p < 0.05) were mainly contained “[F] Nucleotide transport and metabolism”, “[G] Carbohydrate transport and metabolism” and “[J] Translation, ribosomal structure and biogenesis”. The significantly differential flora in faeces (p < 0.05) were included “[C] energy production and conversion”, “[D] Cell cycle control, cell division, chromosome partitioning” and “[E] Amino acid transport and metabolism”, etc. However, in the colonic tissue, there was no notably different COG functional distribution.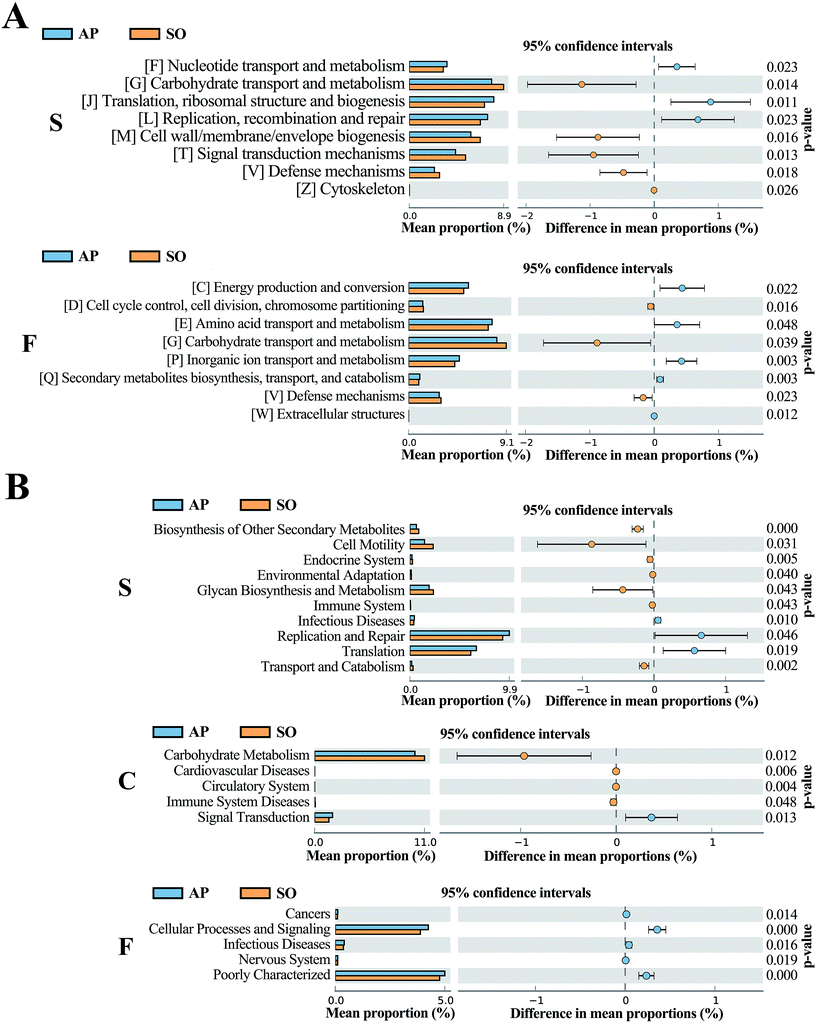 | ||
| Fig. 8 COG (A) and KEGG (B) analyses of significantly differential flora between AP and SO rats. p < 0.05 versus the SO group. (S, small intestine; C, colon; F, feces). | ||
In addition, KEGG database acts as an important knowledgebase to provide significant details regarding the molecular networks and biological pathways associated with the given genes or transcripts.31 As shown in Fig. 8B, the results indicated that differential flora in small intestine (p < 0.05) mainly involved in the signaling pathways of “Biosynthesis of Other Secondary Metabolites”, “Cell Motility”, “Endocrine System”, “Environmental Adaptation”, “Glycan Biosynthesis and Metabolism”, “Immune System”, “Infectious Diseases”, “Replication and Repair”, “Translation” and “Transport and Catabolism”. Moreover, differential flora in colon (p < 0.05) contained the signaling pathways of “Carbohydrate Metabolism”, “Cardiovascular Diseases”, “Circulatory System”, “Immune System Diseases” and “Signal Transduction”. In the differential flora of faeces tissue (p < 0.05), the signaling pathways involved in the “Cancers”, “Cellular Processes and Signaling”, “Infectious Diseases”, “Nervous System” and “Poorly Characterized”. There results maybe prove key information for the treatment of AP through balancing intestinal flora.
Experimental section
Animal and ethical approval
Twelve Sprague-Dawley (SD) rats weighing 180–220 g (6 weeks old) were obtained from the Dalian Medical University Laboratory Animal Center (Dalian, China) and housed in groups with three rats per cage in the specific pathogen-free (SPF) experiment environment. The rats were free access to standard laboratory food and water (autoclaved before use) and housed at 24 ± 2 °C with 65% ± 5% humidity on a 12 h light/dark cycle for adaptive feeding 1 week prior to the experiment. Randomization was used to assign samples to the experimental groups and to collect and process data. The experiments were performed by investigators blinded to the groups for which each animal was assigned. All animal care and experimental procedures were performed according to the guidelines of the Institutional Animal Care and local veterinary office and ethics committee of Dalian Medical University and were conducted in strict compliance with the People's Republic of China Legislation Regarding the Use and Care of Laboratory Animals. Animal studies have been reported in compliance with the ARRIVE guidelines.32AP model establishment and sample preparation
Twelve SD rats were randomly divided into 2 groups (n = 6): group I, SO group; group II, AP model group. Experimental AP models were established as previously described.33–35 In detail, the rats were fasted 12 h with free access to water before anaesthesia with pentobarbital sodium (40 mg kg−1). Hepatic duct was clamped by a small artery clip after the pancreas was fully exposed by a midline incision. The biliopancreatic duct was cannulated through the duodenum, and a freshly prepared 5.0% sodium taurocholate (0.1 mL/100 g body weight, Sigma, Inc., USA) was then administered into the biliopancreatic duct through a standard retrograde infusion. Presenting as controls, rats in the SO group received only abdomen opened and closed.After 48 hours of duct infusion, fresh feces were collected in sterile tube and stored at liquid nitrogen immediately, then transferred to −80 °C. Blood samples were obtained via the abdominal aorta of the rats for biochemical analyses after anaesthesia. Pancreatic head samples were fixed in 10% buffered formalin and embedded in paraffin for histopathological examination. The small intestine and distal colon were sampled under aseptic condition and immediately frozen in liquid nitrogen, then maintained at −80 °C until DNA extraction. The lengths of the rat small intestine (including duodenum, jejunum and ileum) and colon were about ∼30 and ∼10 cm, respectively.
Plasma amylase and inflammatory cytokine levels
Plasma amylase, lipase, IL-6, IL-1β and TNF-α levels were assayed with ELISA kits (Lengton Inc., China) following the manufacturer's instructions. The absorbance at 450 nm representing the relative level of amylase, lipase, IL-6, IL-1β and TNF-α in each well was measured by Thermo Scientific Multiskan FC (Massachusetts, USA).Histopathological examination
Formalin-treated tissue samples from each group were sliced into sections (5 µm), and then were dewaxed in graded alcohols, followed by stained with hematoxylin and eosin (H&E). Images were obtained using a light microscope (Leica DM4000B, Germany) at 200× magnification. Moreover, we calculated the histological scores according Table 1 in order to standardize and detail the stage of AP induced by sodium taurocholate.33,36,37DNA extractions
Total genomic DNA from different samples (100 mg) was extracted using the E.Z.N.A.® Stool DNA Kit (D4015, Omega, Inc., USA) according to manufacturer's instructions. The reagent which was designed to uncover DNA from trace amounts of sample has been shown to be effective for the preparation of DNA of most bacteria. Nuclear-free water was used for blank. The total DNA was eluted in 50 µL of elution buffer and stored at −80 °C until measurement in the PCR by LC-Bio Technology Co. Ltd (Hangzhou, China).PCR amplification
The V3–V4 region of the bacteria 16S ribosomal RNA genes were amplified genomic DNA with slightly modified versions of primers 338F (5′-ACTCCTACGGG AGGCAGCAG-3′) and 806R (5′-GGACTACHVGGGTWTCTAAT-3′).38 The 5′ ends of the primers were tagged with specific barcode sequences per sample and sequencing universal primers. PCR amplification was performed in a total volume of 25 µL reaction mixture containing 50 ng of template DNA, 12.5 µL of PCR Premix, 2.5 µL of each primer, and PCR-grade water to adjust the volume. The PCR conditions to amplify the bacteria 16S fragments consisted of an initial denaturation at 98 °C for 30 s, followed by 35 cycles of denaturation at 98 °C for 10 s, annealing at 54 °C for 30 s, and extension at 72 °C for 45 s; and then a final extension at 72 °C for 10 min.16S rDNA sequencing
The PCR products were confirmed with 2% agarose gel electrophoresis. Throughout the DNA extraction process, ultrapure water, instead of a sample solution, was used to exclude the possibility of false-positive PCR results as a negative control. The PCR products were purified using AMPure XT beads (Beckman Coulter Genomics, Danvers, MA, USA) and quantified by Qubit (Invitrogen, USA). The amplicon pools were prepared for sequencing and the size and quantity of the amplicon library were assessed on Agilent 2100 Bioanalyzer (Agilent, USA) according to the standard protocols and with the Library Quantification Kit for Illumina (Kapa Biosciences, Woburn, MA, USA), respectively. PhiX Control library (v3) (Illumina) was combined with the amplicon library (expected at 30%). The libraries were sequenced either on 300 PE MiSeq runs and one library was sequenced with both protocols using the standard Illumina sequencing primers, eliminating the need for a third (or fourth) index read.Data analysis
Samples were sequenced on an Illumina MiSeq platform according to the manufacturer's recommendations, provided by LC-Bio. Paired-end reads was assigned to samples based on their unique barcode and truncated by cutting off the barcode and primer sequence. Paired-end reads were merged using FLASH. Quality filtering on the raw tags were performed under specific filtering conditions to obtain the high-quality clean tags according to the FastQC (V 0.1). Chimeric sequences were filtered using Verseach software (v2.3.4). Sets of sequences with ≥97% similarity were assigned to the same OTUs by Verseach (v2.3.4). Representative sequences were chosen for each OTU, and taxonomic data were then assigned to each representative sequence using the RDP (Ribosomal Database Project) classifier. The differences of the dominant species in different groups, multiple sequence alignment were conducted using the PyNAST software to study phylogenetic relationship of different OTUs. OTUs abundance information were normalized using a standard of sequence number corresponding to the sample with the least sequences.Alpha diversity is applied in analyzing complexity of species diversity for a sample through 4 indices, including Chao1, Shannon, Simpon and Observed species. All these indices in our samples were calculated with QIIME (Version 18.0). Beta diversity analysis was used to evaluate differences of samples in species complexity. Beta diversity were calculated by PCoA and cluster analysis by QIIME software (Version 1.8.0). Moreover, RDA was analyzed by CANOCO software; and the COG and KEGG analyses were performed by the STAMP software.
Statistical analysis
Data were presented as mean ± Standard Deviation (SD). Statistical analysis was performed with the unpaired t-test when comparing two different groups. SPSS 18.0 (SPSS, Chicago, IL, USA) was used to handle these data and only when a minimum of n = 5 independent samples was acquired. p < 0.05 was considered statistically significant. The data and statistical analysis comply with the recommendations on experimental design and analysis in pharmacology.39Conclusions
In conclusion, as numerous reports focus on fecal samples in animal and human with AP, we firstly characterized bacterial community map along the AP rat gut to indicate bacterial communities associated with AP. Although experimental and clinical studies have revealed probiotics might be an effective strategy to prevent and manage AP, using the microbiota as a biomarker of impending or fully manifest AP within or outside of the gut and for monitoring therapeutic responses needs to be explored. Owing to the intestinal tract of mammals harbors a different microbial ecosystem that varies according to the location within the intestinal tract, attention should be paid to ensure that the proper gut samples are used to represent each bacterial community during microbiota-related research. These data will provide clinical guidance for the treatment of AP through regulating bacterial communities, and give a reference for the researches of bacterial communities in different parts of the intestine.Conflicts of interest
There are no conflicts to declare.Acknowledgements
This work was supported by the National Natural Science Foundation of China (No. 81373875).References
- F. Backhed, R. E. Ley, J. L. Sonnenburg, D. A. Peterson and J. I. Gordon, Science, 2005, 307, 1915–1920 CrossRef PubMed.
- V. S. Akshintala, R. Talukdar, V. K. Singh and M. Goggins, Clinical Gastroenterology and Hepatology, 2018 Search PubMed.
- L. Dethlefsen, M. McFall-Ngai and D. A. Relman, Nature, 2007, 449, 811–818 CrossRef CAS PubMed.
- B. D. Muegge, J. Kuczynski, D. Knights, J. C. Clemente, A. Gonzalez and L. Fontana, Science, 2011, 332, 970–974 CrossRef CAS PubMed.
- C. F. Maurice, H. J. Haiser and P. J. Turnbaugh, Cell, 2013, 152, 39–50 CrossRef CAS PubMed.
- I. Cho and M. J. Blaser, Nat. Rev. Genet., 2012, 13, 260–270 CrossRef CAS PubMed.
- I. Gunjaca, J. Zunic, M. Gunjaca and Z. Kovac, Inflammation, 2012, 35, 758–763 CrossRef CAS PubMed.
- F. Llimona, T. M. de Lima, A. I. Moretti, M. Theobaldo, J. Jukemura, I. T. Velasco, M. C. Machado and H. P. Souza, Inflammation, 2014, 37, 1231–1239 CAS.
- P. G. Lankisch, M. Apte and P. A. Bank, Lancet, 2015, 386, 85–96 CrossRef.
- S. Fritz, T. Hackert, W. Hartwig, F. Rossmanith, O. Strobel and L. Schneider, Am. J. Surg., 2010, 200, 111–117 CrossRef PubMed.
- M. E. Cen, F. Wang, Y. Su, W. J. Zhang, B. Sun and G. Wang, Apoptosis, 2018, 23, 377–387 CrossRef CAS PubMed.
- T. Watanabe, M. Kudo and W. Strober, Mucosal Immunol., 2017, 10, 283–298 CrossRef CAS PubMed.
- W. J. Gu and J. C. Liu, J. Crit. Care, 2014, 18, 446 CrossRef PubMed.
- Q. Li, C. Wang, C. Tang, Q. He, N. Li and J. Li, Crit. Care Med., 2013, 41, 1938–1950 CrossRef CAS PubMed.
- R. Şenocak, T. Yigit, Z. Kılbaş, A. K. Coşkun, A. Harlak and M. Ö. Menteş, Indian J. Surg., 2015, 77, 412–418 CrossRef PubMed.
- X. M. Zhang, Z. Y. Zhang, C. H. Zhang, J. Wu, Y. X. Wang and G. X. Zhang, Biomed. Environ. Sci., 2018, 31, 81–86 Search PubMed.
- L. Cicalese, A. Sahai, P. Sileri, C. Rastellini, V. Subbotin and H. Ford, Dig. Dis. Sci., 2001, 46, 1127–1132 CrossRef CAS PubMed.
- I. D. Van Felius, L. M. Akkermans, K. Bosscha, A. Verheem, W. Harmsen and M. R. Visser, Neurogastroenterol. Motil., 2003, 15, 267–276 CrossRef CAS PubMed.
- L. P. Van Minnen, M. Blom, H. M. Timmerman, M. R. Visser, H. G. Gooszen and L. M. Akkermans, J. Gastrointest. Surg., 2007, 11, 682–689 CrossRef CAS PubMed.
- R. Şenocak, T. Yigit, Z. Kılbaş, A. K. Coşkun, A. Harlak and M. Ö. Menteş, Indian J. Surg., 2015, 77(suppl. 2), 412–418 CrossRef PubMed.
- I. D. Van Felius, L. M. Akkermans, K. Bosscha, A. Verheem, W. Harmsen and M. R. Visser, Neurogastroenterol. Motil., 2003, 15, 267–276 CrossRef CAS PubMed.
- J. M. Mylotte and A. Tayara, Eur. J. Clin. Microbiol. Infect. Dis., 2000, 19, 157–163 CrossRef CAS PubMed.
- K. Rantakokko-Jalava, S. Nikkari, J. Jalava, E. Eerola, M. Skurnik and O. Meurman, J. Clin. Microbiol., 2000, 38, 32–39 CAS.
- S. Gu, D. Chen, J. N. Zhang, X. Lv, K. Wang and L. P. Duan, PLoS One, 2013, 8, e74957 CrossRef CAS PubMed.
- F. Backhed, R. E. Ley, J. L. Sonnenburg, D. A. Peterson and J. I. Gordon, Science, 2005, 307, 1915–1920 CrossRef PubMed.
- P. J. Turnbaugh, V. K. Ridaura, J. J. Faith, F. E. Rey, R. Knight and J. I. Gordon, Sci. Transl. Med., 2009, 1, 6ra14 Search PubMed.
- R. An, E. Wilms, A. A. M. Masclee, H. Smidt, E. G. Zoetendal and D. Jonkers, Gut, 2018, 67, 2213–2222 CrossRef PubMed.
- M. G. Langille, J. Zaneveld, J. G. Caporaso, D. McDonald, D. Knights and J. A. Reyes, Nat. Biotechnol., 2013, 31, 814–821 CrossRef CAS PubMed.
- E. N. Hanssen, K. H. Liland, P. Gill and L. Snipen, Forensic Sci. Int.: Genet., 2018, 37, 13–20 CrossRef CAS PubMed.
- J. C. Chang and S. Ramasamy, J. Insect Sci., 2018, 25, 33–44 CrossRef CAS PubMed.
- M. Kanehisa and S. Goto, Nucleic Acids Res., 2000, 28, 27–30 CrossRef CAS PubMed.
- J. C. McGrath and E. Lilley, Br. J. Pharmacol., 2015, 172, 3189–3193 CrossRef CAS PubMed.
- H. Xiang, X. Tao, S. Xia, J. Qu, H. Song and J. Liu, Front. Immunol., 2017, 8, 1488 CrossRef PubMed.
- Q. Zhang, X. Tao, S. Xia, J. Qu, H. Song and J. Liu, Oncol. Rep., 2019, 41, 270–278 Search PubMed.
- J. Pereda, L. Sabater, N. Cassinello, L. Gómez-Cambronero, D. Closa and E. Folch-Puy, Ann. Surg., 2004, 240, 108–116 CrossRef PubMed.
- C. M. Ryan, J. Schmidt, K. Lewandrowski, C. C. Compton, D. W. Rattner and A. L. Warshaw, Gastroenterology, 1993, 104, 890–895 CrossRef CAS.
- X. M. Xia, B. K. Li, S. M. Xing and H. L. Ruan, World J. Gastroenterol., 2012, 18, 2132–2139 CrossRef CAS PubMed.
- D. W. Fadrosh, B. Ma, P. Gajer, N. Sengamalay, S. Ott and R. M. Brotman, Microbiome, 2014, 2, 6 CrossRef PubMed.
- M. J. Curtis, R. A. Bond, D. Spina, A. Ahluwalia, S. P. Alexander and M. A. Giembycz, Br. J. Pharmacol., 2015, 172, 3461–3471 CrossRef CAS PubMed.
Footnote |
| † Electronic supplementary information (ESI) available. See DOI: 10.1039/c8ra09547g |
| This journal is © The Royal Society of Chemistry 2019 |

