 Open Access Article
The second offshore production of methane hydrate in the Nankai Trough and gas production behavior from a heterogeneous methane hydrate reservoir
K. Yamamoto *a,
X.-X. Wangb,
M. Tamakic and
K. Suzukid
aJapan Oil, Gas and Metals National Corporation, 1-2-2 Hamada Mihama-ku, Chiba-shi, Chiba 261-0025, Japan. E-mail: yamamoto-koji@jogmec.go.jp
bJapan Oil, Gas and Metals National Corporation, Currently The MathWorks, Inc., Tokyo, Japan
cJapan Oil Engineering Inc. Tokyo, Japan
dJapan Oil, Gas and Metals National Corporation, National Institute of Advanced Industrial Science and Technology, Tsukuba, Japan
First published on 20th August 2019
Abstract
Following the first attempt at producing gas from a naturally occurring methane hydrate (MH) deposit in the Daini–Atsumi Knoll in the eastern Nankai Trough area off Honshu Island, Japan in 2013, a second attempt was made in April to June of 2017 at a nearby location using two producer wells sequentially and applying the depressurization method. The operation in the first borehole (AT1-P3) continued for 12 days with a stable drawdown of around 7.5 MPa and 41![[thin space (1/6-em)]](https://www.rsc.org/images/entities/char_2009.gif) 000 m3 of methane gas being produced despite intermittent sand-production events. The operation of the other borehole (AT1-P2) followed, with a total of 24 days of flow and 222
000 m3 of methane gas being produced despite intermittent sand-production events. The operation of the other borehole (AT1-P2) followed, with a total of 24 days of flow and 222![[thin space (1/6-em)]](https://www.rsc.org/images/entities/char_2009.gif) 500 m3 of methane gas being produced without sand problems. However, the degree of drawdown was limited to 5 MPa because of a higher water production rate than expected in the second hole. The pressure and temperature sensors deployed in the two producers, along with the two monitoring holes drilled nearby, gathered reservoir response data and information about the long-term MH dissociation processes in the vicinity of the production holes in the temporal and spatial domains. Although the ratio of energy return to the input was considerably larger than that for the depressurization operation, some observations (e.g., the high contrast in the production rates between the two holes and the almost constant or slightly reduced gas production rates) were not predicted by the numerical models. This failure in prediction raises questions about the veracity of the reservoir characteristics modeled in the numerical simulations. This paper presents the operation summaries and data obtained with thought-experiment based-anticipated production behaviors and preliminary analysis of the obtained data as the comparison with expected behaviors. Detailed observations of gas and water production, as well as the pressure and temperature data recorded during the gas flow tests, indicate that the heterogeneous MH distribution within the reservoir was mainly responsible for the discrepancies observed between the anticipated and actual behaviors. Furthermore, the motion of the water that does not originate from MH dissociation introduces complexity, such as the occurrence of concentrated water-producing intervals and unexpected gas production responses to decreases in pressure, into the production behavior. The influence of heterogeneity should be clearly understood for the accurate prediction of gas production behavior based on MH reservoirs.
500 m3 of methane gas being produced without sand problems. However, the degree of drawdown was limited to 5 MPa because of a higher water production rate than expected in the second hole. The pressure and temperature sensors deployed in the two producers, along with the two monitoring holes drilled nearby, gathered reservoir response data and information about the long-term MH dissociation processes in the vicinity of the production holes in the temporal and spatial domains. Although the ratio of energy return to the input was considerably larger than that for the depressurization operation, some observations (e.g., the high contrast in the production rates between the two holes and the almost constant or slightly reduced gas production rates) were not predicted by the numerical models. This failure in prediction raises questions about the veracity of the reservoir characteristics modeled in the numerical simulations. This paper presents the operation summaries and data obtained with thought-experiment based-anticipated production behaviors and preliminary analysis of the obtained data as the comparison with expected behaviors. Detailed observations of gas and water production, as well as the pressure and temperature data recorded during the gas flow tests, indicate that the heterogeneous MH distribution within the reservoir was mainly responsible for the discrepancies observed between the anticipated and actual behaviors. Furthermore, the motion of the water that does not originate from MH dissociation introduces complexity, such as the occurrence of concentrated water-producing intervals and unexpected gas production responses to decreases in pressure, into the production behavior. The influence of heterogeneity should be clearly understood for the accurate prediction of gas production behavior based on MH reservoirs.
Introduction
Due to its vast abundance,1–4 geoscientists, energy scientists and petroleum engineers have made intensive studies to evaluate the value of naturally occurring clathrate hydrate methane, or methane hydrate (MH) as a possible alternative fuel resource and to develop practical technologies to extract energy from it.5,6 However, producing combustible gas from this solid form of methane in geological formations requires production technologies such as depressurization or thermal stimulation. To evaluate the effectiveness of gas production technologies for MH reservoirs and estimate their productivity, the temporal and spatial advances of MH dissociation in the reservoir are key, which are governed by heat and mass transport in the underground. This is because the dissociation of MH into gas and water is an endothermic process (436.8 kJ kg−1) that is controlled by heat supply via conduction and advection. Therefore, the monitoring of fluid motion and heat transport is an essential part of field attempts toward gas production from MH deposits.7–12The first intentional gas production from an underground MH deposit happened in 2002 from an onshore borehole drilled at the Mallik site in the Northwest Territories of Canada, and MH was dissociated using thermal stimulation13 that created a small volume of gas (∼470 m3 under ambient conditions during the five days of operation). A small-scale depressurization attempt revealed the finite value of the permeability in the MH saturated formation and the possibility of applying the depressurization method.14,15 Using this method, the phase equilibrium temperature can be decreased from the initial value, and the necessary heat to dissociate MH can be supplied from the sensible heat of sediments. By using the technique, five days of continuous gas production was achieved with a total of 13![[thin space (1/6-em)]](https://www.rsc.org/images/entities/char_2009.gif) 000 m3 in gas production at the same site by applying the depressurization method16 in 2008.
000 m3 in gas production at the same site by applying the depressurization method16 in 2008.
The first attempt at producing gas from a submarine MH deposit in the Daini–Atsumi Knoll of the eastern Nankai Trough off Honshu Island of Japan in 2013 resulted in 119![[thin space (1/6-em)]](https://www.rsc.org/images/entities/char_2009.gif) 000 m3 (under ambient conditions) of methane gas being produced. This demonstrated the applicability of the depressurization concept under offshore conditions in the short term,17,18 and yielded much thermodynamic information19 such as vertical temperature distribution in the drilled producer and monitoring boreholes and inferred rate of MH dissociation. The data obtained revealed vertically heterogeneous gas- and water-production profiles and the hydraulic character of the reservoir such as the fluid permeability of each zone and the existence of a water-producing streak. The obtained gas/water production behavior information and temperature were compared with geophysical logging data-inferred reservoir characterization information such as geology, MH saturation, and permeabilities. History matching efforts using a numerical simulator could improve the reliability of the reservoir character data.20
000 m3 (under ambient conditions) of methane gas being produced. This demonstrated the applicability of the depressurization concept under offshore conditions in the short term,17,18 and yielded much thermodynamic information19 such as vertical temperature distribution in the drilled producer and monitoring boreholes and inferred rate of MH dissociation. The data obtained revealed vertically heterogeneous gas- and water-production profiles and the hydraulic character of the reservoir such as the fluid permeability of each zone and the existence of a water-producing streak. The obtained gas/water production behavior information and temperature were compared with geophysical logging data-inferred reservoir characterization information such as geology, MH saturation, and permeabilities. History matching efforts using a numerical simulator could improve the reliability of the reservoir character data.20
Meanwhile, modeling studies by various researchers have predicted increased gas production due to depressurization in confined reservoirs with no movable fluid contact underneath9,11,12,21–27 because the expansion of the permeability-enhanced region by the disappearance of solid hydrate in pore spaces results in an extensive reaction area. This predicted trend is a key advantage for gas production in methane-hydrate reservoirs because it raises the prospect of commercially feasible energy production if true. In the case of the Nankai Trough reservoir, simulation results from a reservoir model constructed on the basis of previous test information and core/log data also predicted an increase in the gas production rate from 20![[thin space (1/6-em)]](https://www.rsc.org/images/entities/char_2009.gif) 000 m3 per day to as much as 80
000 m3 per day to as much as 80![[thin space (1/6-em)]](https://www.rsc.org/images/entities/char_2009.gif) 000 m3 per day within a month, if a 10 MPa drawdown could be applied.20,25 However, because of the shorter duration of operation caused by abrupt sand production on the sixth day of the 2013 operation, sufficient evidence to clarify the longer-term gas production stability or future improvement was not obtained. Meanwhile, the mismatch in thermal information between model predictions and actual measurements suggests that some factors, particularly reservoir heterogeneity, could cause the actual production behaviors to deviate from that predicted by the simplified theory and the numerical model.26
000 m3 per day within a month, if a 10 MPa drawdown could be applied.20,25 However, because of the shorter duration of operation caused by abrupt sand production on the sixth day of the 2013 operation, sufficient evidence to clarify the longer-term gas production stability or future improvement was not obtained. Meanwhile, the mismatch in thermal information between model predictions and actual measurements suggests that some factors, particularly reservoir heterogeneity, could cause the actual production behaviors to deviate from that predicted by the simplified theory and the numerical model.26
To advance the Japanese national methane hydrate research project led by the MH21 (the research consortium for methane hydrate resources in Japan), the Japanese Government decided to conduct a second gas production test at a location near that of the first test to induce gas flow for several weeks.27
Operation summary and geology and borehole settings
Stratigraphic and MH occurrence features in the test site
For the second offshore test, well locations (including AT1-P2, AT1-P3, AT1-MT2, and AT1-MT3) were selected approximately 75 m south of the 2013 test site (AT1-P, AT1-MC, and AT1 MT1 wells), where the water depth is around 1000 m.At the location, there are 70–80 m-thick highly saturated MH-bearing turbidite layers at around 300 m below the seafloor.28,29 The up-dip direction of the reservoir formation is southeast; hence, the top of the formations appears several meters shallower in the 2017 boreholes as compared to the 2013 ones. Five boreholes were drilled in 2016, one year prior to the flow test operation. A survey well (AT1-UD) was drilled to determine the well location by observing the reservoir characteristics in the up-dip direction.30 Two others (AT1-MT2/MT3) were the monitoring holes in which pressure and temperature (P–T) sensors were installed outside the casing for long-term (2 years) continuous data acquisition. The overburden sections of two producer holes (AT1-P2/P3) were also drilled in 2016. The well locations were carefully chosen to avoid interference between the two producers and to allow the monitoring devices to detect and distinguish thermal responses due to methane-hydrate dissociation and the effects of flow in the up-dip or down-dip direction. Further, the drilling of the reservoir section of the producer holes was performed immediately before the production test was conducted in 2017.
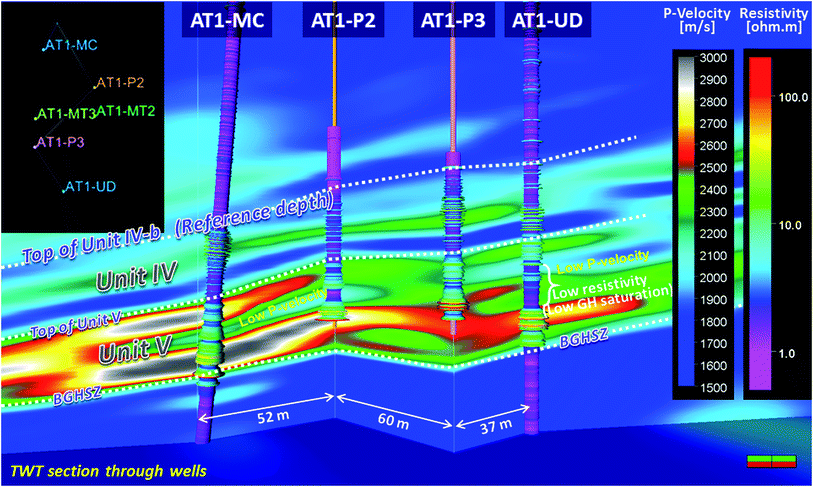
The three-dimensional seismic survey data were available, and detailed analyses of the seismic attributes and hydrate occurrences were conducted.31 The logging-while-drilling (LWD) data were collected from all the boreholes, and the wireline logging data were obtained from the AT1-UD, AT1-MT2, AT1-P2, and AT1-P3 holes. Fig. 1, 2, and 3 show the relationship between the well placement and completion and the geological and hydrate-occurrence-related information obtained using the survey data. Along with the seismic data, the log data revealed the good correlation and continuation of the host sediments and the heterogeneous MH occurrences in the test site.
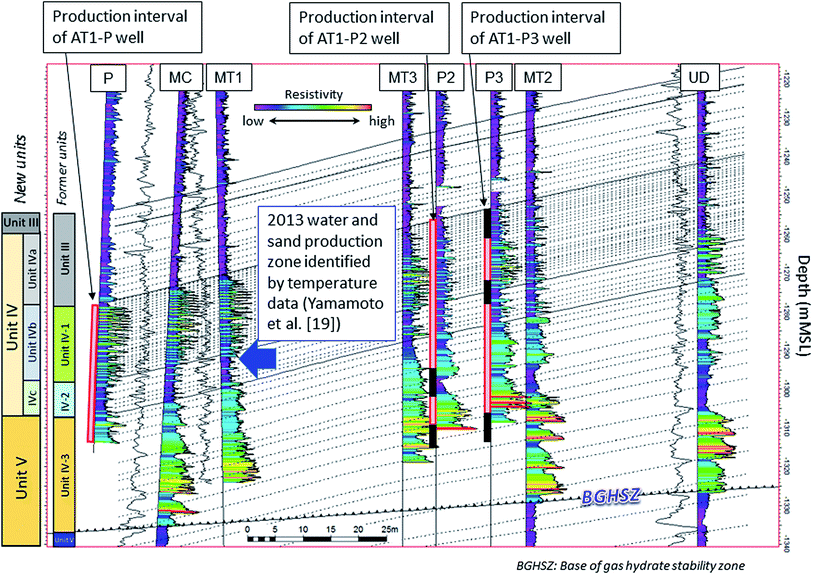 | ||
| Fig. 1 The log data for resistivity from the 2013 and 2017 boreholes with defined sedimentation units and the completion of 2017 producer boreholes. The high-resistivity zones correspond to the sandy zones that are highly saturated with MH. The low-resistivity zones can be silty or water-bearing sand zones that can become water-producing streaks. The red open squares that mark the AT1-P, P2 and P3 wells indicate the intervals in which a sand-control device is installed. The black zones are covered with swell packers to prevent water production. The effective production intervals for AT1-P2 and P3 were 45.4 and 41 m (modified from Tamaki et al. (2017)31). | ||
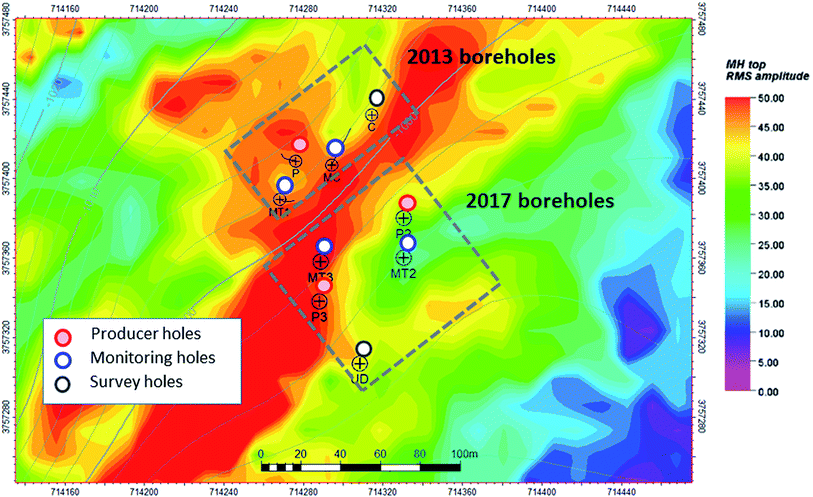 | ||
| Fig. 2 Wellhead locations of 2013 and 2017 production test boreholes. The colors depict the root means square amplitude (arbitrary unit) of the seismic reflection of the top MHCZ horizon, which may indicate the accumulation of methane hydrate in Unit IV-b.31 Gray contour lines indicate the depth of the top of Unit IV-b. The 2013 wells encountered a problem with deviated well paths shown as black lines, however, the 2017 holes were drilled almost vertically using rotary steerable tools. This figure denotes the relatively low concentration of MH in the eastern side of the test area, particularly around AT1-P2. As described later, this low concentration of MH could lead to excess water influx into the well.19 | ||
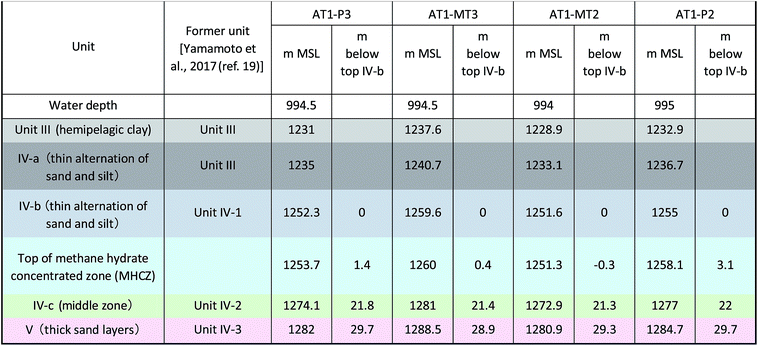
Fig. 1 depicts the resistivity log data that indicate the presence of MH with inferred geological units. Highly resistive zones indicate a high MH saturation zone. The figure includes the delineated geological units and stratigraphy and the well-completion schematics of the AT1-P2 and AT1-P3 wells. Further, the details of these completions are described in the subsequent subsection. At approximately 240–330 m below the seafloor, the holes passed through three geological units that may be related to MH dissociation. For this study, the geological units were redefined from the previous report29 after careful observation of core and log data. Unit III (hemipelagic clay, and formerly the shallow part of Unit III) is expected to work as hydraulic isolation from the overburden zone. Unit IV is a thin-bedded sand and silt alternating unit of the sheet type, and the unit includes the former deep part of Unit III and the shallow part of Unit IV (Unit IV-1 and IV-2). This unit is divided into Unit IV-a, IV-b and IV-c based on different sedimentological features. Unit V is the sand-dominant thick alternating unit of the channel fill type and was formerly Unit IV-3. It contained the methane-hydrate-concentrated zone (MHCZ); a high MH saturation sandy interval with a certain thickness existed in Unit IV-b, IV-c and Unit V. The top of the MHCZ occurred in Unit IV-b; it does not match the top of Unit IV-b.
Table 1 presents the depth of the top of each unit along with the borehole locations. Further, the thicknesses of Units IV-b and -c were approximately 21 and 9 m, respectively, at all the locations. Hereafter, all the depths are expressed as lower than the depth of the top of Unit IV-b to clarify the corresponding geological strata among the boreholes.
The locations and well paths of the boreholes are plotted in Fig. 2 with the root-mean-square amplitude of the seismic reflection from the top of the MHCZ horizon. This indicator provides a good signature of the accumulation of MH in Unit IV-b as a linear relationship between the seismic amplitude (arbitrary unit) and integral of resistivity in Unit IV-b.31 This figure indicates that less MH was expected at the location of AT1-P2 than that at the location of AT1-P3.
Fig. 3 illustrates the combination of two parameters related to MH saturation; the P-wave velocities recorded by a 3D seismic survey and the electrical resistivity log recorded by borehole logging. The high-velocity zone in the seismic data is in good agreement with the high electrical resistivity intervals in Unit V. These data indicate the horizontally and vertically heterogeneous distributions of MH and, more specifically, the existence of the low-hydrate saturation zones distributed in the reservoir across the boreholes. These low-hydrate saturation zones may be water-bearing sand layers and are anticipated to be water-producing at intervals before the planned production test.
These heterogeneities and water-bearing intervals were considered to be the potential causes of disturbance during gas production. In the case of the 2013 test occasion, water production was concentrated within a specific interval at the bottom of Unit IV-b19 as marked in Fig. 1, and sand was also produced from the layer at the same depth. These possible influences of heterogeneity on the reservoir responses were the main focus of the monitoring data analysis.
Producer well placement and production test
A year after the drilling campaign in 2016, gas production started in one of the producer holes (AT1-P3) in May 2017 and was followed by the operation of the other hole (AT1-P2). In total, 36 days of flow were sequentially realized from the two producer holes, despite several technical difficulties.To ensure the sustainability of the operation, some engineering improvements were made, such as (i) a robust sand-control device, (ii) improved riser and subsea systems that ensure continuous flow under harsh weather conditions and resumed operation after riser disconnection, and (iii) the advanced design of downhole devices for effective gas–liquid separation for reliable flow assurance. Moreover, some technical developments were made for long-term monitoring of the thermal and hydraulic conditions, such as (i) downhole pressure sensing in the monitoring holes, (ii) subsea data storage, (iii) rechargeable batteries, and (iii) an acoustic system for communication between subsea and a surface vessel.32
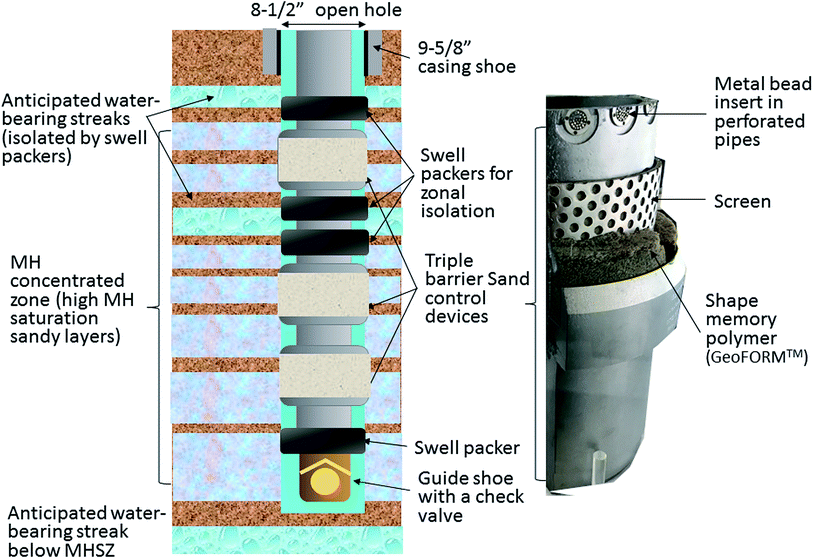
In the producer holes, a length of approximately 60 m in each hole was selected as the production zone in which “lower-completion” (a portion of the well contacting the production formation) with sand-control and zonal isolation devices were set. The device comprises a combination of a porous shape memory polymer (fully activated GeoFORM† on the installation in the AT1-P3 well, and in situ activation through an activation fluid in AT1-P2), metal bead insert, and a premium screen. To avoid excessive water production, some sections, interpreted as the water-producing low-hydrate-saturation zones, were covered by swell packers to isolate the well from the formation. The detailed schematic view of the lower-completion is shown in Fig. 4. In Fig. 1, zones with the sand-control device, having the expected production intervals, are indicated with red open squares, respectively, and the packer-covering zones are indicated by black squares. The effective production-zone interval ΔZ (i.e., the open-hole interval minus the packer-covering zone) was 41 m in AT1-P3 and 45.4 m in AT1-P2. In total, nine P–T sensors (seven real-time and two memory gauges) were run in the production section of each well with the inner string. Unfortunately, the memory sensors in AT1-P3 could not be recovered because they were buried in the produced sand.
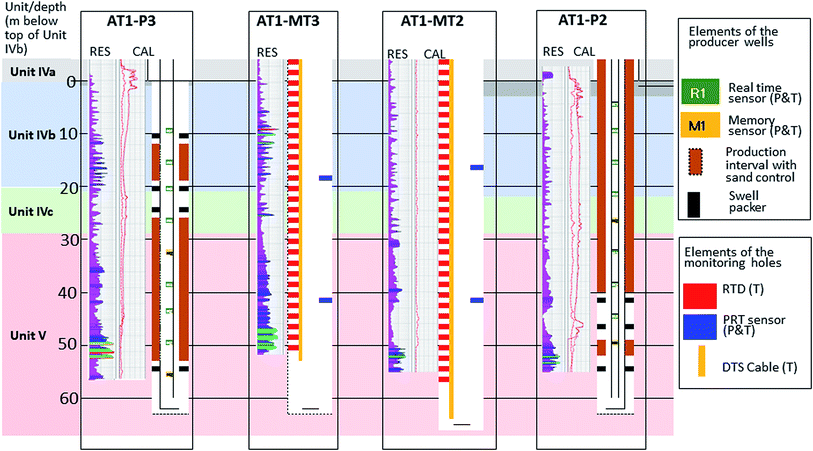
In each monitoring hole, two types of temperature sensors [a distributed temperature sensor (DTS) and an array of resistivity temperature devices (RTD)] covered almost the entire sections of the MHCZ. Two pressure gauges were installed in two different sections (Unit IV-b and Unit V) of each well to observe the difference in pressure response in different geological settings. All the sensors were set outside of the 9-5/8′′ casing and buried in cement, and gathered data for the two years between May 2016 and May 2018.
The detailed sensor configuration of the producer and monitoring holes is shown in Fig. 5, with the log-derived resistivity data showing the MH occurrence and caliper data showing the hole enlargement. It should be noted that the unexpected hole enlargement that happened in AT1-P2 and AT1-P3 (particularly the former) might have affected the effectiveness of the swell packer and the sand-control measure.
The plug and abandonment (P&A) operations of the boreholes were done in April to June of 2018, with some additional data acquisition (including pressure coring and wireline logging) in two of the newly drilled boreholes (AT1-CW1/CW2) (ref. 33). The sensors in the producer and monitoring hole recorded the P–T data continuously until the P&A operation.
In the following sections, operation results and analyses of obtained data are presented and discussed.
Gas/water production behaviors of two boreholes
Anticipated production behavior
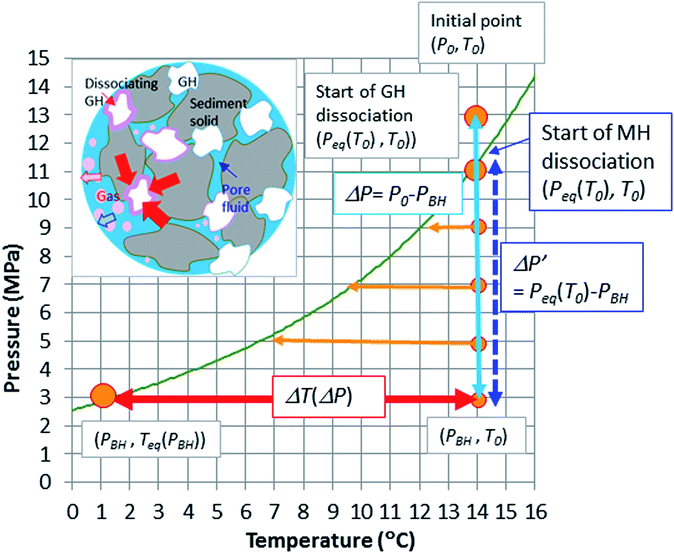
Fig. 6, 7, and 8 provide conceptual illustrations of the applied depressurization method and the predictions of the mass and heat transfer as well as the gas and water production behaviors. These behaviors are based on an assumption-based thought experiment with the thermodynamic nature of MH and modeled geological and physical characters of the reservoir. Fig. 6 depicts the P–T conditions with the phase-equilibrium curve of MH and the vapor-phase methane during an adiabatic depressurization operation. When the depressurization procedure is applied to a unit volume of an MH-bearing sediment with a pressure drawdown ΔP from the initial value Po to PBH (ΔP = Po − PBH), the amount of hydrate dissociated by the operation is controlled by the heat supplied as the heat capacity of the sediment. This heat capacity originates from the combination of the heat capacities of sand grains, pore fluid, and changes in the phase-equilibrium temperature and can be written as follows:where H(GH) denotes the latent heat of MH dissociation per unit mass, ṁg denotes the generation rate of vapor-phase methane mass, c(GH)p, c(w)p, and c(w)p denote the specific heats of MH, water, and sand grain, respectively, ϕ denotes the porosity, Sh denotes the hydrate saturation (volume fraction of the MH crystal in pore volume), and ΔT denotes the difference between the initial temperature (T0) and the phase-equilibrium temperature after depressurization (Teq(PBH)) , then ΔT = T0 − Teq(PBH). Furthermore, the generation rate of methane gas is dictated by a kinetic equation34 and is proportional to the difference between the phase-equilibrium pressure at the initial temperature (Peq(Tinit)) and the pressure after depressurization (PBH).
| ṁg ∝ ΔP′ = Peq(T0) − PBH |
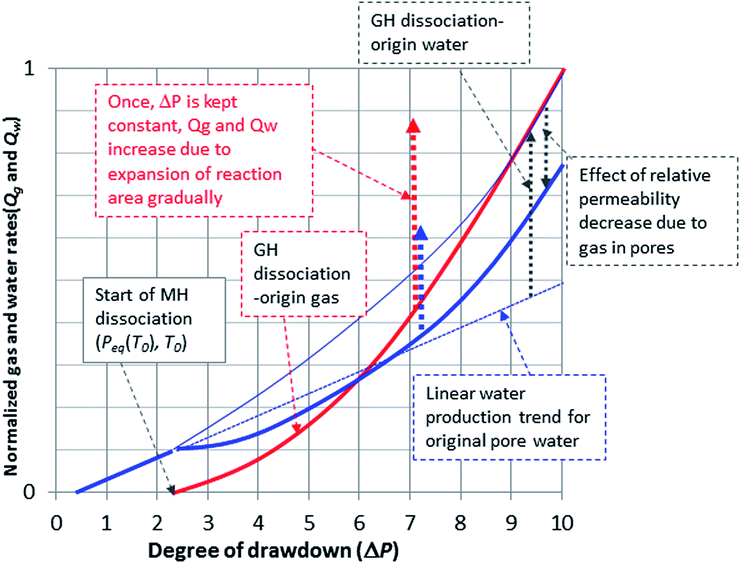 | ||
| Fig. 8 Anticipated gas and water production trends during drawdown. With no MH dissociation, the water production rate Qw is almost proportional to the degree of drawdown. When the pressure reaches the phase-equilibrium pressure at the initial temperature Peq(T0), the gas production starts, and Qg should exhibit a convex-down curvature. Water originating from the MH dissociation is added to the Qw curve; however, it should also be influenced by the water's effective permeability change owing to the generation of gas in the pore zones. When the drawdown rate is maintained constant, Qg and Qw should increase over time due to the expansion of the reaction area as depicted in Fig. 7. | ||
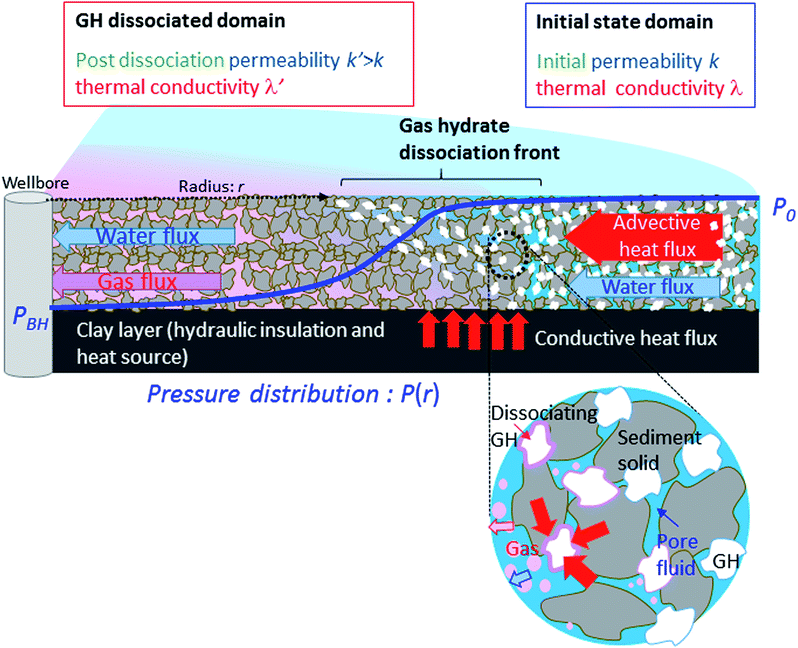
Next, we extend the thought experiments from our initial focus on a single point to cover the entire reservoir. For this purpose, we assume the axisymmetric structure around a wellbore with laterally homogeneous and finite thickness of the MH-bearing sand. The sand layer is assumed to have upper and lower boundaries that interface with low-permeability clay layers functioning as both heat sources and hydraulic insulators, as depicted in Fig. 7. The following three factors govern the gas and water production behaviors: (i) the alteration of the phase-equilibrium temperature owing to pressure change; (ii) heat supply from the clay layers to the MH-bearing sandy layer; (iii) the enhancement of effective permeability owing to the disappearance of the MH crystals from the pore spaces.
The development of an MH-dissociated zone in which the permeability was enhanced may extend the depressurized domain around the wellbore. This would lead to the expansion of the reaction area or the so-called “MH dissociation front,” where MH is actively dissociated.
Because these two thermodynamic conditions act on different scales (over the unit volume and over the whole reservoir), the gas and water production rates from the reservoir to the well (Qg and Qw, respectively) can be predicted based on the depressurization degree, as depicted in Fig. 8. The amount of water production is the sum of the production of the original pore water and the water originating from MH dissociation. The former portion should be almost proportional to the degree of drawdown. When the pressure reaches the phase-equilibrium pressure (Peq(T0)), the production of gas and MH-dissociated water begins; further, the rates of each exhibit a convex downward curvature because of the geometry of the phase–boundary curve (increase in ΔT against an increment of ΔP′) and the form of the kinetic equation. Additionally, Qg and Qw are influenced by the change in the effective permeability of gas and water. Some reduction in Qw is expected to be caused because of the presence of gas in the pore spaces and the associated reduction in the effective permeability of water when MH starts dissociating.
During the short term in which the boundary effects of the reservoir are considered to be negligible, the expansion of the reaction area for MH dissociation should cause a gradual increase in Qg and Qw if ΔP is kept constant. This anticipated incremental trend in the gas production rate is specific to the gas production from an MH reservoir.
Fig. 9 shows an example of model-predicted gas and water production behaviors for a modeled AT1-P3 well.25 The calculations were made with MH21-HYDRES, a methane hydrate production simulator developed within the MH21 research program. An axisymmetric geometry with a fine mesh system (each turbidite sequence was modeled as a different grid) was applied, and the reservoir petrophysics model was constructed through a history matching effort20 of the 2013 test and newly taken core and log data. Three steps of drawdown (ΔP = 6, 8 and 10 MPa) were applied for the simulation. The modeling results suggested an incremental trend of gas and water productions with time, the same as the through-experiment-based behavior. However, various obstacles may be observed while obtaining such production behaviors. Some of the obstacles are near-wellbore phenomena or the skin effects that are seen as a pressure drop across the wellbore surface, and are caused by various mechanisms such as non-Darcy gas flow or clogging of the sand-control device by the migrated solids. In the greater domain, the reservoir compaction caused by MH dissociation effective stress increase inhibits the enhancement of permeability and also impedes the production. The heterogeneity of the geology and the MH distribution, such as non-continuous MH deposits and contact with water-bearing zones may prevent the stability and continuity of the production. Each of these effects may cause the actual production behavior to differ from the anticipated productivity of the well.
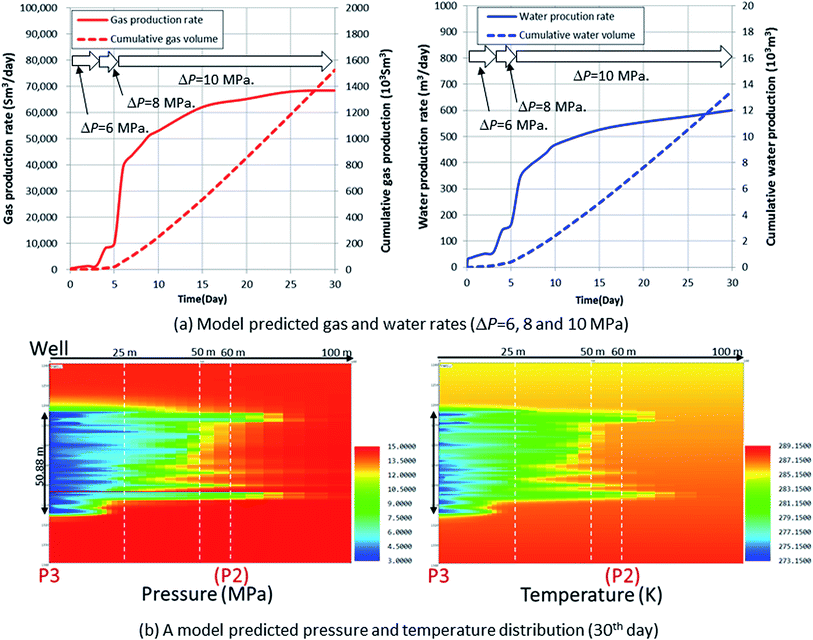 | ||
| Fig. 9 (a) An example of model-predicted gas and water production behaviors of a modeled AT1-P3 well, and (b) pressure and temperature distribution in the reservoir.25 The calculation was made with MH21-HYDRES, a methane hydrate production simulator developed within the MH21 research program. The reservoir petrophysics model was constructed through a history matching effort20 and taken core and log data. Three steps of drawdown (ΔP = 6, 8 and 10 MPa) were applied for the simulation. The modeling results suggested an incremental trend of gas and water productions with time. | ||
The gas production data from the 2013 test did not show any incremental trend in Qg and Qw; however, the test period was considerably short, and the long-term 2017 test focused on obtaining the data required to understand the physical mechanisms associated with the observed behaviors if they differ from the model predictions.
Actual gas and water production behaviors: AT1-P3
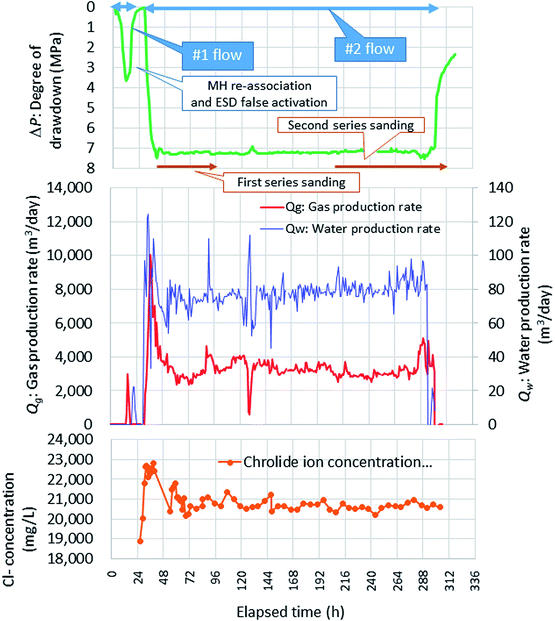
The flow test began in the AT1-P3 well on May 2, 2017. In total, 293.33 h (12 d and 5.33 h) of pump operation—excluding half a day of interruption due to a malfunction of the emergency shutdown system—took place for depressurization and gas production. A maximum of 7.85 MPa of drawdown (ΔP) was achieved. The daily gas production ratio (Qg) and water production ratio (Qw) were almost stable (Qg = 3000–4000 m3 per day, and Qw = 70–90 m3 per day). The history of pressure and rates are shown in Fig. 10 with the drawdown and chloride-ion concentration of the produced water and some explanations of major events. It is worth noting that the values of Qg and Qw are corrected to the gas and water influxes from the reservoir to the borehole by considering the water level and gas storage volume changes in the borehole. The elapsed time t starts from the beginning of the ESP operation of the first borehole.Some minor sand-production events were observed in the early stage of pump operation but ceased when the degree of drawdown was slightly decreased to reduce the water flow rate. However, they happened again and became more severe in the later stage (elapsed time t > 200 h from the start of the pumping operation) and finally became uncontrollable when an attempt was made to increase the degree of drawdown, whereupon the test was terminated to avoid damaging the subsea and surface devices.
The salinity data were measured using a potentiometer titrator at the laboratory in D/V Chikyu and onshore laboratories by the standard ODP/IODP procedures.35 Interestingly, a slight increase in the chloride-ion concentration (from 19![[thin space (1/6-em)]](https://www.rsc.org/images/entities/char_2009.gif) 000 ppm to 20
000 ppm to 20![[thin space (1/6-em)]](https://www.rsc.org/images/entities/char_2009.gif) 000–21
000–21![[thin space (1/6-em)]](https://www.rsc.org/images/entities/char_2009.gif) 000 mg L−1) was observed during water production, and this increased concentration is higher than that of typical seawater (19
000 mg L−1) was observed during water production, and this increased concentration is higher than that of typical seawater (19![[thin space (1/6-em)]](https://www.rsc.org/images/entities/char_2009.gif) 500 mg L−1). This trend was also observed in the AT1-P well (2013) in which the chloride-ion concentration was typically 20
500 mg L−1). This trend was also observed in the AT1-P well (2013) in which the chloride-ion concentration was typically 20![[thin space (1/6-em)]](https://www.rsc.org/images/entities/char_2009.gif) 500–21
500–21![[thin space (1/6-em)]](https://www.rsc.org/images/entities/char_2009.gif) 000 mg L−1; however, this trend was opposite to the anticipated behavior because we expected that the produced water would be distilled by the fresh water generated from the dissociated hydrates. This fact suggests that the wellbore came in contact with a water source having a rather high salinity.
000 mg L−1; however, this trend was opposite to the anticipated behavior because we expected that the produced water would be distilled by the fresh water generated from the dissociated hydrates. This fact suggests that the wellbore came in contact with a water source having a rather high salinity.
Some studies suggested that high salinity fluid can be produced as a by-product of the desalination by the gas-hydrate association process,36,37 and it is possible that high salinity fluid remains in existence in the MH reservoir if the layer is hydraulically isolated. In fact, high chloride-ion conditions in core samples from the test location were reported by Egawa et al. (2015).38
Actual gas and water production behaviors: AT1-P2
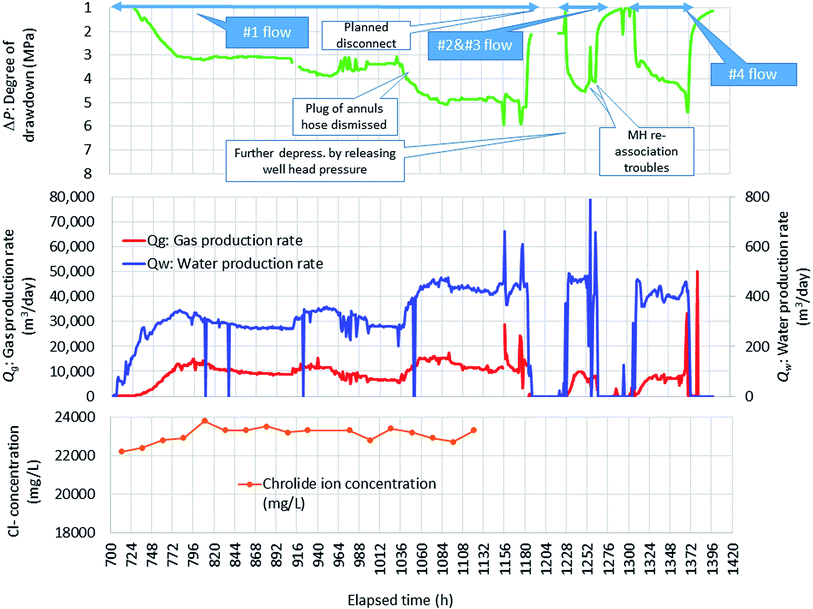
The derived fluid density and the temperature information detected by the downhole sensors revealed that some warm and dense matter moved upward from the bottom of the well before the occurrence of sand production. This fact suggested that the sand production was likely due to a problem with the check valve in the guide shoe at the bottom of the sand-control device that did not close properly, not with the sand-control device itself. To mitigate and counteract the sanding, some additional measures were put in place, and the flow test of the AT1-P2 well started on May 31.Fig. 11 depicts the pressure, gas and water flow rates, and chloride-ion concentration along with the records of relevant events. The elapsed time in this figure is defined to match that of AT1-P3 pumping and is counted from the beginning of the ESP operation of the first borehole. There were no sand problems with the later well, and higher Qg (∼10![[thin space (1/6-em)]](https://www.rsc.org/images/entities/char_2009.gif) 000 m3 per day) and Qw (300–500 m3 per day) were measured. However, the drawdown was limited because of a higher Qw than the expected maximum value that the pumping system can handle; therefore, the degree of drawdown was limited. Due to the relatively high pressure conditions at the area near the seafloor where the temperature is low (around 3–4 °C), the P–T condition was kept inside the gas hydrate stability zone and caused some hydrate re-association in either water or gas trains in the borehole that plugged the flowlines and obstructed the operation.
000 m3 per day) and Qw (300–500 m3 per day) were measured. However, the drawdown was limited because of a higher Qw than the expected maximum value that the pumping system can handle; therefore, the degree of drawdown was limited. Due to the relatively high pressure conditions at the area near the seafloor where the temperature is low (around 3–4 °C), the P–T condition was kept inside the gas hydrate stability zone and caused some hydrate re-association in either water or gas trains in the borehole that plugged the flowlines and obstructed the operation.
At the beginning of the pump operation, the drawdown was gradual with additional flow-assurance measures, including the fact that the gas train riser pipe was filled with diethylene glycol as the hydrate inhibitor. Further, excess water production and clogging of one of the water train hoses limited ΔP to 3 MPa. After the removal of the hydrate plug from the hose, the drawdown further increased to 5 MPa, which was the maximum drawdown under stable conditions in this borehole. There was also a planned disconnection of the production riser system from the well due to expected rough sea conditions at t = 1183 h (482.5 h from the start of pump operation of the AT1-P3 well). The flow was resumed successfully after the test riser system was reconnected and continued until t = 1370.8 h of elapsed time (670.3 h from the beginning of the P2 pump operation).
Comparison of production behavior among wells
The gas production rates of the AT1-P3 well were less than that of the 2013 AT1-P well (Qg = 20![[thin space (1/6-em)]](https://www.rsc.org/images/entities/char_2009.gif) 000 m3 per day at ΔP = 8.5 MPa). Furthermore, the gas-to-water ratio (GWR) of the AT1-P3 well was 40–50, which was also less than that of the AT1-P well (∼100). In total, 41
000 m3 per day at ΔP = 8.5 MPa). Furthermore, the gas-to-water ratio (GWR) of the AT1-P3 well was 40–50, which was also less than that of the AT1-P well (∼100). In total, 41![[thin space (1/6-em)]](https://www.rsc.org/images/entities/char_2009.gif) 000 m3 of gas and 920 m3 of water were produced. In the case of the AT1-P2 well, 223
000 m3 of gas and 920 m3 of water were produced. In the case of the AT1-P2 well, 223![[thin space (1/6-em)]](https://www.rsc.org/images/entities/char_2009.gif) 000 m3 of gas and 8200 m3 of water were produced during 612 h of pump operation, and the GWR of the well was 20–30 m3 m−3. The chloride-ion concentration of the AT1-P2 water increased from the beginning and reached around 23
000 m3 of gas and 8200 m3 of water were produced during 612 h of pump operation, and the GWR of the well was 20–30 m3 m−3. The chloride-ion concentration of the AT1-P2 water increased from the beginning and reached around 23![[thin space (1/6-em)]](https://www.rsc.org/images/entities/char_2009.gif) 000–24
000–24![[thin space (1/6-em)]](https://www.rsc.org/images/entities/char_2009.gif) 000 mg L−1, which was higher than the concentration measured in AT1-P3.
000 mg L−1, which was higher than the concentration measured in AT1-P3.
In both cases, the produced gas was almost pure methane (>99.9%). Therefore, AT1-P3 production yielded a dataset under conditions of constant drawdown for 10 days. Meanwhile, the datasets obtained from different drawdowns (gradual change and two constant terms with ΔP = 3 and 5 MPa) were recorded from the AT1-P2 well.
Origins of the produced gas and water
The water could originate from the following two sources: dissociated MH and original pore water in the formations. The produced gas originates from the MH dissociation and from the gas dissolved in the original pore water. These contributions can be calculated in terms of GWR and methane solubility using the formulation provided in Appendix 1. In the case of the AT1-P3 well, 24% of the water and 96% of gas originated from the hydrates. In the AT1-P2 case, the MH-originating water and gas constituted 16% and 93% of the total production, respectively. Therefore, the majority of the water in both the holes originated from pore fluid, and the dominant source of gas was considered to be of hydrate dissociation origin.The salinity data obtained from two boreholes suggest that high-salinity pore water was produced from all three boreholes, and the contribution of such fluid is the most significant in AT1-P2, where the highest salinity was measured. This observation agreed with our interpretation of low GWR as evidence of water influx not related to MH.
Comparison of the gas and water production profiles among three boreholes
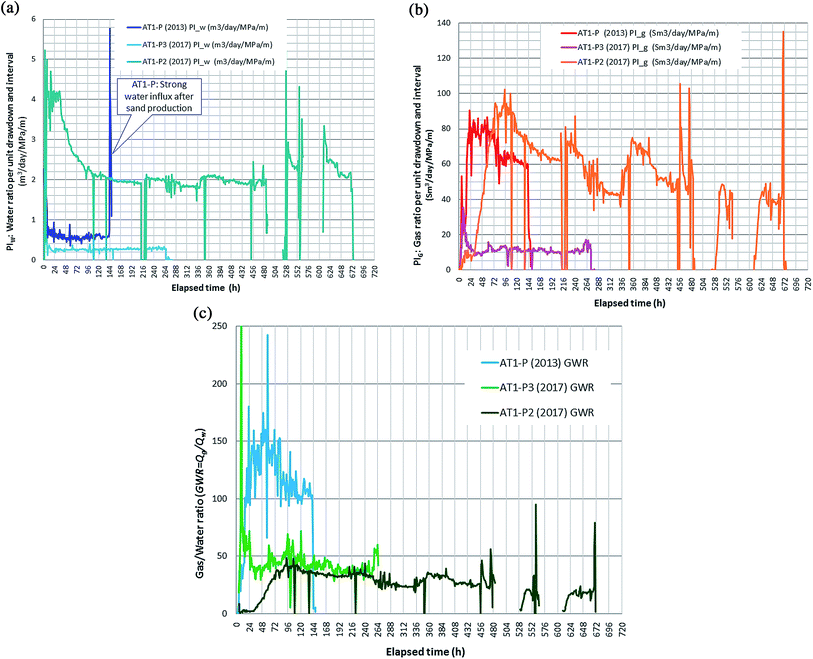
To compare the gas and water production behaviors of three boreholes, including the AT1-P well (2013), gas and water production rates per unit drawdown and unit production interval, PIg = Qg/(ΔPΔZ) and PIw = Qw/(ΔPΔZ), respectively, and gas to water ratio were calculated and denoted as functions of time (Fig. 12). Further, considerably large discrepancies were observed in these indexes. PIw in each well was basically stable during the operation; however, the value of AT1-P2 was particularly high. Further, the PIg of AT1-P2 and AT1-P had similar values but the value of AT1-P3 was particularly low. No clear incremental changes were observed in PIg and PIw during the constant-pressure periods. Further, slight decreases in PIg and more clear decreases in GW were observed in all the wells.
For comparison with the anticipated behavior depicted in Fig. 8, the gas and water rates from a unit interval (Qg/ΔZ and Qw/ΔZ) versus the degree of drawdown (ΔP) of each well are depicted in Fig. 13. In the case of the AT1-P2 well, only the data of the first series of the flow before the planned disconnect are plotted (t = 700–1100 h). In the case of this borehole in which gradual depressurization and two steps of constant drawdown were applied, the behaviors of Qg/ΔZ and Qw/ΔZ at the initial stage agreed well with the anticipated behavior, such as the almost-linear increase in Qw/ΔZ and the convex-down curvature of Qg/ΔZ. However, in constant ΔP regions (ΔP = 3 and 5 MPa), the rates did not denote an increment but rather decreased. In case of the AT1-P well (2013), an increment in Qw/ΔZ to ΔP appeared; however, Qg/ΔZ seemed to decrease slightly. No clear trend was seen in the AT1-P3 well data.
The overall situations of the gas and water production behaviors differ from the behavior anticipated using assumption-based simple thought experiments and model predictions. The possible reasons for this divergence are considered in the following section using the P–T monitoring data obtained from the producer and monitoring boreholes. The major questions raised by the observations of the production behaviors are as follows:
• Why is there such a large discrepancy in production among wells?
• Why is there a difference between the anticipated and actual production behaviors? More specifically, why did the gas production rates not increase over time and the degree of drawdown as predicted by the assumption-based thought experiment?
In the next section, the major MH dissociation and gas-producing intervals, as well as the temporal advances of the MH-dissociated regions, will be evaluated using the P–T sensing information, and the relationship of these behaviors with the geology and the distribution of MH will be examined.
Spatial and temporal advances of the MH dissociation and gas/water production observed from the PT monitoring data
In the following sections, obtained P–T monitoring data are presented along with a preliminary analysis of the obtained monitoring data to show how the MH dissociation advanced in the reservoir temporally and spatially.Vertical gas and water production profiles of the producer holes
In the test conducted in 2013, the distributed temperature data obtained from the production well provided information about the vertical profiles of gas and water influxes into the well based on assumptions about the temperature of the produced gas and water.19 The analysis results denote that the gas-producing zone and, more significantly, the water production interval were localized and related to the occurrence of MH.In case of the 2017 sensor settings that included the pressure sensor arrays, the uncertainty in the evaluation result could be reduced using information about the fluid density obtained from the difference between the pressure values of the two sensors (dP/dz) along with the temperature data. The detailed process for calculating the gas and water influxes from each section between the two sensors is discussed in Appendix 2.
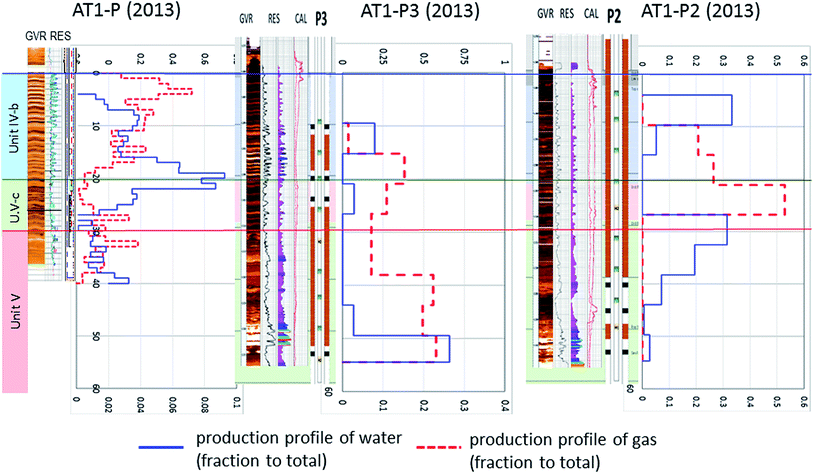
Fig. 14 shows the derived approximate solutions of vertical gas- and water production profiles together with the well and geological characteristics in the AT1-P2 and P3 boreholes at 144 h after the start of pump operation in each well as a representative moment, as well as the data of AT1-P (2013) profile.19 The results suggest vertical heterogeneity of the gas- and water production characteristics and their difference among the three boreholes.
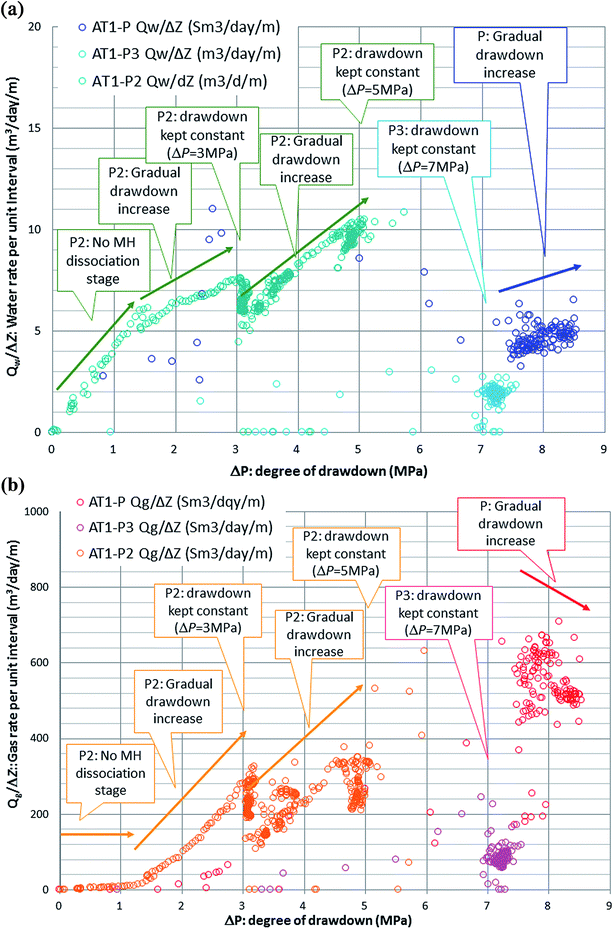 | ||
| Fig. 13 The relations between the degree of drawdown and the (a) water and (b) gas production rates per unit production interval (Qw/ΔZ and Qg/ΔZ). Comparing the AT1-P2 data with the anticipated behavior in Fig. 8, both Qw/ΔZ and Qg/ΔZ behaved as expected during the early stage (convex-down Qg/ΔZ curve, Qw/ΔZ departed from the linear trend when gas production started) but no increment was observed during the period of constant drawdown in both cases. The AT1-P data show a slight decrease in Qg/ΔZ and then an increase in Qw/ΔZ as the drawdown increases. | ||
AT1-P and P2 exhibited some similarities, such as active gas production in Unit IV-b and poor gas production rates in Unit V, and strong water flow around Unit IV-c. Most of the gas influxes in the AT1-P2 well occurred in the bottom part of Unit IV-b and Unit IV-c. In this well, zones of strong water flow were observed at the boundary of Unit IV-c and Unit V and at the top of Unit IV-b, i.e., the top of the production interval. The slight differences between AT1-P and P2, such as poor gas production from the top of Unit IV-b in AT1-P2, can be explained by the different MH distributions (low saturation in AT1-P2 in the top of Unit IV-b but high saturation in AT1-P).
In the case of the AT1-P3 well, the gas and water production profiles had significant differences from the other two boreholes. The gas production rates of Unit IV-b, which was the main gas source of the AT1-P and P2 well, were relatively poor, and most of the gas came from Unit V.
Another question raised by the data is why was there such a drastic difference in the gas/water production profiles among the three boreholes, which were all within a radius of 50 m. The water-producing zones in AT1-P2 corresponded to the low-MH-saturation zone identified based on the resistivity and the seismic data, and these data seem to be reasonable. The poor productivity of gas and water in Unit IV-b was particular to AT1-P3, and no specific geological feature or aspect of the MH distribution can explain this effect.
Expansion of the MH dissociation regions observed from the temperature data
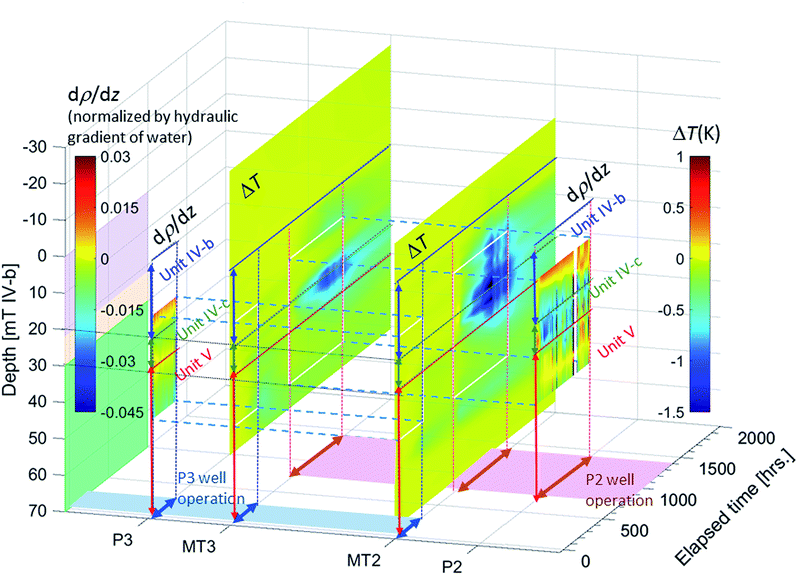
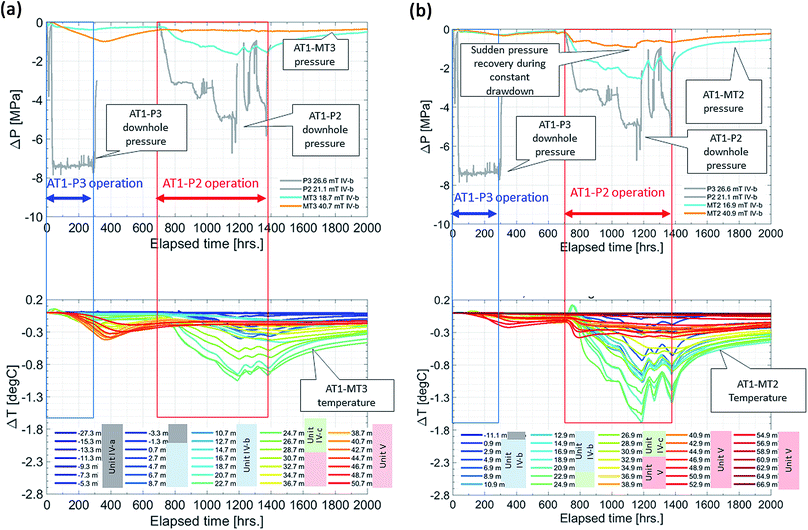
To denote the relationship between the thermal responses detected in the monitoring boreholes with production profiles in the producer holes, the temperature changes measured by the sensors in two monitoring boreholes (AT1-P3 and AT1-P2) are depicted with the density gradients of the production boreholes in Fig. 15. The low-temperature zone in the monitoring holes (depicted in blue) indicated the active MH dissociating regions. The latter indicated the density of the inflowing fluid and the decrease in density along with the upper motion of the fluid (
 , also depicted in blue) indicates the influx of a lighter gaseous fluid.
Good correspondences were observed between the inferred gas production intervals of the producer holes and the temperature-drop zones (i.e., Unit V of the AT1-P3 well and Unit IV-b to Unit IV-c of the AT1-P2 wells).
During the AT1-P3 operation, a decrease in temperature was observed in the monitoring holes. Even in the nearest AT1-MT3 well, the temperature response was slower. Some gas production was indicated at the boundary of Unit IV-b and Unit IV-c of AT1-P3; however, no change was observed in the corresponding interval of AT1-MT3. This indicated that MH dissociation was quite localized at the interval.
On the other hand, the AT1-P2 operation resulted in considerably clear and quick thermal responses, specifically in Unit IV-b and Unit IV-c, but no sensible change was observed in Unit V of AT1-MT3.
Temperature and pressure conditions in the boreholes with the phase equilibrium curve of vapor methane and MH
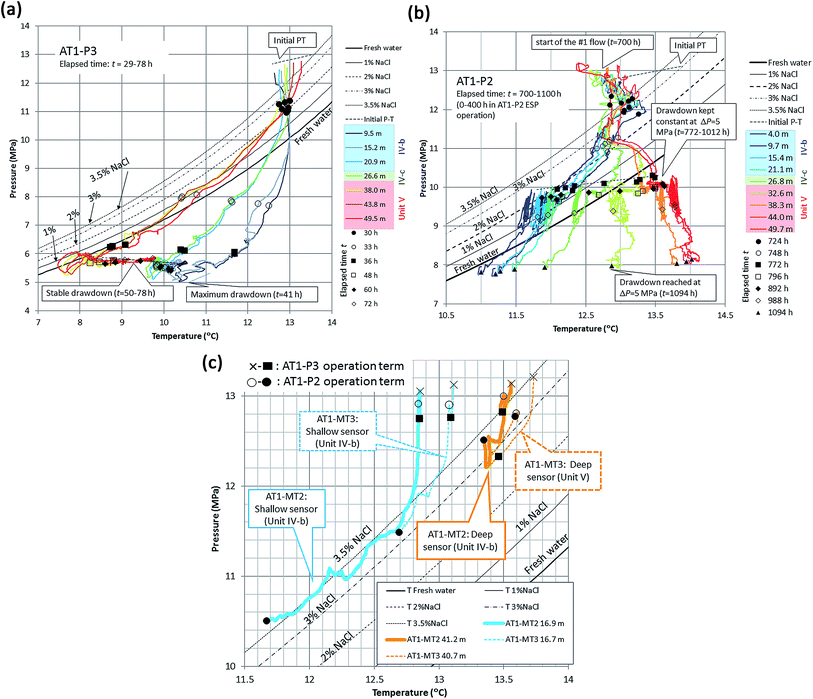
Qualitatively, the correspondence between the producer and monitoring holes can be observed in Fig. 14. For performing a quantitative evaluation, the P–T plots of the wells with phase-equilibrium curves between the vapor-phase methane and MH with several salinity levels are depicted in Fig. 15. In the figures discussed in this and the subsequent subsections, the curves at an identical depth are depicted using the same color (reddish is deeper and bluish is shallower). To avoid confusion because of congested lines, the time ranges of the AT1-MT3 and AT1-MT2 plots are limited between 30 and 78 h and 700 and 1100 h of the elapsed time, respectively.For AT1-P3 (Fig. 16(a)), the temperature data obtained from the sensors in Unit V (38 to 49.5 m deeper than Unit IV-b top) began to drop when the P–T curve intersected the phase-equilibrium curve with a salinity of 3% or 3.5% and initially moved along the phase-equilibrium curve. When the downhole pressure was kept almost constant, the temperature began to gradually increase. Conversely, the shallow sensors detected a slow temperature drop. A trend similar to the latter one was detected in the 2013 well.19 These data suggest that in the Unit V section of the borehole, gas and water came only from hydrate dissociation and flowed in during the drawdown period, but some warmer fluid from the original pore water flowed in and warmed up the deep-section sensors in the later constant drawdown stage. On the other hand, the gradual dissociation of the MH supply cooled the fluid reaching the well and caused slow temperature responses in the shallow section.
The data from the AT1-P2 well (Fig. 16(b)) were more complicated. At the beginning of depressurization, all the sensors detected the beginning of a temperature drop at phase-equilibrium curves having a salinity of 3–3.5%. However, instead of detecting a temperature drop, the sensors in Unit V (32.6 m Unit IV-b and deeper) detected an increase when the drawdown became approximately 2 MPa. This indicated that warm fluid started to flow into the borehole section in Unit V at a specific moment (t ∼ 750 h, 50 h from the start of the AT1-P2 pump operation). This temperature increase continued in the deepest three sensors (38.3 m and deeper) when the drawdown was maintained at 3 MPa. The P–T data obtained from the shallow sensors in Unit IV-b moved along the phase-equilibrium curve with a high salinity (>3%) at the beginning and gradually departed from the phase-equilibrium curves, indicating that the MH-dissociated fluid was dominant in this section during the early stage but the supply of warm fluid gradually increased in the later stage. These observations agree with the finding that GWR gradually decreased in the borehole.
The P–T data measured by the two pressure sensors of AT1-MT2 and AT1-MT3 are plotted with the phase-equilibrium curves in Fig. 16(c).
During the AT1-P3 operation (from × to ■), the magnitudes of the pressure drop at the sensors at Unit IV-b and Unit V in AT1-MT2 were approximately 0.2 MPa, and their P–T were still within the hydrate stability conditions. Only the deep sensor of AT1-MT3 could detect a decrease in temperature that may be induced by the pressure drop of approximately 1 MPa and subsequent MH dissociation.
During the first drawdown stage of AT1-P2 (from ○ to ●), most of the sensors except the deep sensor of AT1-MT3 detected a drop in both pressure and temperature. The P–T of the shallow sensors moved along the 3.5% salinity curve and the depth data of AT1-MT2 moved along a slightly lower salinity (∼3%). However, this behavior was considerably complicated because a relatively rapid pressure recovery was observed during the constant drawdown period of the producer hole at t ∼ 1150 h (450 h after the beginning of the AT1-P2 pump operation).
It should be noted that the heat capacity of the bulk sediment c(b) and necessary heat to dissociate MH in the pore space in a unit volume ΔH(pore) are written as
| c(b) = φ{c(h)ρ(h)Sh + c(w)ρ(w)(1 − Sh)} + (1 − φ)c(r)ρ(r) |
| ΔH(pore) = ρ(h)φShΔH, |
The P–T data for the monitoring wells indicate the hydraulic connectivity between the producers and the monitoring holes. For example, almost no pressure response was recorded at the deep sensor of AT1-MT3 during AT1-P3 operation (from × to ■), and the lack of response from the same sensor during AT1-P2 operation (from ○ to ●) indicates that the reservoir comprises two hydraulically isolated compartments (AT1-P3 and deep AT1-MT3 and AT1-P2, AT1-MT2, and shallow AT1-MT3).
The detailed P–T history obtained from AT1-MT2 and AT1-MT3 for the period during the drawdown of AT1-P3 and AT1-P2 are denoted in Fig. 17. During the AT1-P3 operation, slow temperature and pressure responses were observed at the sensors in the deep zones of both the monitoring holes (Unit V denoted by reddish lines). These regions correspond to low-permeability formations. Almost no responses were recorded in the shallow zone (Unit IV-b and IV-c denoted by blue and green lines), indicating almost no hydraulic connectivity between the producer hole (AT1-P3) and the monitoring boreholes.
Meanwhile, during the AT1-P2 operation, the P and T data of the shallow zone (Unit IV-b and IV-c) of both the monitoring holes exhibited rapid responses. The responses in the deep zone (Unit V), however, were slower and less significant in AT1-MT2, and no change occurred in AT1-MT3. This indicates a weak hydraulic connectivity between AT1-P2 and AT1-MT3. The important observations in the Unit V data of the AT1-MT2 well are the gradual recovery in the P and T curves during the constant drawdown period and the rapid pressure recovery when elapsed time t ∼ 1150 h. This latter effect was accompanied by a quick change in the hydraulic conditions around the monitoring hole and may be caused by an increase in water supply from the surrounding formations.
Pressure responses between producer and monitoring boreholes
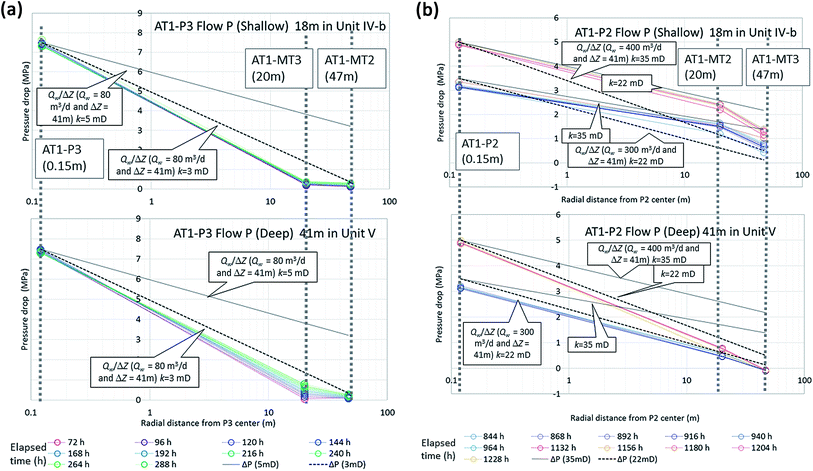
To denote the detailed pressure responses, Fig. 18 shows the advances in the pressure drops in the producer and monitoring holes in the spatial domain. To aid understanding, the figures are associated with the theoretical pressure gradient under static conditions . The pressure gradients were calculated with a constant water flow rate Qw/ΔZ [where Qw = 80 m3 per day (AT1-P3), 300 m3 per day (AT1-P2 when p0 = 10 MPa) and 400 m3 per day (AT1-P2 when p0 = 8 MPa), ΔZ = 41 m (AT1-P3) and 45.4 m (AT1-P2)]. The viscosity of water, μ (1 × 10⁻³ Pa s), with various assumed permeabilities, k [5 and 3 milli darcy (md) = 5 and 3 × 10⁻¹⁵ m2 in the AT1-P3 production case, and 35 and 22 md (35 and 22 × 10−15 m2)].
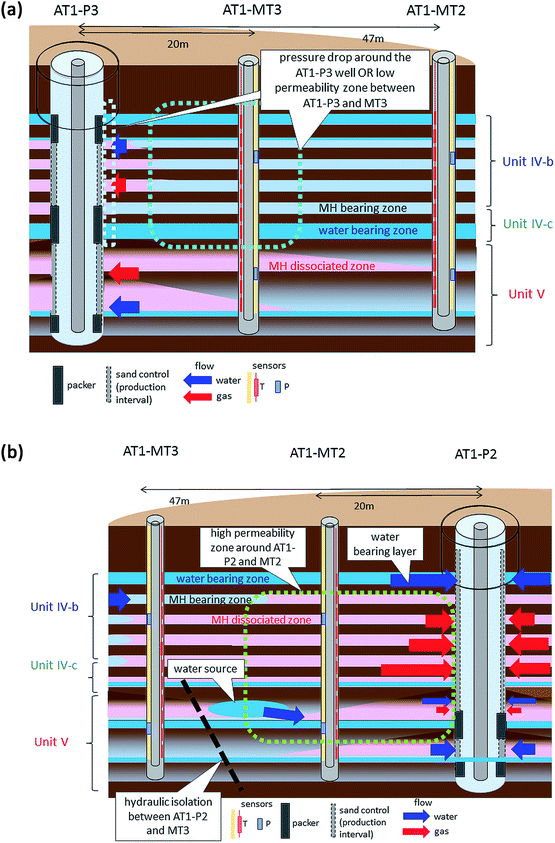
The AT1-P3 data in both the upper and the lower sections can be interpreted as the normal behavior of a low-permeability formation. Meanwhile, the AT1-P2 data are more complicated because the downhole pressure of the producer hole varied. However, by focusing on the time of constant bottom-hole pressure (t = 800–1050 h at 3 MPa drawdown and t = 1100–1180 h at 5 MPa drawdown), the pressure at the nearest monitoring hole (AT1-MT2) soon stabilized, indicating high permeability there. Meanwhile, the data from the farther well (AT1-MT3) did not change much, and corresponding observations suggest that the AT1-P2 and AT1-MT2 boreholes were hydraulically connected with a local high-permeability domain in the upper section.
Inferred fluid motion and MH dissociation in the reservoir
The actual gas and water production and the P–T behaviors observed in the boreholes could provide plenty of information about the gas hydrate dissociation process in a real reservoir; however, there are still plenty of unknowns. Here, we attempt to answer the aforementioned questions and the remaining questions are defined.Differences in the production behavior among wells
The difference in the gas production behavior between the AT1-P3 and AT1-P2 wells can be attributed to different gas production intervals, i.e., Unit V in AT1-P3 and Unit IV-b in AT1-P2. More specifically, the different response of Unit IV-b was the main reason for the different production behavior. However, we have not observed a particular reason why the Unit IV-b of AT1-P3 was not productive.The depressurized condition of AT1-P3 clearly did not propagate as fast as expected, and the fluid conductivity in the interval around AT1-P3 was low. However, it is not clear whether this low fluid conductivity was intrinsic to the reservoir geology. Some near-wellbore phenomena, such as the pressure loss across the near-wellbore zone (the skin effect) may be considered as possible reasons for the poor productivity of the upper section of the AT1-P3 well. Some mechanical effects such as the collapse of the wellbore surface owing to an enlarged hole, the plugging of sand-control by fines, and the compaction of the device and formation because of stresses can be attributed to the low apparent permeability.
To investigate the effect of the sand-control device, we attempted to recover the completion system of the AT1-P3 well via the wash-over operation prior to the well P&A job. However, this approach failed because significant hole enlargement could be observed during the operation and because the wash-over pipe could not catch the casing. Therefore, the possibility of the negative impact of the sand-control device and the near-wellbore effect is still an open question. Fortunately, a series of pressure core samples were obtained from the new boreholes (AT1-CW1/CW2) drilled near AT1-P2 and P3, which will provide us direct petrophysical information33 that may help us to answer the questions about the hydraulic parameters and mechanical effects through laboratory tests.
From the viewpoint of the gas production rate, the performance of AT1-P2 was as good as AT1-P as denoted in Fig. 12(b) and 13(b), and it can be expected that a similar drawdown could be achieved. Similar or high gas production rates could be given, however, the rate may not increase as expected. The relatively low MH saturation of AT1-P2 should cause both high gas production performance and excess water production that will interfere with stable depressurization.
Constraint gas-hydrate-dissociated domain and the non-increasing trend of gas production
From the combination of the monitoring and production data, the motion of the original pore water should play an important role in the MH dissociation and gas production behaviors in the tests conducted in 2017 and 2013. In all the boreholes, the increasing trends of GWR and chloride-ion concentration indicate an increase in non-MH related pore water production over time even during a constant drawdown. It can be assumed that the dynamic changes in hydraulic features, such as MH dissociation and/or the mechanical responses of weak and unconsolidated formations could yield new pathways between the producer hole and water sources.The most distinctive example of this effect was the strong water influx observed after sand production in 2013, which was assumed to be caused by the creation of a wormhole-like water pathway following the displacement of the formation solids. In the 2017 test case, no drastic change similar to that in 2013 was observed; however, some gradual alteration of the formation character may have enhanced the hydraulic conductivity between the producer hole and the water sources. The temperature increase detected by the sensors in Unit V observed at t ∼ 750 h and the rapid pressure response that occurred at 1150 h in the AT1-MT2 well were clear examples of this effect as well as the increased GWR. It should be noted that fluid conduits between AT1-P2 and the previously operated AT1-P3 were created; however, the hydraulic connectivity between AT1-P3 and AT1-MT2 was not significant.
Along with such dynamic changes in permeability, lateral heterogeneity and the continuity of MH saturation may contribute to the water production behavior. According to the analysis of the seismic amplitude of reflection at the top of MHCZ as depicted in Fig. 1 and 2, the MH saturation of Unit IV-b was relatively low, and the value was lower in the adjacent zone east of the well; therefore, more water influx can be expected as the MH dissociation advanced further.
Furthermore, the reality of the complicated features of the gas–liquid mixed-phase flow, such as relative permeability, and the thermal properties, such as the contribution of silt layers as heat sources, may be different from that in the relatively simple models considered above.
Those observations and interpreted situations around AT1-P3 and AT1-P2 boreholes are summarized as schematics in Fig. 19. It should be noted that the well-completion design and a packer setting depth that did not cover the water-producing Unit IV-b zone might affect the measured water production data.
Energy return for input
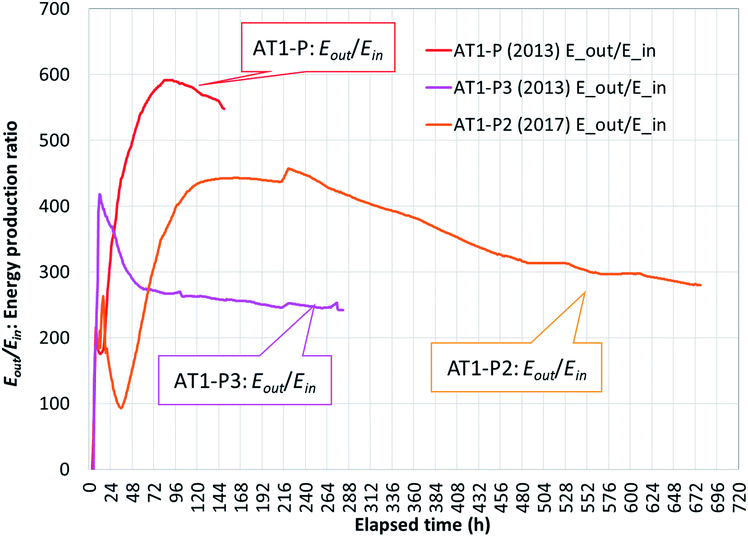
As supplemental information, the energy efficiency of the production tests was calculated because it is the most important factor determining the effectiveness of the energy supply system. In the case of the MH, the efficiency value should be lower than that of the self-erupting conventional energy because of no driving mechanism (overpressure). Furthermore, due to the endothermic nature of dissociation and the necessity that any kind of thermal energy should be provided as input to generate gas, with a depressurization method that uses no artificial thermal energy, we can expect some return of positive energy on the energy input. Here, we define the energy return on input using the depressurization method as the ratio between the combustion heat of the produced gas (Eout) and the work conducted to cause depressurization by displacing water (Ein). The energy input Ein (i.e., the consumed energy) is
 | (1) |
 | (2) |
The temporal advances of the ratios of the output and input  of three offshore boreholes are depicted in Fig. 20. Although the total energy returns on input were still considerably larger than 1
  , they exhibited a slight decrease during the later stage of gas production. This behavior is related to GWR; however, the low-GWR AT1-P2 is in a similar efficiency range as the high-GWR AT1-P well because the high gas production rate was achieved using a low degree of drawdown.
Conclusions and further actions
Although some technical problems such as a sanding issue and an unexpectedly high water flow rate hindered some parts of the planned test, the second offshore production test of MH in the eastern Nankai Trough in 2017 did yield high-quality data. The obtained data include the gas- and water production rates and the P–T conditions in the producer and monitoring boreholes during a total of 36 days of depressurization and gas production operations in the two producers. Despite some remaining technical concerns such as the liability of the sand-control device, the operational history showed that several weeks of depressurization operation are possible from MH deposits under the seafloor using a floating drilling vessel using improved subsea and subsurface devices.Some advanced techniques in the monitoring and data-acquisition were employed, particularly regarding the pressure distribution data in the producer wells and the pressure-sensing data in the monitoring boreholes. The data obtained revealed clearer views of the advance of MH dissociation and the fluid flow behind it. The obtained gas/water flow and P–T data were compared with seismic and log-derived information about the reservoir characteristics.
The significant discrepancies in the production behaviors of the two producer boreholes and the evaluated gas/water production zones showed quite heterogeneous responses to the depressurization. Further, the temporal advances of the methane-hydrate dissociation were different from the model-predicted incremental characteristics.
The energy return values on the input of the production tests in the reservoir were considerably larger than 1 (>100). However, the test results and monitoring data reveal the limitations on the productivity obtained by applying depressurization to the hydraulically complex reservoirs.
We need to understand the mechanism that obstructed the spatial advance of the methane hydrate dissociation zone and increment of gas production rate. For technically and commercially feasible gas production from MH deposits, countermeasures to the possible obstacles need to be developed. The hydraulic discontinuity of the reservoir by compartmentalization and continuity through water sources may play an important role in the production behavior as well as the dynamic changes in the hydraulic character, such as creation of fluid pathways. Some measures to isolate water-bearing zones from the production zone will also constitute an important technology. Further, the survey techniques on water-bearing zones should be investigated as well.
Moreover, the time-dynamic nature of the reservoir characteristics, including the compaction and migration of fine particles to wells, could impede efficient gas production. To increase productivity and to avoid problems, countermeasures, such as well-stimulation measures, should be applied to the obstacles.
In this study, the hydraulic part of the reservoir characters and responses were considered to be the focus; however, the thermal phenomena will also influence the production parameters, such as the effectiveness of heat transport, from adjacent formations. Geochemistry, particularly the salinity of the formation fluid, is another factor related to the efficiency of gas production. Further investigations of such phenomena through analyses of obtained data and laboratory studies are necessary. Along with geophysical log data obtained from the producer and monitoring holes, some new data and samples were taken from the two newly drilled boreholes (AT1-CW1/CW2).33
To understand the phenomena in the reservoir, a comprehensive review of the reservoir characteristics from log, core and seismic data, and history matching efforts using numerical models are necessary. The current analysis is still in the preliminary stage, and integrating the following two approaches is required. (i) The inductive approach using models built from the seismic, core, and log-derived reservoir characteristics and numerical simulations; (ii) the deductive approach using data from flow tests may help to understand the response of a methane-hydrate reservoir.
Almost at the same time as our 2017 operation, China conducted a flow test from a MH reservoir in the South China Sea in 2017,40 and sixty-day long production data were added to the history of the study on MH. As a Japan–US collaborative project, an onshore production aimed at realizing one-year-long flow testing is planned to obtain longer-term production data under simpler and well-controlled conditions with lower cost and better operational flexibility. A strat-test well drilling in Alaska for the test was completed in December 2018.41 The techniques used and the knowledge obtained from the present offshore tests will be employed in that future onshore test. After analyzing the data taken by onshore and offshore attempts and resolving issues surfaced during the flow tests, a longer flow to evaluate realistic economics should be planned.
Appendix 1 calculation of the water and gas origins from the density and GWR information
The origin of the produced water and gas can be calculated by the following procedure. Given that the solubility of methane in water at 13 MPa and 13 °C is 0.12 mol kg−1 (Duan group software42), we obtained a GWR of 2.76 from the dissolved gas; meanwhile, the GWR from the methane-hydrate-dissociated gas and water is 200. Using these values, the gas and water production rates from the original pore fluid (Qporeg and Qporew, respectively) and the methane-hydrate dissociation (QMHg and QMHw, respectively) can be calculated by solving
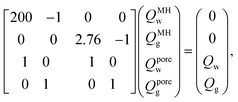 | (A1-1) |
![[thin space (1/6-em)]](https://www.rsc.org/images/entities/char_2009.gif) 000 m3 per day and Qw = 300 m3 per day (AT1-P2), (Qporeg, Qporew) and (QMHg, QMHw) can be derived as follows:
000 m3 per day and Qw = 300 m3 per day (AT1-P2), (Qporeg, Qporew) and (QMHg, QMHw) can be derived as follows:
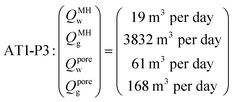 | (A1-2) |
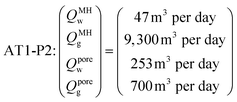 | (A1-3) |
Appendix 2 Calculation of the gas and water influxes from each interval
The P–T data were obtained from the producer holes (AT1-P3 and AT1-P2). To quantify the gas and water production rates, we calculated the gas and water inflow fluxes for each interval between sensors (q(g)in, q(w)in) using the following procedure. Considering the section N between the P–T sensors n and n + 1, the conservations of heat and mass are formulated as
 | (A2-1) |
 | (A2-2) |
Tn and Pn are the temperature and pressure, respectively, at sensor n. T(g)in(N) and T(w)in(N) are the temperatures of the influx gas and water, respectively, at section N. q(g)n and q(w)n are the upward gas and water fluxes at sensor n. c(g)p (0.066 MJ K−1 m−3 under ambient conditions) and c(w)p (4.186 MJ K−1 m−3) are the heat capacities of gas and water, respectively. ρN is the fluid density at section N, z is the depth, Δz is the sensor interval, and ρw (1030 kg m−3) and ρg (0.656 kg m−3 under ambient conditions) are the densities of water and gas, respectively. rs denotes the ratio of gas and water velocities in the flowline that governs the gas fraction remaining in the water column and is calculated as
 | (A2-3) |
 | (A2-4) |
 | (A2-5) |
| T(w)in = T0z. | (A2-6) |
The optimum solutions of (q(g)in, q(w)in) that satisfy eqn (A2-1), (A2-2), and (A2-4) are computed using the optimization processes described by Yamamoto et al.19 based on the measured P–T data in the producer holes during certain moments.
Conflicts of interest
There are no conflicts to declare.Acknowledgements
This study was part of the activities of MH21 Research Consortium funded by the Ministry of Economy, Trade and Industry (METI); organized by the Japan Oil, Gas and Metals National Corporation (JOGMEC) and National Institute of Advanced Industrial Science and Technology. The authors would like to thank those involved in the system development, data acquisition, and analysis. In particular, the authors are grateful to Mr Shigeru Suzuki, Mr Takayuki Kanno, Mr Masanobu Ando, Mr Haowei Tan, Mr Takashi Kuno, and Mr Soon Seong Chee. The MH21 working groups for analyzing the production test data (WG1 and WG2) helped us analyze and understand the data. The production tests and data-acquisition operations were conducted in association with the D/V Chikyu drilling and navigation crew, the Japan Petroleum Exploration Co., Ltd. (JAPEX), the Japan MH Operating Co., Ltd. (JMH), Japan Drilling Company, Mantle Quest Japan Co., Ltd. (MQJ), and Halliburton companies, with Schlumberger and Baker Hughes, a GE company.Notes and references
- A. H. Johnson, Global Resource Potential of Gas Hydrate – A New Calculation, Fire in the Ice, DOE-NETL newsletter, 2011, vol. 11, 2, pp. 1–4 Search PubMed
.
- M. Frye, Preliminary evaluation of in-place gas hydrate resources: Gulf of Mexico Outer Continental Shelf, OCS Report MMS 2008-004, Minerals Management Service, Resource Evaluation Division, 2008 Search PubMed
.
- T. S. Collett, W. F. Agena, M. W. Lee, M. V. Zyrianova, K. J. Bird, T. C. Charpentier, D. W. Houseknect, T. R. Klett, R. M. Pollastro and R. M. Schenk, Assessment of gas hydrate resources on the North Slope, Alaska, U.S. Geological Survey Fact Sheet 2008-3073, 2008, p. 4 Search PubMed
.
- T. Fujii, T. Saeki, T. Kobayashi, T. Inamori, M. Hayashi, O. Takano, T. Takayama, T. Kawasaki, S. Nagakubo, M. Nakamizu and K. Yokoi, Resource Assessment of Methane Hydrate in the Eastern Nankai Trough, OTC-19310-MS, Japan, 5–8 May, 2008 Search PubMed.
- R. Boswell and T. S. Collett, Current Perspectives on Gas Hydrate Resources, Energy Environ. Sci., 2011, 4, 1206–1215 RSC
.
- R. Boswell, K. Yamamoto, S.-R. Lee, T. S. Collett, P. Kumar, and S. Dallimore, Methane hydrates, in Future Energy: Improved, Sustainable and Clean Options for our Planet, ed. M. Letcher, Elsevier, London, UK 225, 2nd edn, 2014, ch. 8, pp. 159–178 Search PubMed
.
- Iu. F. Makogon and Y. F. Makogon, Hydrates of Hydrocarbons, Pennwell Corp, 1997 Search PubMed
.
- E. D. Sloan Jr and C. Koh, Clathrate Hydrates of Natural Gases, CRC Press, 3rd edn, 2007 Search PubMed
.
- G. J. Moridis, M. B. Kowalsky and K. Pruess, Depressurization-induced gas production from class-1 hydrate deposits, SPE Reservoir Eval. Eng., 2007, 10, 458–481 CrossRef CAS
.
- K. Yamamoto, Production techniques for methane hydrate resources and field test programs, J. Geogr., 2009, 118(5), 913–934 CrossRef CAS
.
- Y. Konno, Y. Masuda, Y. Hariguchi, Y. M. Kurihara and H. Ouchi, Key Factors for Depressurization-Induced Gas Production from Oceanic Methane Hydrates, Energy Fuels, 2010, 24(3), 1736–1744 CrossRef CAS
.
- M. Kurihara, H. Ouchi, H. Narita and Y. Masuda, Gas production from methane hydrate reservoirs, Proceedings of the 7th International Conference on Gas Hydrates (ICGH 2011), Edinburgh, Scotland, United Kingdom, July 17–21, 2011 Search PubMed
.
- S. H. Hancock, T. S. Collett, S. R. Dallimore, T. Satoh, T. Inoue, E. Huenges and B. Weatherill, Overview of thermal stimulation production-test results for the JAPEX/JNOC/GSC et al. Mallik 5L-38 gas hydrate production research well, in Scientific Results from the Mallik 2002 Gas Hydrate Production Well Program, Mackenzie Delta, Northwest Territories, Canada, ed. T. S. Dallimore and T. S. Collett, Geological Survey of Canada Bulletin, 2005, vol. 585, p. 135 Search PubMed
.
- S. H. Hancock, S. R. Dallimore, T. S. Collett, D. Carle, B. Weatherill, T. Satoh and T. Inoue, Overview of pressure-drawdown production test results for the JAPEX/JNOC/GSC et al. Mallik 5L-38 gas hydrate production research well, in Scientific Results from the Mallik 2002 Gas Hydrate Production Well Program, Mackenzie Delta, Northwest Territories, Canada, ed. S. R. Dallimore and T. S. Collett, Geological Survey of Canada Bulletin, 2005, vol. 585, p. 134 Search PubMed
.
- S. R. Dallimore and T. S. Collett, Summary and implications of the Mallik 2002 gas hydrate production research well program, in Scientific Results from the Mallik 2002 Gas Hydrate Production Well Program, Mackenzie Delta, Northwest Territories, Canada, ed. S. R. Dallimore and T. S. Collett, Geological Survey of Canada Bulletin, 2005, vol. 585, pp. 1–36 Search PubMed
.
- S. R. Dallimore, J. F. Wright, K. Yamamoto and G. Bellefleur, Proof of concept for gas hydrate production using the depressurization technique, as established by the JOGMEC/NRCan/Aurora Mallik 2007-2008 Gas Hydrate Production Research Well Program, in Scientific results from the JOGMEC/NRCan/Aurora Mallik 2007-2008 gas hydrate production research well program, Mackenzie Delta, Northwest Territories, Canada, ed. S. R. Dallimore, K. Yamamoto, J. F. Wright and G. Bellefleur, Geological Survey
of Canada, Bulletin, 2012, vol. 601, pp. 1–15 Search PubMed
.
- K. Yamamoto, Y. Terao, T. Fujii, T. Ikawa, M. Seki, M. Matsuzawa and T. Kanno, Operational overview of the first offshore production test of methane hydrates in the eastern Nankai Trough, 2014, Offshore Technology Conference, Houston, Texas, USA, 5–8 May 2014 Search PubMed
.
- M. Matsuzawa, Y. Terao, B. Hay, L. Wingstrom, M. Duncan and I. Ayling, A completion system application for the world's first marine hydrate production test, 2014 Offshore Technology Conference, Houston, Texas, 05–08 May, 2014 Search PubMed
.
- K. Yamamoto, T. Kanno, X.-X. Wang, M. Tamaki, T. Fujii, S.-S. Chee, X.-W. Wang, V. Pimenov and V. Shako, Thermal responses of a gas hydrate-bearing sediment to a depressurization operation, RSC Adv., 2017, 7, 5554–5577 RSC
.
- Y. Konno, T. Fujii, A. Sato, K. Akamine, M. Naiki, Y. Masuda, K. Yamamoto and J. Nagao, Key findings of the world's first offshore methane hydrate production test off the coast of Japan: Toward future commercial production, Energy Fuels, 2017, 31(3), 2607–2616, DOI:10.1021/acs.energyfuels.6b03143
.
- H. Hong and M. Pooladi-Darvish, Numerical study of constant-rate gas production from in-situ gas hydrate by depressurization, in Scientific Results from the Mallik 2002 Gas Hydrate Production Well Program, Mackenzie Delta, Northwest Territories, Canada, ed. S. R. Dallimore and T. S. Collett, Geological Survey of Canada Bulletin, 2005, vol. 585, p. 138 Search PubMed
.
- M. Kurihara, M. Sato, H. Ouchi, H. Narita, Y. Masuda, T. Saeki and T. Fujii, Prediction of gas productivity from Eastern Nankai Trough methane-hydrate reservoirs, SPE Reservoir Eval. Eng., 2009, 12, 477–499 CrossRef CAS
(SPE125481).
- M. T. Reagan, G. J. Moridis, J. N. Johnson, L. Pan, C. M. Freeman, ·L. Pan, K. L. Boyle, N. D. Keen and J. Husebo, Field-Scale simulation of production from oceanic gas hydrate deposits, Transp. Porous Media, 2015, 108, 151–169, DOI:10.1007/s11242-014-0330-7
.
- N. Vedachalam, S. Ramesh, V. B. N. Jyothi, N. Thulasi Prasad, D. Sathianarayanan, R. Ramesh and G. A. Ramadass, Numerical modeling of methane gas production from hydrate reservoir of Krishna Godhavari basin by depressurization, Mar. Georesour. Geotechnol., 2019, 37(1), 14–22 CrossRef CAS
.
- Research group for production method and modeling, MH21, Achievement of FY H28 and plan of FY H29, Presentation for 32nd Kaihatsu Jisshi Kento-kai (Advisory committee meeting for MH21 program), http://www.meti.go.jp/committee/summary/0004108/pdf/032_06_02.pdf.
- K. Yamamoto, Y. Konno, X.-X. Wang, X.-W. Wang and T. Kanno, Thermal data analysis to investigate mass and heat transport during methane hydrate dissociation processes, Poromechanics VI: Proceedings of the Sixth Biot Conference on Poromechanics, ed. Vandamme, et al., ASCE Library, 2017, pp. 2049–2056, ISBN (PDF): 9780784480779 Search PubMed
.
- Research Consortium for Methane Hydrate Resources in Japan (MH21), Implementation Plan for Phase 2, 2009, http://www.mh21japan.gr.jp/english/wp/wp-content/uploads/c78678339b1ca272c59cb2b006dd244a1.pdf, (Cited 2016/06/06).
- T. Fujii, K. Suzuki, T. Takayama, M. Tamaki, Y. Komatsu, Y. Konno, J. Yoneda, K. Yamamoto and J. Nagao, Geological setting and characterization of a methane hydrate reservoir distributed at the first offshore production test site on the Daini-Atsumi Knoll in the eastern Nankai Trough, Japan, Mar. Pet. Geol., 2015, 66(2), 310–322 CrossRef CAS
.
- Y. Tsuji, T. Namikawa, T. Fujii, M. Hayashi, R. Kitamura, M. Nakamizu, K. Ohbi, T. Saeki, K. Yamamoto, T. Inamori, N. Oikawa, S. Shimizu, M. Kawasaki, S. Nagakubo, J. Matsushima, K. Ochiai and T. Okui, Methane-hydrate occurrence and distribution in the eastern Nankai Trough, Japan: Findings of the Tokai-oki to Kumano-nada methane-hydrate drilling program, in Natural gas hydrates-energy resource potential and associated geologic hazards, ed. T. Collett, A. Johnson, C. Knapp, and R. Boswell, AAPG Memoir, 2009, vol. 89, pp. 228–246 Search PubMed
.
- T. Fujii, The selection of the candidate location for the second offshore methane hydrate production test and geological findings from the pre-drilling operation, in the eastern Nankai Trough, Japan, 9th International Conference on Gas Hydrates, Denver, Colorado USA, June 25–30, 2017 Search PubMed
.
- M. Tamaki, T. Fujii and K. Suzuki, Characterization and prediction of the gas hydrate reservoir at the second offshore gas production test site in the eastern Nankai Trough, Japan, Energies, 2017, 10(10), 1678, DOI:10.3390/en10101678
.
- S. S. Chee, H. Tan, M. Ando, S. Pai, E. Yandon, K. Yamamoto and S. Suzuki, Accessing data from a deepwater sandface monitoring system using an autonomous, unmanned surface vehicle - Japan case study, Offshore Technology Conference Asia, Kuala Lumpur, Malaysia, 28617-MS OTC, 20–23 March 2018 Search PubMed
.
- K. Yamamoto, K. Suzuki, X.-X. Wang, T. Matsunaga, I. Nishioka, Y. Nakatsuka and J. Yoneda, The second offshore production test of methane hydrates in the eastern Nankai trough and site characterization efforts, Fire in the ice, NETL methane hydrate newsletter, 2019, vol. 19, 1, pp. 9–15 Search PubMed
.
- H. C. Kim, P. R. Bishnoi, R. A. Heidemann and S. S. H. Rizvi, Kinetics of methane hydrate decomposition, Chem. Eng. Sci., 1987, 42, 1645–1653 CrossRef CAS
.
- T. Gamo and J. Gieskes, Shipboard chemical analyses of sedimentary pore waters during the Ocean Drilling Program (ODP) Leg 131, Chikyu Kagaku (Nippon Chikyu Kagakkai), 1992, 26, 1–15 CAS
.
- K.-C. Kang, P. Linga, K.-N. Park, S.-J. Choi and J.-D. Lee, Seawater desalination by gas hydrate process and removal characteristics of dissolved ions (Na+, K+, Mg2+, Ca2 +, B3+, Cl−, SO42−), Desalination, 2012, 353(19), 84–90 Search PubMed
.
- P. Babu, A. Nambiar, T. He, I. A. Karimi, J.-D. Lee, P. Englezos and P. Linga, ACS Sustainable Chem. Eng., 2018, 6(7), 8093–8107 CrossRef CAS
.
- K. Egawa, O. Nishimura, E. S. Izumi, Y. Jin, M. Kida, Y. Konno, J. Yoneda, T. Ito, K. Suzuki, Y. Nakatsuka and J. Nagao, Bulk sediment mineralogy of gas hydrate reservoir at the East Nankai offshore production test site, Mar. Pet. Geol., 2015, 66(2), 2379–2387 Search PubMed
.
- K. Yamamoto, Production techniques for methane hydrate resources and field test programs, J. Geogr., 2009, 118(5), 913–934 CrossRef CAS
.
- J.-F. Li, J.-L. Ye, X.-W. Qin, H.-J. Qiu, N.-Y. Wu, H.-L. Lu, W.-W. Xie, J.-A. Lu, F.-E. Peng, Z.-Q. Xu, C.-H. Lu, Z.-G. Kuang, J.-G. Wei, Q.-Y. Liang, H.-F. Lu and B.-B. Kou, The first offshore natural gas hydrate production test in South China Sea, Zhongguo Dizhi, 2008, 1, 5–16 Search PubMed
.
- National Energy Technology Laboratory, Alaksa Project Update (GH testing in Alaska), Presentations from the October 18-19, 2018 Advisory Committee Meeting, Houston, TX, 2018, https://www.energy.gov/sites/prod/files/2018/11/f57/MHAC_AlaskaProjectUpdateFinal.pdf Search PubMed.
- Duan group software, http://models.kl-edi.ac.cn/models/h2o_ch4/index.htm.
Footnote |
| † Mark of Baker Hughes, a GE company. |
| This journal is © The Royal Society of Chemistry 2019 |

