 Open Access Article
Creative Commons Attribution 3.0 Unported Licence
Improvement of electric field-induced strain and energy storage density properties in lead-free BNKT-based ceramics modified by BFT doping
Pharatree Jaitaab,
Ratabongkot Sanjoomc,
Narumon Lertcumfua and
Gobwute Rujijanagul *ab
*ab
aDepartment of Physics and Materials Science, Faculty of Science, Chiang Mai University, Chiang Mai 50200, Thailand. E-mail: rujijanagul@yahoo.com
bScience and Technology Research Institute, Chiang Mai University, Chiang Mai 50200, Thailand
cDepartment of Applied Science and Biotechnology, Faculty of Agro-Industrial Technology, Rajamangala University of Technology Tawan-ok Chanthaburi Campus, Chanthaburi 22210, Thailand
First published on 16th April 2019
Abstract
In this research, the effects of Ba(Fe0.5Ta0.5)O3 (BFT) additive on the phase evolution, the dielectric, ferroelectric, piezoelectric, electric field-induced strain responses, and energy storage density of the Bi0.5(Na0.80K0.20)0.5TiO3–0.03(Ba0.70Sr0.03)TiO3 (BNKT–0.03BSrT) ceramics have been systematically investigated. The ceramics have been prepared by a solid-state reaction method accompanied by two calcination steps. X-ray diffraction indicates that all ceramics coexist between rhombohedral and tetragonal phases, where the tetragonal phase becomes dominant at higher BFT contents. The addition of BFT also promotes the diffuse phase transition in this system. A significant enhancement of electric field-induced strain response (Smax = 0.42% and  = 840 pm V−1) is noted for the x = 0.01 ceramic. Furthermore, the giant electrostrictive coefficient (Q33 = 0.0404 m4 C−2) with a giant normalized electrostrictive coefficient (Q33/E = 8.08 × 10⁻⁹ m5 C−2 V−1) are also observed for this composition (x = 0.01). In addition, the x = 0.03 ceramic shows good energy storage properties, i.e. it has a high energy storage density (W = 0.65 J cm−3 @ 120 °C) with very high normalized storage energy density (W/E = 0.13 μC mm−2), and good energy storage efficiency (η = 90.4% @ 120 °C). Overall, these results indicate that these ceramics are one of the promising candidate piezoelectric materials for further development for actuator and high electric power pulse energy storage applications.
Introduction
For actuator applications, electrostriction is an important property which describes how the material deforms when polarization develops inside.1 Electrostriction occurs in materials with either centro or noncentrosymmetric crystal structures, and is caused by a slight displacement of ions (or complexes) in the crystal lattice when the material is subjected to an applied field.2 In the case of electrostriction, the field-induced strain (S) can be simply related to the polarization (P) by: S = Q33P2, where Q33 represents the electrostrctive coefficient.2–5 A large Q33 value of ∼0.020 m4 C−2 with a good hysteresis-free electrostrictive strain (∼0.1%) can be observed in some lead-based relaxor ferroelectrics, such as Pb(Mg1/3Nb2/3)O3 (PMN),3 which is known as an important electrostrictive material.5 However, because of the concern for environmental problems that lead-based materials pose, the development of lead-free electrostrictive piezoelectric materials has been urgent in recent years.3,5,6Among many lead-free piezoelectric materials, (Bi0.5Na0.5)TiO3-based (BNT) ceramic is an interesting material due to its relatively excellent electrical properties, especially for ferroelectric and piezoelectric properties7 i.e. high electric energy densities8 and ultra-high strain under a high electric field (≥50 kV cm−1).9 However, the large coercive electric field (Ec = 7.3 kV mm−1) and high electrical conductivity made it difficult to be polarized during the poling process, which often leads to undesirable piezoelectricity (d33 = 73–95 pC N−1) and limited its applications.10 In order to reduce the Ec and/or improve the electrical properties, researches on composition-modified BNT systems have been conducted such as BNT–BT,11,12 BNT–ST,13 BNT–BZT–SBT,14 and BNT–BKT.15,16 Ullah et al.17 studied the effect of (Ba0.70Sr0.30)TiO3 (BST) on the structure and electrical properties of the Bi0.5(Na0.40K0.10)TiO3 (BNKT) ceramic. They reported that this ceramic exhibited good electrical properties i.e. the ceramics presented high piezoelectric coefficient (d33 = 223 pC N−1) with dielectric loss (tan![[thin space (1/6-em)]](https://www.rsc.org/images/entities/char_2009.gif) δ) of 3% at 1 kHz. They also found that the La additive interrupted the P–E hysteresis loops of the BNKT–BST ceramics, which lead to a reduction in Pr and Ec values.18 However, the destabilization of the ferroelectric order corresponded to a significant increase of the unipolar strain which showed the highest value of ∼0.39% and corresponding a normalized strain
δ) of 3% at 1 kHz. They also found that the La additive interrupted the P–E hysteresis loops of the BNKT–BST ceramics, which lead to a reduction in Pr and Ec values.18 However, the destabilization of the ferroelectric order corresponded to a significant increase of the unipolar strain which showed the highest value of ∼0.39% and corresponding a normalized strain  of 650 pm V−1.18 Therefore, research on modified BNKT–BST ceramics is an important topic in order to develop lead-free ceramics with high electrical properties.
An interesting work for electrostrictive materials was performed by Zhang et al.19 who provided a research direction to develop the (1 − x)[0.94Bi0.5Na0.5TiO3–0.06BaTiO3]–xK0.5Na0.5NbO3 system with a large electrostrictive coefficient (Q33 ∼ 0.021–0.027 m4 C−2) and the maximum strain (Smax ∼ 0.12–0.30%) values simultaneously. Beside Zhang et al.'s work, a large electrostrictive effect with Q11 = 0.0297 m4 C−2 was also obtained by Shi et al.20 in the (0.94 − x)(Bi0.5Na0.5)TiO3–0.06BaTiO3–x(Sr0.7Bi0.2□0.1)TiO3 system, in which its Q11 exhibits a high temperature stability between ambient temperature to 180 °C.20 Moreover, a high strain (Smax ∼ 0.45%) was also found in the (Bi0.5Na0.5)TiO3–BaTiO3–(K0.5Na0.5)NbO3 or BNT–BT–KNN ceramic by Zhang et al.,21 which is even higher than the strain value obtained in the lead ferroelectric Pb(Zr,Ti)O3 ceramic. However, due to the phase evolution in BNT-based materials, large strain hysteresis larger than 60% can be observed inherently, which restricts the practicability use as electrostrictive materials.4 Thus research on the reduction of the strain hysteresis for the lead-free materials such as BNKT–BST based materials is an interesting issue for the lead-free actuators.
Recently, many authors have suggested that the iron oxide such as Fe2O3 additive can improve the piezoelectric and magnetic properties of some lead-free piezoelectric ceramics.22,23 In the case of piezoelectric properties, Jaita et al.23 reported that the Fe2O3 additive can enhance the electric field-induced strain of BNKT-based ceramics. However, the electrostriction and electric field-induced strain properties of lead-free piezoelectric materials such as BNT-based ceramics doped with complex perovskite materials containing Fe have not been widely investigated. For the Fe-containing complex perovskite material, i.e. barium iron tantalate (BaFe0.5Ta0.5O3; BFT) is interesting because it exhibits a giant dielectric material which has attracted great attention due to its very high dielectric constant (εr ∼ 1.9 × 10⁵ at 550 °C and 1 kHz).24 Many works have reported that BFT, which was first synthesized by Galasso et al.,25 presents a cubic perovskite-type structure with space group Pm![[3 with combining macron]](https://www.rsc.org/images/entities/char_0033_0304.gif) m (221)24–26 and the lattice parameter a = 4.056 Å.24,27 BFT can be used to modify other materials such as BiFeO3
m (221)24–26 and the lattice parameter a = 4.056 Å.24,27 BFT can be used to modify other materials such as BiFeO3![[thin space (1/6-em)]](https://www.rsc.org/images/entities/char_2009.gif) 24 and Ba(Zr0.05Ti0.95)O3 (BZT),27 and the properties of the modified ceramics have been improved. For example, the dielectric constants of the BZT–BFT solid solution were enhanced by BFT.28
24 and Ba(Zr0.05Ti0.95)O3 (BZT),27 and the properties of the modified ceramics have been improved. For example, the dielectric constants of the BZT–BFT solid solution were enhanced by BFT.28
In the present research, new lead-free of Bi0.5(Na0.80K0.20)0.5TiO3–0.03(Ba0.70Sr0.03)TiO3 doped with Ba(Fe0.5Ta0.5)O3 ceramics were synthesized with the aim of improving their electrical properties. The role of BFT content on the ceramic properties including phase formation, microstructure, electrical properties (i.e. dielectric, ferroelectric and piezoelectric, and the electric field-induced strain behavior) of the BNKT–0.03BSrT ceramic were investigated. Furthermore, since many recent works have focused on energy storage materials due to global energy problems, thus the storage energy density behavior of the presented ceramics was also investigated.
Experimental
The conventional mixed oxide technique was used to synthesize the (1 − x)[Bi0.5(Na0.80K0.20)0.5TiO3–0.03(Ba0.70Sr0.03)TiO3]–xBa(Fe0.5Ta0.5)O3 or (1 − x)[BNKT–0.03BSrT]–xBFT powders. The analytical grade reagents of metal oxide powders, including Na2CO3, Bi2O3, K2CO3, TiO2, Fe2O3, SrCO3, BaCO3, and Ta2O5 were used as starting materials. All carbonate powders were first dried at 120 °C for 24 h in order to eliminate any moisture. The raw materials of BNKT–0.03BSrT and BFT were stoichiometrically weighed, ball milled for 24 h in an ethanol solution, and then dried in an oven. Since there is a large difference in calcination temperatures between BNKT–0.03BSrT (900 °C) and BFT (1200 °C) powders, two calcination steps were employed i.e. the BNKT–0.03BSrT and BFT powders were synthesized separately. The resulting powders were weighed, mixed and then dried to obtained a powder of (1 − x)[BNKT–0.03BSrT]–xBFT with x = 0, 0.0, 0.02 and 0.03 mol fraction. A few drops of polyvinyl alcohol (PVA) binders (4 wt%) were added to the obtained powders before being uniaxially pressed into discs 10 mm in diameter. The green pellets were sintered at 1125 °C for 2 h by using a heating and cooling rate of 5 °C min−1.Bulk density was determined by the Archimedes' method. A scanning electron microscope (SEM, JEOL JSM-6335F) was used to study microstructural features of the ceramics. An X-ray diffractometer (XRD-Phillip, X-pert) was used to study the phase evolution of all ceramics. Grain size of the ceramics was carried out by using linear intercept method (ASTM no. E112-88). Before investigating the electrical measurements, all samples were polished into a parallel surface with 1 mm thickness. Silver paste was subjected onto both sides of the sample. Then the samples were heated at 700 °C for 30 min to form electrodes. Dielectric properties as a function of temperature (25–400 °C) were carried out using a LCR-meter (HP model 4192A) at frequencies ranging from 1 to 1000 kHz. The ferroelectric properties were carried out by a Radiant Precision ferroelectric tester both at room temperature (RT) and high temperatures (HT) of 25–150 °C. A maximum electric field of 50 kV cm−1 at a frequency of 1 Hz was applied to each studied sample. Remanent polarization (Pr), maximum polarization (Pmax), and coercive field (Ec) values were determined from the hysteresis loops or P–E loops. By using data from ferroelectric properties, the energy storage density (W) and energy storage coefficient (η) values were also calculated. Strain–electric field (S–E) data at RT were carried out using an optical displacement sensor (Fotonic Sensor model MTI-2100) injunction with a Radiant ferroelectric test system. A maximum electric field of 50 kV cm−1 and a frequency of 0.1 Hz were used to measure the bipolar and unipolar strain curves. The maximum strain (Smax) and the negative strain (Sneg) values were carried out from the bipolar curve. The normalized strain coefficient  was also determined following:
  The electrostrictive coefficient (Q33) was determined from S–P curves using equation: S = QP2. For piezoelectric measurement, all samples were poled at RT with an applied DC electric field of 5 kV mm−1 (for 15 min) and using silicone oil as the media. The low-field piezoelectric coefficient (d33) was determined by a d33-meter.
Results and discussion
Phase formation and microstructure
Fig. 1(a) shows the X-ray diffraction patterns with different doping contents of the (1 − x)[BNKT–0.03BSrT]–xBFT ceramics. Within the resolution limit of XRD, all ceramics exhibit a single phase of perovskite structure with no secondary phase, confirming that BFT has been incorporated into the BNKT–0.03BSrT lattice to form solid solutions of the end compounds. For analyzing the phase transition process, the XRD patterns for selected narrow angular ranges of 2θ = 39–41° and 2θ = 44–48° are presented in Fig. 1(b) and (c), respectively. The x = 0 ceramic presents a mixed phase of rhombohedral and tetragonal structure, which is demonstrated by a slight splitting of the (111)R/(1![[1 with combining macron]](https://www.rsc.org/images/entities/char_0031_0304.gif) 1)R at 2θ ∼ 40° and splitting of the (200)T/(002)T peaks at 2θ ∼ 46°. This result also agrees with the result observed by Ge et al.6 However, the coexistence of the mixed rhombohedral and tetragonal phases transforms into a tetragonal-rich phase at higher BFT contents. This can be evidenced by, the existence of the splitting (200)T/(002)T peaks, and the merger of the (111)R/(1
1)R at 2θ ∼ 40° and splitting of the (200)T/(002)T peaks at 2θ ∼ 46°. This result also agrees with the result observed by Ge et al.6 However, the coexistence of the mixed rhombohedral and tetragonal phases transforms into a tetragonal-rich phase at higher BFT contents. This can be evidenced by, the existence of the splitting (200)T/(002)T peaks, and the merger of the (111)R/(1![[1 with combining macron]](https://www.rsc.org/images/entities/char_0031_0304.gif) 1)R peak into a single (111)PC peak, thus indicating that the amount of tetragonal phase is higher than that of the rhombohedral phase, with increasing BFT content. To check the appearance of the phase transformation in more detail, the tetragonality ratio (c/a) was determined and its values are listed in Table 1. The c/a value increases from 1.0105 for the x = 0 ceramic to 1.0128 for the x = 0.03 ceramic, as expected. Furthermore, the diffraction peaks gradually shift to a lower angle with increasing BFT content. This can be caused by the differences in the ionic radii between Na+, Bi3+, K+, Sr2+, and Ba2+ at the A-site and Ti4+, Fe3+, and Ta5+ at the B-site29 which, as a result, can induce a structural distortion such as an enlargement of unit cell size, as shown in Fig. 2. A similar peak slightly shifted by partial substitution of Ba2+ for [Bi0.5(Na0.80K0.20)]2+ and Zr4+ for Ti4+ was reported by Chen et al.30 in the BNKT–BZT system. They also found that the (110) peak shifted to lower 2θ angles could produce an increase in the lattice constant and the unit cell dimension with increasing BZT fraction.
1)R peak into a single (111)PC peak, thus indicating that the amount of tetragonal phase is higher than that of the rhombohedral phase, with increasing BFT content. To check the appearance of the phase transformation in more detail, the tetragonality ratio (c/a) was determined and its values are listed in Table 1. The c/a value increases from 1.0105 for the x = 0 ceramic to 1.0128 for the x = 0.03 ceramic, as expected. Furthermore, the diffraction peaks gradually shift to a lower angle with increasing BFT content. This can be caused by the differences in the ionic radii between Na+, Bi3+, K+, Sr2+, and Ba2+ at the A-site and Ti4+, Fe3+, and Ta5+ at the B-site29 which, as a result, can induce a structural distortion such as an enlargement of unit cell size, as shown in Fig. 2. A similar peak slightly shifted by partial substitution of Ba2+ for [Bi0.5(Na0.80K0.20)]2+ and Zr4+ for Ti4+ was reported by Chen et al.30 in the BNKT–BZT system. They also found that the (110) peak shifted to lower 2θ angles could produce an increase in the lattice constant and the unit cell dimension with increasing BZT fraction.
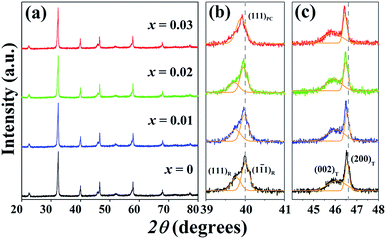 | ||
| Fig. 1 X-ray diffraction patterns of the (1 − x)[BNKT–0.03BSrT]–xBFT ceramics where (a) 2θ = 20–80° (b) 2θ = 39–41° and (c) 2θ = 44–48°. | ||
| x | Density (g cm−3) | Relative density (%) | c/a | Unit cell volume (Å3) | Grain size (μm) | Tm (°C) | εmax (@1 kHz) | δγa (K) | δγb (K) |
|---|---|---|---|---|---|---|---|---|---|
| a Poled sample.b Unpoled sample. | |||||||||
| 0 | 5.80 | 98 | 1.0105 | 60.18 | 0.61 | 316 | 5156 | 83 | 73 |
| 0.01 | 5.83 | 98 | 1.0117 | 60.28 | 0.59 | 303 | 5151 | 91 | 94 |
| 0.02 | 5.85 | 99 | 1.0121 | 60.43 | 0.58 | 292 | 4814 | 94 | 117 |
| 0.03 | 5.86 | 99 | 1.0128 | 60.46 | 0.56 | 284 | 4716 | 105 | 123 |
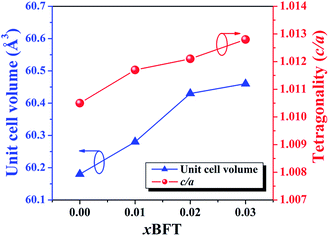 | ||
| Fig. 2 Plots of unit cell volume and the tetragonality (c/a) as functions of BFT content of the (1 − x)[BNKT–0.03BSrT]–xBFT ceramics. | ||
SEM micrographs and their corresponding histogram of grain size distribution of the (1 − x)[BNKT–0.03BSrT]–xBFT ceramics are shown in Fig. 3. The average grain size values are also summarized in Table 1. The SEM result confirms that all samples are dense with relatively high densities (5.80–5.86 g cm−3). Furthermore, the porosity levels evident in the micrographs are noted to be consistent with the trend of measured density value, where the density increases with increasing BFT content. Most grains of all samples show a clear grain boundary with round and cubic shapes. The addition of BFT seems to have a slight influence on the microstructure as well as the average grain size of the BNKT–BSrT ceramics. The average grain size values of all samples are rather similar (0.56–0.61 μm) and the grain size distribution shows a monomodal normal distribution. However, a slight narrow grain size distribution is noted for a ceramic containing a higher amount of BFT. This suggests that the microstructure can be improved by a BFT additive.
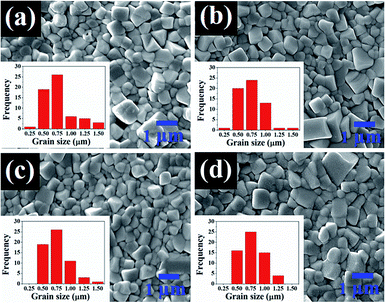 | ||
| Fig. 3 SEM micrographs and their corresponding histograms of grain size distribution of the (1 − x)[BNKT–0.03BSrT]–xBFT ceramics where (a) x = 0, (b) x = 0.01, (c) x = 0.02, and (d) x = 0.03. | ||
Dielectric properties
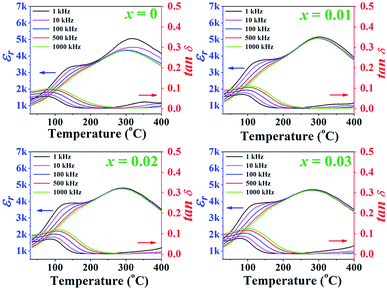
Temperature dependence of the dielectric properties, including constant (εr) and dielectric loss (tan![[thin space (1/6-em)]](https://www.rsc.org/images/entities/char_2009.gif) δ) of the poled (1 − x)[BNKT–0.03BSrT]–xBFT ceramics measured at different frequencies from 1–1000 kHz are shown in Fig. 4, and the related values are also listed in Table 1. It can be seen that the εr versus temperature (εr–T) curves of all samples are rather similar. The εr–T curves for all ceramics exhibit two dielectric anomaly peaks at ∼100 °C and 300 °C.31–33 Normally, the high temperature anomaly peak is called Tm, where the dielectric constant reaches its maximum value.34–36 The lower anomaly peak is located near TF–R, which is known as the ferroelectric (FE) to ergodic relaxor (ER) phase transition temperature.6 Normally, the TF–R can be usually carried out from the peak of tan
δ) of the poled (1 − x)[BNKT–0.03BSrT]–xBFT ceramics measured at different frequencies from 1–1000 kHz are shown in Fig. 4, and the related values are also listed in Table 1. It can be seen that the εr versus temperature (εr–T) curves of all samples are rather similar. The εr–T curves for all ceramics exhibit two dielectric anomaly peaks at ∼100 °C and 300 °C.31–33 Normally, the high temperature anomaly peak is called Tm, where the dielectric constant reaches its maximum value.34–36 The lower anomaly peak is located near TF–R, which is known as the ferroelectric (FE) to ergodic relaxor (ER) phase transition temperature.6 Normally, the TF–R can be usually carried out from the peak of tan![[thin space (1/6-em)]](https://www.rsc.org/images/entities/char_2009.gif) δ–T curve of a poled sample. However, the TF–R could not be detected from the tan
δ–T curve of a poled sample. However, the TF–R could not be detected from the tan![[thin space (1/6-em)]](https://www.rsc.org/images/entities/char_2009.gif) δ–T curves for this work. The Tm and εmax values of the x = 0 ceramic in this study are observed from Fig. 4 to be 316 and 5156, respectively. The εmax decreases with increasing BFT content. Furthermore, the Tm also shifts from 316 °C for the x = 0 ceramic to 284 °C the x = 0.03 ceramic. This result also agrees with the results of previous report for other BNKT-based ceramics.34
δ–T curves for this work. The Tm and εmax values of the x = 0 ceramic in this study are observed from Fig. 4 to be 316 and 5156, respectively. The εmax decreases with increasing BFT content. Furthermore, the Tm also shifts from 316 °C for the x = 0 ceramic to 284 °C the x = 0.03 ceramic. This result also agrees with the results of previous report for other BNKT-based ceramics.34
To study the diffuse phase transition in this system, the diffuseness of the phase transition was calculated by a modified Curie–Weiss law eqn (1) which is given by ref. 37 and 38.
 | (1) |
Polarization and strain behaviors
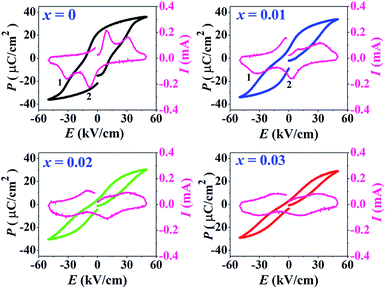
The P–E hysteresis and bipolar strain–electric field (S–E) loops measured at room temperature (RT) and electric field of 50 kV cm−1 are shown in Fig. 5 and 6, respectively. The related values are also listed in Tables 2 and 3. The x = 0 ceramic displays a small pinched loop with the maximum values of Pmax = 37.70 μC cm−2, Pr = 21.74 μC cm−2 and Ec = 12.87 kV cm−1. The S–E curve for this sample also exhibits a butterfly-shaped loop. The Smax and of this ceramic are 0.33% and 650 pm V−1, respectively. The ferroelectric loop indicates a ferroelectric domain switching at Ec, where the largest Sneg is −0.11%. However, this ceramic sample should contain a mixed phase between FE and ER, since the P–E loop presents a small pinched shape. For the x = 0.01 ceramic, however, the P–E hysteresis loop exhibits a more pinched loop with a decrease of Pr from 21.74 μC cm−2 to 8.15 μC cm−2 and Ec from 12.87 kV cm−1 to 7.34 kV cm−1. The hysteresis loop shows a clear pinching-type character with further increasing BFT content, similarly observed in previous works.6,35 The pinched P–E loops corresponded with the two current peaks (denoted as “1” and “2”) in the I–E curves (Fig. 5), where it has been suggested that this evidence indicates a formation of ER phase.14,36
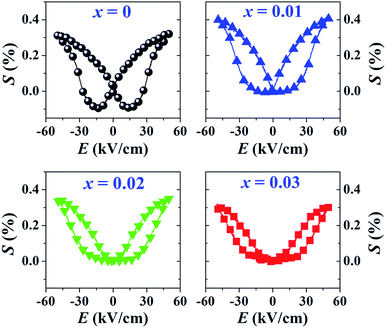 | ||
| Fig. 6 Bipolar strain–electric field (S–E) loops of the (1 − x)[BNKT–0.03BSrT]–xBFT ceramics where x = 0–0.03, measured at RT under an electric field of 50 kV cm−1 and a frequency of 0.1 Hz. | ||
| x | Pmax (μC cm−2) | Pr (μC cm−2) | Ec (kV cm−1) | Wa (J cm−3) | Wb (J cm−3) | Wc (J cm−3) | ηa (%) | ηb (%) | ηc (%) |
|---|---|---|---|---|---|---|---|---|---|
| a Ferroelectric data obtained at high temperature of 25 °C and a frequency of 1 Hz.b Ferroelectric data obtained at high temperature of 120 °C and a frequency of 1 Hz.c Ferroelectric data obtained at high temperature of 150 °C and a frequency of 1 Hz. | |||||||||
| 0 | 37.70 | 21.74 | 12.87 | 0.20 | 0.54 | 0.60 | 20.0 | 69.5 | 81.2 |
| 0.01 | 35.65 | 8.15 | 7.34 | 0.37 | 0.61 | 0.61 | 38.6 | 80.0 | 87.4 |
| 0.02 | 32.78 | 4.26 | 5.66 | 0.45 | 0.63 | 0.62 | 51.7 | 87.9 | 92.0 |
| 0.03 | 29.18 | 3.15 | 4.77 | 0.49 | 0.65 | 0.63 | 60.7 | 90.4 | 92.1 |
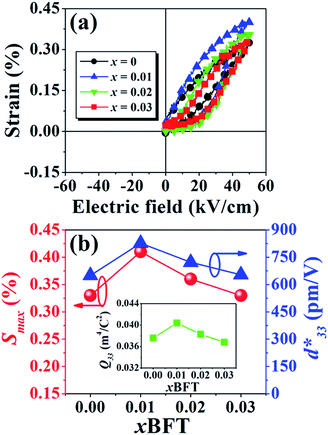
The more pinched P–E loops result also corresponds to a large electric field-induced strain response with Smax of 0.42% and  of 840 pm V−1 along with a drastic reduction in Sneg from −0.11% to 0% for the x = 0.01 ceramic in bipolar S–E loops. This enhancement is also confirmed by the unipolar S–E loops, as shown in Fig. 7(a). It is seen that the unipolar S–E loops for all compositions show a similar trend as compared to that of the bipolar S–E loops, where the maximum strain value of the unipolar strain is 0.42% for the x = 0.01 ceramic (Fig. 7(b)). The pinching of the P–E hysteresis loops with rapid reductions of Pr and Ec can be correlated with the increase of Smax along with a drastic reduction in Sneg. This may be related with a phase transition from a ferroelectric (FE) to an ergodic relaxor (ER) phase, accompanied by the disruption of long-range ferroelectric order with increasing BFT content.6 Normally, the free energy of FE and ER phases is comparable under zero field, thus it can be easily induced by an external electric field to become saturated.36 Therefore, ER phase can be transformed reversibly into FE phase by an external electric field. This behaviour consists with the work done by Dong et al.40 who also reported that the (1 − x)(0.8Bi1/2Na1/2TiO3–0.2Bi1/2K1/2TiO3)–xBiMg2/3Nb1/3O3 or (BNT–BKT)–BMN system produced a large strain response when a small amount of BMN was added into the BNT–BKT ceramic. The addition of 2 mol% BMN into the BNT–BKT ceramic shows a pronounced ergodic relaxor (ER) characteristic, which is confirmed by the absence of Sneg, the pinched P–E loop and the double current peaks of I–E loop. However, in the present work when x > 0.01, the strain is reduced gradually. Therefore, the small amount of BFT additive has effects on the piezoelectric properties of the BNKT–0.03BSrT ceramics. It should be noted that the Smax in this work (x = 0.01) is considered high when compared with other lead-free piezoelectric ceramics (see Table 4).18,41–48 Furthermore, the bipolar strain loops for the present work exhibit a low anti-symmetry in their shape compared to many previous works for the giant strain response which showed high anti-symmetry.42,45 In the present work, an average maximum strain (
![[S with combining macron]](https://www.rsc.org/images/entities/i_char_0053_0304.gif) max) was calculated to be used as a parameter to check for overall averaged maximum strain of the bipolar strain loop, where
max) was calculated to be used as a parameter to check for overall averaged maximum strain of the bipolar strain loop, where ![[S with combining macron]](https://www.rsc.org/images/entities/i_char_0053_0304.gif) max averaged from maximum strain between the right and left hand sides of the bipolar strain loop. The result is also shown in Table 4. The obtained
max averaged from maximum strain between the right and left hand sides of the bipolar strain loop. The result is also shown in Table 4. The obtained ![[S with combining macron]](https://www.rsc.org/images/entities/i_char_0053_0304.gif) max for the present work is considered high for the lead-free piezoelectric ceramics.
max for the present work is considered high for the lead-free piezoelectric ceramics.
 values of the (1 − x)[BNKT–0.03BSrT]–xBFT (x = 0.01) with other lead-free ceramics
| Systems | Smax (%) | ![[S with combining macron]](https://www.rsc.org/images/entities/i_char_0053_0304.gif) max (%) max (%) |
(pm V−1) | Emax (kV cm−1) | Ref. |
|---|---|---|---|---|---|
| 0.99[BNKT–0.03BSrT]–0.01BFT | 0.42 | 0.42 | 827 | 50 | This work |
| BNKT–BST–Lax | 0.39 | 0.39 | 650 | 60 | 18 |
| Bi0.5(Na0.78K0.22)0.5(Ti1−xZx)O3, x = 0.03 | 0.43 | 0.43 | 614 | 70 | 41 |
| Bi1/2(Na0.8K0.2)1/2](Ti1−xTax)O3, x = 0.015 | 0.62 | 0.42 | 1240 | 50 | 42 |
| BNKT–BST–Nbx, x = 0.02 | 0.38 | 0.38 | 634 | 60 | 43 |
| Bi0.5(Na0.78K0.22)0.5TiO3–0.01(Bi0.5La0.5)AlO3 | 0.40 | 0.40 | 579 | 70 | 44 |
| ((Bi1/2(Na0.84K0.16)1/2)0.96Sr0.04)(Ti1−xNbx)O3, x = 0.025 | 0.70 | 0.39 | 1400 | 50 | 45 |
| Bi0.5(Na0.78K0.22)0.5TiO3–0.03BiFeO3 | 0.37 | 0.36 | 676 | 50 | 46 |
| Bi0.5(Na0.80K0.20)0.5TiO3–0.05Ba(Ti0.90Sn0.10)O3 | 0.36 | 0.36 | 649 | 55 | 47 |
| [0.93(Bi0.5Na0.5)TiO3–0.07BaTiO3]–Pr | 0.43 | 0.42 | 770 | 50 | 48 |
The Q33 was determined from the slope of S vs. P2 curve.49,50 The plotting of Q33 value as a function of BFT content is shown in inset of Fig. 7(b). The highest Q33 of 0.040 m4 C−2 is noted for the x = 0.01 ceramic. It is evident that the currently presented Q33 value is highly competitive to many materials.51–58 In addition, a comparison of the room temperature Q33 and normalized Q33 (Q33/E) values with other lead-based and lead-free BNT-based electrostrictive materials are summarized in Table 5.51–58 It should be noted that the Q33/E value for the present work is very high for both lead-based and lead-free BNT-based piezoelectric materials. Therefore, the (1 − x)[BNKT–0.03BSrT]–xBFT compound may be a promising candidate for new electromechanical devices due to its giant Q33 value.
| Systems | Smax (%) | Q33 (m4 C−2) | Q33/Emax (m5 C−2 V) × 10−9 | E (kV cm−1) | Ref. |
|---|---|---|---|---|---|
| 0.99[BNKT–0.03BSrT]–0.01BFT | 0.42 | 0.0404 | 8.08 | 50 | This work |
| Pb(Mg1/2Nb1/2)O3 | — | 0.023 | — | — | 51 |
| PLZT 8/65/35 | 0.16 | 0.015 | 5.00 | 30 | 52 |
| 0.96BNKT–0.04BNiT | 0.38 | 0.0250 | 4.17 | 60 | 53 |
| 0.95BNKT–0.05BNiT | 0.32 | 0.0300 | 5.00 | 60 | 53 |
| N44B48T94–6BT [or (Nay,Biz)Ti1−xO3(1 − x)–xBaTiO3] | 0.48 | 0.0260 | 3.71 | 70 | 54 |
| 8% Sn-doped Bi1/2(Na0.82K0.18)1/2TiO3 | 0.14 | 0.0230 | 3.83 | 60 | 55 |
| BNKT100y–xKNN (y = 0.20, x = 0.16) | 0.10 | 0.0250 | 3.12 | 80 | 56 |
| (0.94 − x)BNT–0.06BT–xKNN, x = 0.20 | 0.09 | 0.0260 | 3.25 | 80 | 57 |
| Bi0.5−xLaxNa0.40K0.10Ti0.98Zr0.02O3, x = 0.02 | 0.42 | 0.0360 | 6.00 | 60 | 58 |
Normally for the actuator applications, a large strain with low hysteresis is necessary. The degree of strain hysteresis (H) can be determined from the following equation:38,59
 | (2) |
 value > 450 pm V−1). This suggests that a BFT modifier can improve the actuating performance.38
| Systems | H (%) | Smax (%) | (pm V−1) | Ref. |
|---|---|---|---|---|
| 0.99[BNKT–0.03BSrT]–0.01BFT | 55.0 | 0.42 | 840 | This work |
| 0.97[BNKT–0.03BSrT]–0.03BFT | 39.3 | 0.32 | 654 | This work |
| Bi1/2(Na0.82K0.12)1/2Ti1−x%(Fe0.5Nb0.5)x%O3, x = 5% | 57.0 | 0.46 | 660 | 32 |
| BNKT20–1.5SZ | 51.6 | 0.39 | 488 | 60 |
| BNT–BKT–5La | 60.3 | 0.38 | 857 | 61 |
| BNT–25ST | 45.8 | 0.29 | 650 | 62 |
| BNKT–3 mol% CZ | 49.0 | 0.37 | 603 | 63 |
| BNKT–2 mol% BCZ | 25.0 | 0.30 | 549 | 63 |
| (Ho,Sb)-modified (Bi0.5Na0.5)0.945Ba0.065TiO3 | 39.0 | 0.37 | 463 | 64 |
| BNBT6.5–100xES, x = 0.50% | 39.0 | 0.40 | 500 | 65 |
| BNT–BKT–xBZT, x = 0.02 | 40.0 | 0.32 | 503 | 66 |
Polarization-temperature analysis
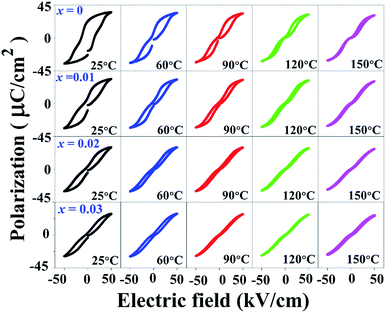
Temperature dependence of polarization–electric field (P–E) hysteresis loops of the (1 − x)[BNKT–0.03BSrT]–xBFT ceramics where x = 0–0.03, measured under an electric field of 50 kV cm−1 and a frequency of 1 Hz is shown in Fig. 8. It can be seen that the P–E hysteresis loop for the x = 0 ceramic shows slightly pinched loops at RT (25 °C). When the temperature increases to 120–150 °C, the P–E hysteresis loops become more pinched, confirming that the ferroelectric to relaxor phase transition is induced by thermal activation, thus leaving an ergodic relaxor (ER) state at zero electric field.67–69 On the other hand, the modified ceramics (x ≥ 0.01), exhibit an ER characteristic at RT. With further increasing temperature, the drastic decrease in both Pr and Ec values may also be related to the onset of strong ergodicity.68 Thus, both chemical modification and temperature can disrupt the FE long-range order leading to a decrease in the polarization states.68 This phenomenon agrees with that observed in many lead-free piezoelectric materials.40,69 Dong et al.40 also studied the temperature dependence of P–E hysteresis loops of the lead-free (1 − x)(0.8Bi1/2Na1/2TiO3–0.2Bi1/2K1/2TiO3)–xBiMg2/3Nb1/3O3 ceramics. With increasing temperature, the Pr and Ec values decrease gradually while Pmax slight changed and the P–E hysteresis loop showed severe pinches. This indicated the presence of an ergodic relaxor (ER) state, i.e. there exists a temperature-caused ferroelectric-to-relaxor phase transformation in their work.Energy storage density
The polarization and dielectric breakdown strength are two important parameters related to the energy storage performance. As is known to all, the BNT–BKT ceramics with high Pr of 34 μC cm−2 and low breakdown field (Eb ∼ 50 kV cm−1) are difficult to a satisfactory characteristic for high energy storage applications.70 Therefore, the design of BNT–BKT energy storage materials with low Pr, large Pmax as well as the improvement of Eb become two critical issues.To evaluate the capability of the studied ceramics for energy storage applications, the energy storage density (W) was calculated from the P–E hysteresis loop as shown in the following equation:70,71
 | (3) |
 | (4) |
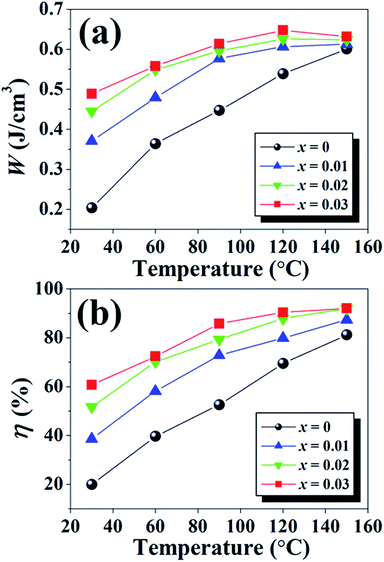 | ||
| Fig. 9 Plots of (a) energy storage density (W) and (b) energy storage coefficient (η) as a function of temperature of the (1 − x)[BNKT–0.03BSrT]–xBFT ceramics. | ||
A comparison of normalized energy storage density (W/E) with the previous reports is presented in Table 7.38,70,72–81 The comparison of W/E value with previous results clearly shows the superiority of this composition (x = 0.03) in terms of high W/E = 0.13 μC mm−2 and η = 90.4%. The obtained W/E value is high for Bi-based piezoelectric ceramics. Based on the obtained results, it is suggested that these synthesized ceramics are promising materials for actuator, high electric power and energy storage applications.72,77
| Systems | W (J cm−3) | E (kV mm−1) | W/E (μC mm−2) | η (%) | Ref. |
|---|---|---|---|---|---|
| 0.97[BNKT–0.03BSrT]–0.03BFT @ 120 °C | 0.65 | 5 | 0.13 | 90.4 | This work |
| 0.96BNKT–0.04MN | 0.65 | 7 | 0.09 | 34.2 | 38 |
| 0.92BNKT–0.08AN | 1.41 | 10.5 | 0.13 | — | 70 |
| Nb-modified 0.96(Bi0.5Na0.84K0.16TiO3)–0.04SrTiO3 | 1.00 | 6 | 0.17 | >70 | 72 |
| 0.94Bi0.47Na0.47Ba0.06TiO3–0.06KNbO3 | 0.89 | 10 | 0.09 | — | 73 |
| (0.9 − x)[0.92Bi0.5Na0.5TiO3–0.08BaTiO3]–xSrZrO3–0.10NaNbO3, x = 0.08 | 0.95 | 11 | 0.09 | 66.0 | 74 |
| 0.92(0.65BaTiO3–0.35Bi0.5Na0.5TiO3)–0.08Na0.73Bi0.09NbO3 | 1.70 | 17.2 | 0.10 | 82.0 | 75 |
| BNTBT–0.20NBN | 1.36 | 13.6 | 0.10 | 73.9 | 76 |
| (Bi0.5Na0.5)TiO3–0.10KNbO3 | 1.17 | 10.4 | 0.11 | — | 77 |
| 0.7SrTiO3–0.3(0.65BaTiO3–0.35Bi0.5Na0.5TiO3) | 1.40 | 19.6 | 0.07 | 90.0 | 78 |
| 0.95(BNTBT)–0.05KN | 0.64 | 6 | 0.11 | 84 | 79 |
| 0.99[0.7BNT–0.3BST]–0.01NN | 1.03 | 8.5 | 0.12 | 85.8 | 80 |
| (BNT–6BT)–NBN | 1.40 | 14.2 | 0.11 | 66.3 | 81 |
Conclusions
In this work, the BNKT–0.03BSrT doped with BFT ceramics have been successfully synthesized by a solid-state mixed oxide method. The coexistence of rhombohedral and tetragonal phases is present throughout the entire compositional range, while a dominant tetragonal-rich phase is observed at a higher BFT content. The x = 0.01 ceramic shows the high Smax of 0.42%, of 840 pm V−1, and high Q33 of 0.0404 m4 C−2 (at RT) with a very high Q33/E (8.08 × 10⁻⁹ m5 C2 V−1). The maximum energy storage density (W = 0.65 J cm−3 @ 120 °C) and energy storage efficiency (η = 90.4% @ 120 °C) with large improvements are obtained for the x = 0.03 ceramic. The studied results indicate that BFT enhances the electric field-induced strain, electrostrictive coefficient and energy storage density performances in BNKT-based ceramics. These ceramics can be considered promising candidates for actuator and high electric power pulse energy storage applications.
Conflicts of interest
There are no conflicts to declare.Acknowledgements
This research work was supported by the Thailand Research Fund (TRF, BRG6080002) and partially supported by Chiang Mai University, Materials Science Research Center. Department of Physics and Materials Science, Faculty of Science, Science and Technology Research Institute, Chiang Mai University is also acknowledged.References
- Z. Jiang, R. Zhang, F. Li, L. Jin, N. Zhang, D. Wang and C. L. Jia, AIP Adv., 2016, 6, 065122 CrossRef.
- J. Hao, W. Li, J. Zhai and H. Chen, Mater. Sci. Eng., R, 2019, 135, 1–57 CrossRef.
- X. Liu, F. Li, J. Zhai, B. Shen, P. Li, Y. Zhang and B. Liu, Mater. Res. Bull., 2018, 97, 215–221 CrossRef CAS.
- W. Bai, L. Wang, P. Zheng, F. Wen, Y. Yuan, M. Ding, D. Chen, J. Zhai and Z. Ji, Ceram. Int., 2018, 44, 8628–8634 CrossRef CAS.
- W. Bai, D. Chen, P. Zheng, J. Zhang, B. Shen, J. Zhai and Z. Ji, Ceram. Int., 2017, 43, 3339–3345 CrossRef CAS.
- R. F. Ge, Z. H. Zhao, S. F. Duan, X. Y. Kang, Y. K. Lv, D. S. Yin and Y. Dai, J. Alloys Compd., 2017, 724, 1000–1006 CrossRef CAS.
- N. Zhao, H. Fan, X. Ren, S. Gao, J. Ma and Y. Shi, Ceram. Int., 2018, 44, 571–579 CrossRef CAS.
- F. Li, Y. Liu, Y. Lyu, Y. Qi, Z. Yu and C. Lu, Ceram. Int., 2017, 43, 106–110 CrossRef CAS.
- P. Jaita, A. Watcharapasorn, N. Kumar, S. Jiansirisomboon and D. P. Cann, J. Am. Ceram. Soc., 2016, 99, 1615–1624 CrossRef CAS.
- T. Zheng, J. Wu, D. Xiao and J. Zhu, Prog. Mater. Sci., 2018, 98, 552–624 CrossRef CAS.
- T. Takenaka, K. I. Maruyama and K. Sakata, Jpn. J. Appl. Phys., 1991, 30, 2236–2239 CrossRef CAS.
- W. Jo, J. E. Daniels, J. L. Jones, X. Tan, P. A. Thomas, D. Damjanovic and J. Rödel, J. Appl. Phys., 2011, 109, 014110 CrossRef.
- S. Kim, H. Choi, S. Han, J. S. Park, M. H. Lee, T. K. Song, M. H. Kim, D. Do and W. J. Kim, J. Eur. Ceram. Soc., 2017, 37, 1379–1386 CrossRef CAS.
- X. Liu, S. Xue, J. Ma, J. Zhai, B. Shen, F. Wang, X. Zhao and H. Yan, J. Eur. Ceram. Soc., 2018, 38, 4631–4639 CrossRef CAS.
- A. Sasaki, T. Chiba, Y. Mamiya and E. O. Tsuki, Jpn. J. Appl. Phys., 1999, 38, 5564–5567 CrossRef CAS.
- Y. Hiruma, K. Yoshii, H. Nagata and T. Takenaka, J. Appl. Phys., 2008, 103, 084121 CrossRef.
- A. Ullah, C. W. Ahn, R. A. Malik, J. S. Lee and I. W. Kim, J. Electroceram., 2014, 33, 187–194 CrossRef CAS.
- A. Ullah, A. Ullah, I. W. Kim, D. S. Lee, S. J. Jeong and C. W. Ahn, J. Am. Ceram. Soc., 2014, 97, 2471–2478 CrossRef CAS.
- S. T. Zhang, A. B. Kounga, W. Jo, C. Jamin, K. Seifert, T. Granzow, J. Rödel and D. Damjanovic, Adv. Mater., 2009, 21, 4716–4720 CrossRef CAS.
- J. Shi, H. Fan, X. Liu and A. J. Bell, J. Am. Ceram. Soc., 2014, 97, 848–853 CrossRef CAS.
- S. T. Zhang, A. B. Kounga, E. Aulbach, H. Ehrenberg and J. Rödel, Appl. Phys. Lett., 2007, 91, 112906 CrossRef.
- Y. Hong, J. Li, W. Wu, Y. Wu, H. Bai, K. Shi, Q. Meng, Z. Zhou and D. Jia, Ceram. Int., 2018, 44, 16069–16075 CrossRef CAS.
- P. Jaita, P. Butnoi, R. Sanjoom, C. Randorn, R. Yimnirun and G. Rujijanagul, Ceram. Int., 2017, 43, S2–S9 CrossRef CAS.
- S. Manotham, S. Eitssayeam, K. Pengpat, T. Tunkasiri, D. Sweatman and G. Rujijanakul, Ferroelectrics, 2015, 487, 149–155 CrossRef CAS.
- F. Galasso, L. Katz and R. Ward, J. Am. Chem. Soc., 1959, 81, 820–823 CrossRef CAS.
- Z. Wang, X. M. Chen, L. Ni, Y. Y. Liu and X. Q. Liu, Appl. Phys. Lett., 2007, 90, 102905 CrossRef.
- C. Kruea-In and G. Rujijanagul, J. Nanosci. Nanotechnol., 2017, 17, 8603–8607 CrossRef CAS.
- C. Kruea-In, S. Eitssayeam, K. Pengpat and G. Rujijanagul, Mater. Res. Bull., 2012, 47, 2859–2862 CrossRef CAS.
- R. D. Shannon, Acta Crystallogr., Sect. A: Cryst. Phys., Diffr., Theor. Gen. Crystallogr., 1976, 32, 751–767 CrossRef.
- Z. W. Chen and J. Q. Hu, Adv. Appl. Ceram., 2008, 107, 222–226 CrossRef CAS.
- R. A. Malik, A. Hussain, A. Zaman, A. Maqbool, J. U. Rahman, T. K. Song, W. J. Kim and M. H. Kim, RSC Adv., 2015, 5, 96953–96964 RSC.
- P. Fan, Y. Zhang, B. Xie, Y. Zhu, W. Ma, C. Wang, B. Yang, J. Xu, J. Xiao and H. Zhang, Ceram. Int., 2018, 44, 3211–3217 CrossRef CAS.
- W. Bai, F. Liu, P. Li, B. Shen, J. Zhai and H. Chen, J. Eur. Ceram. Soc., 2015, 35, 3457–3466 CrossRef CAS.
- Y. K. Lv, S. F. Duan, Z. H. Zhao, X. Y. Kang, R. F. Ge, H. Wang and Y. Dai, J. Mater. Sci., 2018, 53, 8059–8066 CrossRef CAS.
- R. A. Malik, A. Hussain, A. Maqbool, A. Zaman, C. W. Ahn, J. U. Rahman, T. K. Song, W. J. Kim and M. H. Kim, J. Am. Ceram. Soc., 2015, 98, 3842–3848 CrossRef CAS.
- A. Maqbool, A. Hussain, R. A. Malik, J. U. Rahman, A. Zaman, T. K. Song, W. J. Kim and M. H. Kim, Mater. Sci. Eng., B, 2015, 199, 105–112 CrossRef CAS.
- A. A. Bokov and Z. G. Ye, Solid State Commun., 2000, 116, 105–108 CrossRef CAS.
- H. Xie, Y. Zhao, J. Xu, L. Yang, C. Zhou, H. Zhang, X. Zhang, W. Qiu and H. Wang, J. Alloys Compd., 2018, 743, 73–82 CrossRef CAS.
- X. Wei, Y. Feng, X. Wan and X. Yao, Ceram. Int., 2004, 30, 1397–1400 CrossRef CAS.
- G. Dong, H. Fan, J. Shi and Q. Li, J. Am. Ceram. Soc., 2018, 101, 3947–3955 CrossRef CAS.
- A. Hussain, C. W. Ahn, J. S. Lee, A. Ullah and I. W. Kim, Sens. Actuators, A, 2010, 158, 84–89 CrossRef CAS.
- X. Liu and X. Tan, J. Appl. Phys., 2016, 120, 034102 CrossRef.
- A. Ullah, R. A. Malik, A. Ullah, D. S. Lee, S. J. Jeong, J. S. Lee, I. W. Kim and C. W. Ahn, J. Eur. Ceram. Soc., 2014, 34, 29–35 CrossRef CAS.
- A. Ullah, C. W. Ahn, S. Y. Lee, J. S. Kim and I. W. Kim, Ceram. Int., 2012, 38S, S363–S368 CrossRef.
- X. Liu and X. Tan, Adv. Mater., 2016, 28, 574–578 CrossRef CAS PubMed.
- K. T. Lee, J. S. Park, J. H. Cho, Y. H. Jeong, J. H. Paik and J. S. Yun, Ceram. Int., 2015, 41, 10298–10303 CrossRef CAS.
- P. Jaita, A. Watcharapasorn, D. P. Cann and S. Jiansirisomboon, J. Alloys Compd., 2014, 596, 98–106 CrossRef CAS.
- Q. Yao, F. Wang, F. Xu, C. M. Leung, T. Wang, Y. Tang, X. Ye, Y. Xie, D. Sun and W. Shi, ACS Appl. Mater. Interfaces, 2015, 7, 5066–5075 CrossRef CAS PubMed.
- V. D. N. Tran, T. H. Dinh, H. S. Han, W. Jo and J. S. Lee, Ceram. Int., 2013, 39, S119–S124 CrossRef CAS.
- V. D. N. Tran, H. S. Han, C. H. Yoon, J. S. Lee, W. Jo and J. Rödel, Mater. Lett., 2011, 65, 2607–2609 CrossRef CAS.
- J. Kuwata, K. Uchino and S. Nomura, Jpn. J. Appl. Phys., 1980, 19, 2099–2103 CrossRef CAS.
- M. B. Rauls, W. Dong, J. E. Huber and C. S. Lynch, Acta Mater., 2011, 59, 2713–2722 CrossRef CAS.
- A. Ullah, H. B. Gul, A. Ullah, M. Sheeraz, J. S. Bae, W. Jo, C. W. Ahn, I. W. Kim and T. H. Kim, APL Mater., 2018, 6, 016104 CrossRef.
- Y. Guo, M. Gu, H. Luo, Y. Liu and R. L. Withers, Phys. Rev. B, 2011, 83, 054118 CrossRef.
- H. S. Han, W. Jo, J. K. Kang, C. W. Ahn, I. W. Kim, K. K. Ahn and J. S. Lee, J. Appl. Phys., 2013, 113, 154102 CrossRef.
- J. Hao, Z. Xu, R. Chu, W. Li and J. Du, J. Mater. Sci., 2015, 50, 5328–5336 CrossRef CAS.
- S. T. Zhang, F. Yan, B. Yang and W. Cao, Appl. Phys. Lett., 2010, 97, 122901 CrossRef.
- P. Butnoi, S. Manotham, P. Jaita, C. Randorn and G. Rujijanagul, J. Eur. Ceram. Soc., 2018, 38, 3822–3832 CrossRef CAS.
- H. Zhang, P. Xu, E. Patterson, J. Zang, S. Jiang and J. Rödel, J. Eur. Ceram. Soc., 2015, 35, 2501–2512 CrossRef CAS.
- J. Hao, Z. Xu, R. Chu, W. Li and J. Du, J. Alloys Compd., 2015, 647, 857–865 CrossRef CAS.
- T. H. Dinh, J. K. Kang, J. S. Lee, N. H. Khansur, J. Daniels, H. Y. Lee, F. Z. Yao, K. Wang, J. F. Li, H. S. Han and W. Jo, J. Eur. Ceram. Soc., 2016, 36, 3401–3407 CrossRef CAS.
- W. Krauss, D. Schütz, F. A. Mautner, A. Feteira and K. Reichmann, J. Eur. Ceram. Soc., 2010, 30, 1827–1832 CrossRef CAS.
- H. B. Lee, D. J. Heo, R. A. Malik, C. H. Yoon, H. S. Han and J. S. Lee, Ceram. Int., 2013, 39, S705–S708 CrossRef CAS.
- H. Shi, Y. Zhu, Y. Zhao, C. Liu, X. Ren, J. Hao and W. Li, J. Alloys Compd., 2018, 767, 666–674 CrossRef CAS.
- J. Hao, Z. Xu, R. Chu, S. Chu, W. Li, P. Fu, J. Du and C. Hu, Mater. Lett., 2017, 193, 138–141 CrossRef CAS.
- W. Bai, D. Chen, Y. Huang, P. Zheng, J. Zhong, M. Ding, Y. Yuan, B. Shen, J. Zhai and Z. Ji, Ceram. Int., 2016, 42, 7669–7680 CrossRef CAS.
- N. Chen, W. Yao, C. Liang, S. Xiao, J. Hao, Z. Xu and R. Chu, Ceram. Int., 2016, 42, 9660–9666 CrossRef CAS.
- R. A. Malik, A. Hussain, A. Maqbool, A. Zaman, T. K. Song, W. J. Kim and M. H. Kim, J. Alloys Compd., 2016, 682, 302–310 CrossRef CAS.
- K. Wang, A. Hussain, W. Jo and J. Rödel, J. Am. Ceram. Soc., 2012, 95, 2241–2247 CrossRef CAS.
- Y. Zhao, J. Xu, L. Yang, C. Zhou, X. Lu, C. Yuan, Q. Li, G. Chen and H. Wang, J. Alloys Compd., 2016, 666, 209–216 CrossRef CAS.
- B. Hu, H. Fan, L. Ning, Y. Wen and C. Wang, Ceram. Int., 2018, 44, 15160–15166 CrossRef CAS.
- R. A. Malik, A. Hussain, M. Acosta, J. Daniels, H. S. Han, M. H. Kim and J. S. Lee, J. Eur. Ceram. Soc., 2018, 38, 2511–2519 CrossRef CAS.
- B. Wang, L. Luo, X. Jiang, W. Li and H. Chen, J. Alloys Compd., 2014, 585, 14–18 CrossRef CAS.
- Z. Liu, P. Ren, C. Long, X. Wang, Y. Wan and G. Zhao, J. Alloys Compd., 2017, 721, 538–544 CrossRef CAS.
- H. Yang, F. Yan, Y. Lin, T. Wang, F. Wang, Y. Wang, L. Guo, W. Tai and H. Wei, J. Eur. Ceram. Soc., 2017, 37, 3303–3311 CrossRef CAS.
- Q. Xu, H. Liu, Z. Song, X. Huang, A. Ullah, L. Zhang, J. Xie, H. Hao, M. Cao and Z. Yao, J. Mater. Sci.: Mater. Electron., 2016, 27, 322–329 CrossRef CAS.
- L. Luo, B. Wang, X. Jiang and W. Li, J. Mater. Sci., 2014, 49, 1659–1665 CrossRef CAS.
- H. Yang, F. Yan, Y. Lin, T. Wang, L. He and F. Wang, J. Alloys Compd., 2017, 710, 436–445 CrossRef CAS.
- Q. Xu, J. Xie, Z. He, L. Zhang, M. Cao, X. Huang, M. T. Lanagan, H. Hao, Z. Yao and H. Liu, J. Eur. Ceram. Soc., 2017, 37, 99–106 CrossRef CAS.
- Q. Li, Z. Yao, L. Ning, S. Gao, B. Hu, G. Dong and H. Fan, Ceram. Int., 2018, 44, 2782–2788 CrossRef CAS.
- Q. Xu, M. T. Lanagan, X. Huang, J. Xie, L. Zhang, H. Hao and H. Liu, Ceram. Int., 2016, 42, 9728–9736 CrossRef CAS.
| This journal is © The Royal Society of Chemistry 2019 |

