 Open Access Article
Solvatochromism and pH effect on the emission of a triphenylimidazole-phenylacrylonitrile derivative: experimental and DFT studies†
Karnambaram Anandhan a,
Margarita Ceróna,
Venkatesan Perumal
 a,
Paulina Ceballosa,
Paola Gordillo-Guerraa,
Enrique Pérez-Gutiérreza,
Armando E. Castilloa,
Subbiah Thamotharanb and
M. Judith Percino
 *a
*a
aUnidad de Polímeros y Electrónica Orgánica, ICUAP, Benemérita Universidad Autónoma de Puebla, Val 3-Ecocampus Valsequillo, Independencia O2 Sur 50, San Pedro Zacachimalpa, Pue., Mexico 72960. E-mail: judith.percino@correo.buap.mx
bBiomolecular Crystallography Laboratory, Department of Bioinformatics, School of Chemical and Biotechnology, SASTRA Deemed University, Thanjavur 613 401, India
First published on 16th April 2019
Abstract
In this work, a study of the photophysical properties in different solvents and at different pH values of a luminogenic compound with a donor–π–acceptor (D–π–A) structure was carried out. The compound (Z)-3-(4-(4,5-diphenyl-1H-imidazol-2-yl)phenyl)-2-phenylacrylonitrile (2) was synthesized and characterized by SCXRD, FT-IR, 1H NMR, 13C NMR, EIMS, UV-Vis absorption and fluorescence. The SCXRD characterization reveals a monoclinic system, P21/c, with Z = 4 and an imidazole core having hydrogen bonding with respect to water molecules present in the asymmetric unit. It leads to a strong π–π-interaction in the solid state. The fluorescence λmax emission of the powder and thin film was observed at 563 nm and 540 nm respectively. Several degrees of positive solvatochromic fluorescence were observed due to different molecular conformations in various solvents. When the pH of the compound was changed with HCl or NaOH, a shift in the wavelength of emission was observed in a reversible manner. At pH 2, the λmax of emission was at 541 nm whereas at pH 14 there were two emissions at 561 nm and 671 nm. Due to their good emission in the solid state, compound 2 was tested as an emitting layer in OLEDs; the devices showed an acceptable performance with a luminance average of 450 cd m−2. The band gap was analyzed by optical absorption, cyclic voltammetry measurement and DFT calculations.
1. Introduction
In recent years, the π-conjugated luminophores have been extensively investigated as fluorescent sensors,1–5 for biological imaging,6 and for other optoelectronic applications7–10 due to their optical properties, charge transport properties and structure tunability.11–14 Most of the organic luminophore molecules have limitation in the fluorophore's applications, because of a strong π–π stacking interaction in the extended π-conjugated systems and dipole–dipole interaction that resulted in a weak emission or absolute absence in the condensed phase.15,16 Also, some fluorescent compounds change their absorption wavelength and intensity of emission upon various polarity environments, i.e. solvatochromism phenomenon. This behaviour has attracted considerable attention because of the charge transfer nature (intra/inter molecular); it could be used as sensors of solvent polarity as well as volatile organic compounds.17,18Among heteroaromatic compounds, the imidazole scaffold exhibits electron attracting or mild donating nature which displayed unique optical, thermal, electronic and biological properties.19 Especially, 2,4,5-triphenyl-1H-imidazole, (lophine, Scheme 1), exhibited fluorescence and chemiluminescence properties when reacted with oxygen in the presence of strong basic conditions.20–23 It has three phenyl groups in the C-2, C-4 and C-5 positions on the imidazole structure. Functionalized lophine derivatives are promising candidates for the light emitting applications, because it is possible to alter the structure (π-conjugation) through the phenyl ring with different donor (D) and acceptor (A). Triphenyl imidazole derivatives as well as 1H-imidazol-5-yl-vinyl-benz[e]indolium, and metal based imidazole complex showed halochromism and a discrete colour change (λabs 360, 430 and 477 nm in acidic, neutral and basic conditions respectively) on pH variation in the range of 2 to 11 and also can act as fluorescent pH sensor.24–28 However, there are only a few optical pH sensors for use at high or low pH.29,30 By means of pH variations, it is possible to delineate the effect of donor (push) or electron-withdrawing (pull) groups attached to C-2 of imidazole ring that decides by the electronic density of structure as well as donor capacity of N atom.
 | ||
| Scheme 1 (a) Numbering of the 2,4,5-triphenyl-1H-imidazole, (b) imidazole fused with α-cyanostilbene. | ||
The electronic factor of the cyano group played an excellent acceptor for such D–π–A fluorescent materials which was responsible for the optical properties.31–33 In the past decade, α-cyanostilbene derivatives have drawn attention because of their unique charge-transfer characteristics and their utility as promising fluorescent materials for use in biological, the AIE/AIEE-activity,33 optical applications34 and multi-stimuli responsive properties.35–37 Our group are working to explore the photophysical and optoelectronic properties of the phenylacrylonitrile/pyridylacrylonitrile containing derivative. Based on our previously reported the strong electron withdrawing feature of the phenylacrylonitrile/pyridylacrylonitrile based chromophore that act as a good acceptor and to show an enhancement of emission in the solid state but some case its weak.38–40 Hence it exhibited an important effect on the optical and electronic properties.41–43
Herein we report the synthesis of a novel imidazole derivatives containing the phenylacrylonitrile (half of the α-cyanostilbene) unit using a simple route. Even though imidazole unit has electron withdrawing nature when it combined through to the phenylacrylonitrile to examine the emission properties in the solution and solid state whether it shows enhanced or quenching. In order to find the electron charge distribution in the molecular structure (D–π–A or A′–π–A structure motif) by explore absorption and emission with varying the pH (acidic or basic conditions) and different solvents. So, the title compound undergoes a deep study of their photophysical properties in solution and solid state besides solvatochromic property, pH studies, electrochemical analysis, DFT calculations were carried out. In addition, it was evaluated as an emitting layer in OLEDs.
2. Result and discussion
2.1 Synthesis and characterisation
We reported the design and synthesis of a novel compound (Z)-3-(4-(4,5-diphenyl-1H-imidazol-2-yl)phenyl)-2-phenylacrylo nitrile (2) as shown in Scheme 2. The 4-(4,5-diphenyl-1H-imidazol-2-yl) benzaldehyde (1) was synthesized via condensation of benzil with 4-formyl benzaldehyde in the presence of NH4OAc and acetic acid at reflux for 5 hours. The compound 1 was reacted with phenyl acetonitrile with KOH as catalyst and MeOH as solvent at reflux conditions to get the compound 2 with 65% yield (Scheme 2). The principal signals in IR, 1H NMR and EI for compounds 1 and 2 are summarized in experimental section. | ||
| Scheme 2 Synthesis of compound 2 (a) NH4OAc/HOAc/4-formyl benzaldehyde, reflux; (b) cat. KOH/MeOH, phenylacetonitrile, reflux. | ||
2.2 Single crystal X-ray crystallography
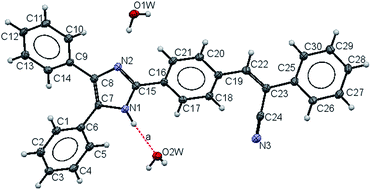
Compound 2 crystallizes in the monoclinic space group P21/c with Z = 4. The crystal data and refinement parameters are summarized in Table S1.† Fig. 1 shows the ORTEP diagram of the asymmetric unit of crystal 2. The molecular structure shows the bond lengths and bond distances are also listed in Table 1. The bond distance of C(15)–N(2) is shorter, meanwhile the C(7)–N(1) and C(8)–N(2) distances are longer compared with the reported double bond lengths.44 In addition to that, the bond C(7)–C(8) is longer and displays the electron delocalization over the atoms of C(8), C(7), N(1), C(15) of the imidazole ring. The nitrile –C(24)![[triple bond, length as m-dash]](https://www.rsc.org/images/entities/char_e002.gif) N(3) bond length is the longest N–C bond and falls into the range of a triple bond –C
N(3) bond length is the longest N–C bond and falls into the range of a triple bond –C![[triple bond, length as m-dash]](https://www.rsc.org/images/entities/char_e002.gif) N reported for TCNQ.44
N reported for TCNQ.44
| Bond | Length54 (Å) | Compound 2 | Length (Å) |
|---|---|---|---|
| Imidazole | |||
| C(sp2)–N | 1.349 | C(15)–N(1) | 1.349(2) |
| C4–N3 | 1.376 | C(15)–N(2) | 1.329(2) |
| C5–N1 | 1.370 | C(7)–N(1) | 1.383(2) |
| C(8)–N(2) | 1.380(2) | ||
Csp2![[double bond, length as m-dash]](https://www.rsc.org/images/entities/char_e001.gif) Csp2 (C Csp2 (C![[double bond, length as m-dash]](https://www.rsc.org/images/entities/char_e001.gif) C–CAr) C–CAr) |
1.339 | C(7)–C(8) | 1.391(2) |
| C(22)–C(23) | 1.358(2) | ||
| Csp2–CAr (conjugated) | 1.455, overall 1.460 | C(8)–C(9) | 1.475(2) |
| C(6)–C(7) | 1.469(3) | ||
Csp2–CAr C![[double bond, length as m-dash]](https://www.rsc.org/images/entities/char_e001.gif) C–CAr (conjugated) C–CAr (conjugated) |
1.470, overall 1.480 | C(15)–C(16) | 1.468(2) |
| C(19)–C(22) | 1.456(3) | ||
| C(20)–C(21) | 1.385(3) | ||
| CAr≈CAr | 1.380 | C(17)–C(18) | 1.379(3) |
| C≈C (overall) | 1.384 | C(9)–C(10) | 1.398(3) |
| C(25)–C(30) | 1.398(3) | ||
Csp![[triple bond, length as m-dash]](https://www.rsc.org/images/entities/char_e002.gif) N N |
1.136 | C(24)–N(3) | 1.149(3) |
In the imidazole ring, the torsion angles [N(1)–C(7)–C(8)–N(2); N(2)–C(15)–N(1)–C(7); C(8)–C(7)–N(1)C(15); N(1)–C(15)–N(2)–C(8) and C(7)–C(8)–N(2)–C(15)] are smaller, indicating that the ring is found to be planar. The substituents such as phenyl groups and [2,3-diphenylprop-2-enenitrile] moiety are rotated with respect to imidazole ring, that was expected due to steric effect with dihedral angles between atoms C(5)–C(6)–C(7)–N(1) of −41.3(3)° and C(1)–C(6)–C(7)–C(8) of −40.2(3)°, whereas between [2,3-diphenylprop-2-enenitrile] attached to imidazole group is a peri-planar conformation as evident from the dihedral angles of N(2)–C(15)–C(16)–C(21) of 21.8(3)°, N(1)–C(15)–C(16)–C(17) of 22.3(3)° and the atoms C(18)–C(19)–C(22)–C(23) of −25.6(3)°; C(19)–C(22)–C(23)–C(24) of −9.3(3)° and C(22)–C(23)–C(25)–C(30) of −21.3(3)° (selected dihedral angles, bond length, bond angle and torsion angles values are in the Tables S2 to S5 in the ESI†).
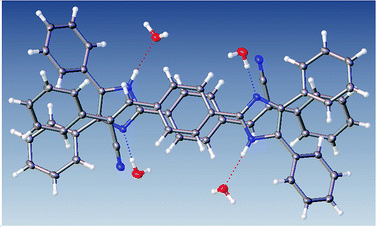
The most interesting feature in the structure of compound 2 is concerned with the presence of two molecules of water in the asymmetric unit. The intermolecular motif formed by N–H⋯O and O(2) H⋯O(1) interactions are shown in Fig. 2 with hydrogen bonds distances and chain motifs a, b, c and e, and the atoms involved in chain motif formation. The water molecules in the lattice, act as H-bond donor which bridges between molecules extending along the c axis.
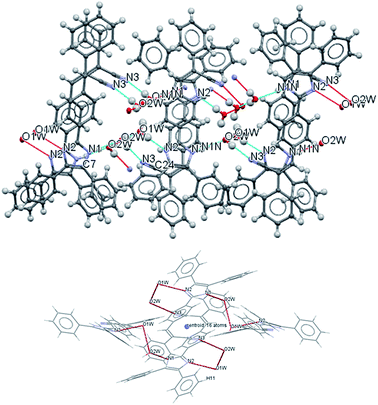 | ||
| Fig. 2 Intermolecular hydrogen bond interactions between the lattice solvent molecules and compound 2. | ||
Table 2 provides a list of graph-set motif of hydrogen bonds in the compound 2 and it can be seen the –C![[triple bond, length as m-dash]](https://www.rsc.org/images/entities/char_e002.gif) N group [C(24)–N(3)] is found anti in the formed dimer. The face-to-face arrangement in Fig. 3, owing to the intermolecular interaction of O–H(solvent)⋯N hydrogen bond. Two neighbouring molecules stacked face-to-face manner with centroid–centroid between phenyl ring distances of 3.07 Å and off-set distance of 1.05 Å which is much shorter than reported values 1.6 – 1.8 Å (ref. 45) and this shortening causes distribution of electronic density that minimizes the π-electrons repulsion.
N group [C(24)–N(3)] is found anti in the formed dimer. The face-to-face arrangement in Fig. 3, owing to the intermolecular interaction of O–H(solvent)⋯N hydrogen bond. Two neighbouring molecules stacked face-to-face manner with centroid–centroid between phenyl ring distances of 3.07 Å and off-set distance of 1.05 Å which is much shorter than reported values 1.6 – 1.8 Å (ref. 45) and this shortening causes distribution of electronic density that minimizes the π-electrons repulsion.
| D–H⋯A | d(A–H) | d(D⋯A) | <DHA | Symmetry equivalent | |
|---|---|---|---|---|---|
| O2W⋯O1W | O2W–H2(W2) | 0.86(2) | 2.761 | 174.76 | x, 1/2 − y, 1/2 + z |
| N2⋯O1W | O1W–H1(W1) | 0.86(2) | 2.842 | 173.70 | x, y, z |
| N1⋯O2W | N1–N1N | 0.88(18) | 2.971 | 170.81 | x, y, z |
| N3⋯O2W | O2W–H2(W2) | 0.84(2) | 2.936 | 171.83 | 1 − x, −1/2 + y, 1/2 − z |
Fig. 4 shows the distances calculated using OLEX 246 and the typical values for aromatic π⋯π interactions (i.e., the centroid–centroid distances > 3.65 Å and offsets of 1.6–1.8 Å).45 The presence of solvent molecules in the crystal packing of compound 2 might indicate that crystal growth is optimized with O–H(solvent)⋯N(compound). The packing of structure 2 showed that the hydrogen bond interactions, the position of the nitrogen atom within the imidazole core, and the phenyl-, acrylonitrile groups play important roles and they interact with the solvent47,48 (Fig. 4).
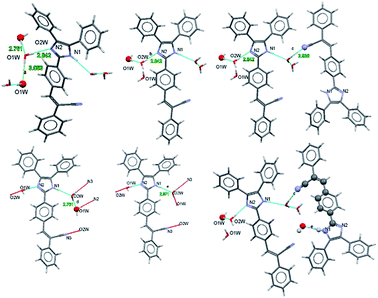 | ||
| Fig. 4 Intermolecular motif formed interaction shown with a bond distance (Å). Chain motif and atoms involved in chain motif formation are shown in ball stick form. | ||
2.3 Optical properties
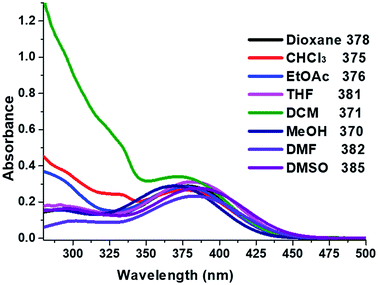
The absorption properties of compound 2 were measured in various solvents to evaluate; methanol (a protic solvent), 1,4-dioxane, CHCl3, ethylacetate (EtOAc), tetrahydrofuran (THF) as well as dichloromethane (DCM), dimethylformamide (DMF), dimethyl sulfoxide (DMSO) (polar aprotic solvents). UV-Vis absorption maxima (λabs), extinction coefficients (ε) and optical band gap (Egap) are listed in Table 3. The absorption spectra of compound 2 (Fig. 5), shows two maxima absorption, one in the range of 370–385 nm due to the π–π* transition. The mild band at 281–305 nm in the higher energy, (λabs 300 nm) was assigned to n–π* transition of the imidazole moiety.49–51 The absorption bands of compound 2 observed when the solvent polarity increases from 1,4-dioxane to DMSO. With increasing polarity of aprotic solvents such as 1,4-dioxane (378 nm) < THF (381 nm) < DMF (382 nm) < DMSO (385 nm). However, there is a blue shift slightly (15 nm) observed for the protic solvent (MeOH). Non-polar solvents (dioxane < THF < DCM) showed higher molar extinction coefficient (ε) value than polar aprotic solvents (DMF, DMSO) and protic solvent (MeOH) (Table 4).| Solvent | Dielectric constant | λabs1 (nm) | λabs2 (nm) | εa (×10−4) (M−1 cm−1) | Egap |
|---|---|---|---|---|---|
| a λabs = maximum absorption wavelength, c = 2.5 × 10⁻⁵ mol L−1; ε = maximum molar absorption coefficient (M−1 cm−1); Egap = optical band gap derived from onset wavelength of the UV-Vis absorption spectra. | |||||
| 1,4-Dioxane | 2.25 | 300 | 378 | 3.337 | 2.82 |
| CHCl3 | 4.81 | 297 | 375 | 3.088 | 2.78 |
| EtOAc | 6.02 | 293 | 376 | 3.284 | 2.78 |
| THF | 7.58 | 305 | 381 | 3.607 | 2.78 |
| DCM | 8.93 | 281 | 371 | 3.938 | 2.82 |
| MeOH | 32.7 | 290 | 370 | 2.878 | 2.73 |
| DMF | 36.7 | 300 | 382 | 2.689 | 2.79 |
| DMSO | 46.7 | 297 | 385 | 3.202 | 2.77 |
The optical band gap (Egap) for compound 2 was estimated from the absorption spectrum edge using the absorption on set52,53 (see Fig. S3 in ESI†). The calculate of Egap values for the absorption band in range of 370 to 385 nm are summarised in Table 3. The non-polar aprotic solvents (dioxane, CHCl3 THF, DCM) gave Egap value increased from 2.78 to 2.82 eV (371 nm to 381 nm). In the case of the polar aprotic solvents (DMF, DMSO) the Egap values are 2.79 eV, 2.77 eV respectively, whereas protic solvent (MeOH) was 2.73 eV. The difference could be an indication of the intermolecular hydrogen bond or interaction with imidazole moiety. These results are agreed with the solid-state intermolecular interactions to the solvent.
2.4 Photoluminescence studies
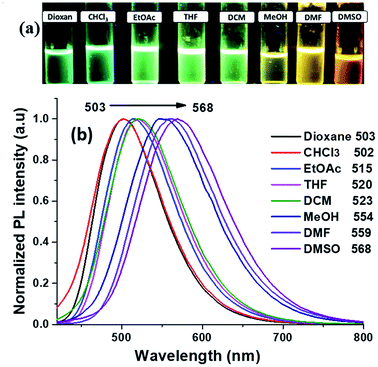
The photoluminescence (PL) study of the compound 2 in the selected solvents which are followed in the UV-Vis absorption study. The emission λmax values are listed in Table 4 and the graph shown in Fig. 6. The compound 2 showed a red-shift with the increasing solvent polarity. Here we noticed that the solvent effect was stronger in emission compared to the absorption study, 503 nm to 568 nm as follow: dioxane (503 nm), CHCl3 (502 nm), EtOAc (515 nm), THF (520 nm), DCM (523 nm). But there are longer shifts towards to longer wavelength in the case of polar protic solvents: MeOH (554 nm) and aprotic solvents DMF (559 nm), and DMSO (568 nm). In the same solvents, the quantum yield54 was calculated to evaluate the effect of solvent, (solvatochromic effect). The calculated quantum yield54 of the compound 2 is listed in Table 4.| Solvent | Dielectric constant | λem (nm) | Stoke shift (cm−1) | ΦF |
|---|---|---|---|---|
| a λem = maximum emission wavelength, c = 2.5 × 10⁻⁵ mol L−1; ΦF = quantum yield measured by using fluorescein in 0.1 mol L−1 NaOH as standard. | ||||
| 1,4-Dioxane | 2.25 | 503 | 6574 | 0.10 |
| CHCl3 | 4.81 | 502 | 6746 | 0.07 |
| EtOAc | 6.02 | 515 | 7178 | 0.16 |
| THF | 7.58 | 520 | 7016 | 0.10 |
| DCM | 8.93 | 523 | 7833 | 0.21 |
| MeOH | 32.7 | 554 | 8976 | 0.11 |
| DMF | 36.7 | 559 | 8289 | 0.17 |
| DMSO | 46.7 | 568 | 8368 | 0.20 |
The compound 2 exhibited a highest quantum yield value of 0.21 and 0.20 in DCM and DMSO respectively, whereas it is found to be lowest value of 0.07 in CHCl3. These results are indicated solute and solvents interaction leads to change in the transition state which was responsible for the shift in the emission maxima.
For optical properties, solvents play an important role because it stimulates major changes in the position, intensity and shape of the absorption and emission bands.55 The effect of solvent polarity on emission spectra is shown in Fig. 6a, a solvatochromic shift from green to yellowish orange was clearly visible upon UV irradiation. Compound 2 exhibited positive solvatochromism effect confirmed by the red-shift (66 nm) with increasing the polarity of the solvents and Fig. S1† showed the variation in the emission wavelength with different solvents polarity. The interaction of compound 2 with different polar solvents is mostly stabilized by the local excited states and thus lead to the bathochromic emission.56 Stokes shift was calculated for the different the solvents and the values are obtained in the range of 6574–8368 cm−1 (Table 4), accordingly, the Stokes shift values are significantly increased with increasing the solvent polarity which indicated the presence of different charge distribution in the excited state (S1) as compared to ground state (S0). Here, phenylacrylonitrile part introduced in the imidazole derivative was the responsible for the more Stokes shift value when compare to the simple lophine (6513 cm−1)20 By plotting the Stokes shifts (Δν) against the solvent polarity parameter Δf (ε, n), show approximately a linear relationship according to the Lippert–Mataga plot for the compound 2 (Fig. S2, ESI†). The change of the solvent polarity indicated the enhancement or diminished the electron density in the structure, as well as the intermolecular charge transfer (ICT) due to the strong interaction with the solvent.
2.5 The effect of pH on absorption and emission spectra
There is one basic centre in the compound 2, i.e., imidazole NH group. As mentioned above both absorption and emission spectra showed a bathochromic shift in a polar aprotic solvent. To study the effect of pH on the absorption spectrum of compound 2 and to understand the effect of the electronic density on the π-conjugated through the donor to acceptor part. Fig. 7a shows the proposed mechanism of equilibrium between protonation at pH = 2 and deprotonation at pH = 14 of compound 2 in 5 mL of solvent's mixture THF–water (1![[thin space (1/6-em)]](https://www.rsc.org/images/entities/char_2009.gif) :
:![[thin space (1/6-em)]](https://www.rsc.org/images/entities/char_2009.gif) 1). The experiments were carried out using solutions diluted with HCl and NaOH. Fig. 7b shows appearance of the solutions under normal and UV illumination.
1). The experiments were carried out using solutions diluted with HCl and NaOH. Fig. 7b shows appearance of the solutions under normal and UV illumination.
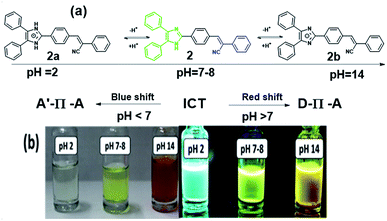 | ||
| Fig. 7 (a) Plausible mechanism of protonation and deprotonation of compound 2 with different pH. (b) Halochromic effect of the compound 2. | ||
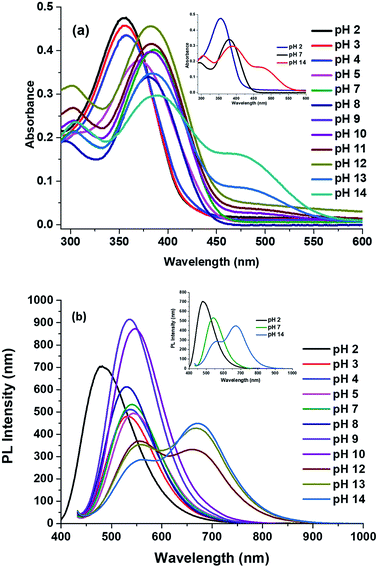
The maxima absorption wavelength as free nitrogen forms of compound 2 appeared at 305 and 381 nm, which corresponding to the n–π* and π–π* transition respectively (Fig. 8a) and exhibit a high molar extinction coefficient (36![[thin space (1/6-em)]](https://www.rsc.org/images/entities/char_2009.gif) 070 M−1 cm−1). When increased the hydrogen ion concentration, (pH = 2), the cation species 2a is formed due to the protonation of the nitrogen atom and the absorption attribute to the n–π* transition vanished, as well as the absorption band due to π–π* transition moves toward to blue region (23 nm) as compared to the neutral compound 2. The formation of species 2a observed by a colour change from greenish yellow to colourless in the visible light (Fig. 7b). The blue shift was obtained due to absence of lone pair in the imidazole which in turn to prevent the charge transfer and acts as acceptor (A). However, at a low concentration of hydrogen ion the bands appeared at 384 nm, and a new broad band was appeared at 467 nm as compared to the neutral species 2 (Fig. 8a). At pH = 7 to 12, the absorption wavelength for n–π* and π–π* transition was almost the same. Further, with the decreasing of the hydrogen ion concentration, (i.e.) pH = 11 to 14, the species 2b was detected when the colour changes of the greenish-yellow solution to reddish-orange. The absorption maxima for the solution (species 2b) appeared at 308, 384 and 467 nm and corresponding to the n–π*, π–π* and possibility of inter- and intra-molecular charge transfers, respectively. Theses red shifts appeared due to great extent of intramolecular charge transfer (ICT) from donor to acceptor.57 The lone pair electron of the anionic species (D) 2b was showed more contribution in the CT compared to the lone pair electron of the neutral species 2.
070 M−1 cm−1). When increased the hydrogen ion concentration, (pH = 2), the cation species 2a is formed due to the protonation of the nitrogen atom and the absorption attribute to the n–π* transition vanished, as well as the absorption band due to π–π* transition moves toward to blue region (23 nm) as compared to the neutral compound 2. The formation of species 2a observed by a colour change from greenish yellow to colourless in the visible light (Fig. 7b). The blue shift was obtained due to absence of lone pair in the imidazole which in turn to prevent the charge transfer and acts as acceptor (A). However, at a low concentration of hydrogen ion the bands appeared at 384 nm, and a new broad band was appeared at 467 nm as compared to the neutral species 2 (Fig. 8a). At pH = 7 to 12, the absorption wavelength for n–π* and π–π* transition was almost the same. Further, with the decreasing of the hydrogen ion concentration, (i.e.) pH = 11 to 14, the species 2b was detected when the colour changes of the greenish-yellow solution to reddish-orange. The absorption maxima for the solution (species 2b) appeared at 308, 384 and 467 nm and corresponding to the n–π*, π–π* and possibility of inter- and intra-molecular charge transfers, respectively. Theses red shifts appeared due to great extent of intramolecular charge transfer (ICT) from donor to acceptor.57 The lone pair electron of the anionic species (D) 2b was showed more contribution in the CT compared to the lone pair electron of the neutral species 2.
The fluorescence spectra of compound 2 at different pH are shown in the Fig. 8b. The species 2a (pH = 2) showed sharp band at 476 nm with a shift to higher energy region of 54 nm compare to the neutral species 2. In the acidic medium (pH = 2), it is possible that due to protonation of imidazole part generating a positive charge 2a and it was reducing the donating character in the structure and presents a strong pull–push effect more than in neutral species 2 (i.e., A′–π–A structural motif), which observed through the emission changing the colour from fluorescence greenish-yellow to cyan (Fig. 7b).
The emission spectra of compound 2 at pH = 8–11, the band was moved to lower energy from 520 nm to 548 nm, but the band is broad with emission from 500 nm to 700 nm with increasing intensity. It shows the charge transfer take place in the initial level (i.e., D–π–A structural motif). According to the measurement, after the pH 12–14, the species 2b was formed which is not making more changes in emission but it could be fine-tuned from greenish-yellow to dark reddish-violet (Fig. 7b). The emission maxima moved from 546 to 561 nm with decreasing intensity meanwhile another peak appeared at 659 nm and it shifted to 671 nm with increasing intensity (Fig. 8b). It indicated that N-3 position of the imidazole ring was deprotonated, and it can induce the intramolecular charge transfer (ICT), between the anion nature of the imidazole ring (D) to phenylacrylonitrile (A).
The alteration of [H+] ion concentration can alter push–pull nature (ICT) between the donor to acceptor. It was well correlating with optical band (Egap) values, calculated by absorption onset (Fig. S4 in ESI†). The Egap values of species 2, 2a and 2b were obtained as 2.81, 2.99 and 2.19 eV respectively (Table 5). The Egap values were changed through the modifying the [H+] ion concentration. The Egap values are higher in acidic medium (pH = 2) than the basic medium (pH = 14). This indication observed in the absorption maxima by blue shift at the acidic medium whereas red shift occurred at the basic medium compared to the neutral condition. These results indicated the compound 2 was able to act as D–π–A or A′–π–A structural motif based on the pH nature and hence it showed a promising candidate for the pH sensor.
| Medium | pH | λabs (nm) | λem (nm) | ΦF | Egap (eV) |
|---|---|---|---|---|---|
| a λabs = maximum absorption wavelength, c = 1.0 × 10⁻³ mol L−1; λem = maximum absorption wavelength, c = 1.0 × 10⁻³ mol L−1; Egap = optical band gap derived from onset wavelength of the UV-Vis absorption spectra. | |||||
| Acidic | 2a | 357 | 476 | 0.07 | 2.99 |
| Neutral | 2 | 305, 381 | 530 | 0.10 | 2.81 |
| Basic | 2b | 308, 384, 467 | 546, 671 | 0.15 | 2.19 |
2.6 Solid state photoluminescence
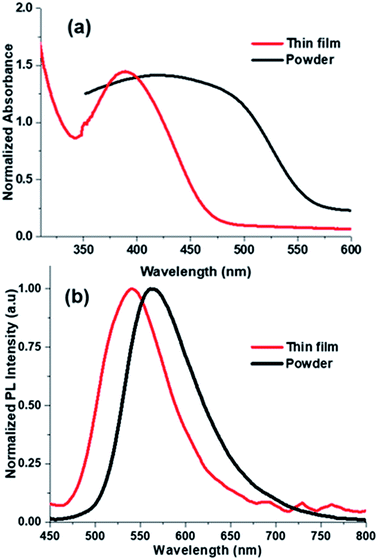
From our group previous experiences, phenyl acrylonitrile derivatives (α-cyanostilbene) exhibited the good solid-state emission which used to make for a better organoelctronic device. In order to examine how imidazole based phenylacrylonitrile showed its solid-state emission properties in the thin film (TF) and powder form. Thin films were deposited onto cleaned glass substrates by two process, one is the spin coating method (solution) and other is the thermal vacuum deposition method. Absorption and emission spectra of the thin film and powder are shown in Fig. 9. The powder showed a spectrum with a broad shape (420 nm), but in thin film showed a defined shape with λabs value at 388 nm. The powder form showed a broadening shape of the absorption maxima may be due to the intermolecular interaction or intramolecular interaction took place. The absorbance and emission spectra are shown in Fig. 9 and corresponding data are listed in Table S6.† The emission spectra of the powder and film showed λem band around 563 nm and 540 nm respectively. The quantum yield of the powder was found to be 16% and, in the solution is 21%.The surface morphology of the films by solution-processed and vacuum evaporation are compared in the Fig. 10. The evaporation process leads to form morphology with agglomerates of about 300 nm and the morphology by solution process showed an arrangement alignment as herringbone. Optical properties, absorption and emission were like the solution-processed films. The thin films prepared by high vacuum deposition were exposed to HCl, H2SO4, HNO3 vapours. After few minutes, the sample exposed to HNO3 only showed the transformation.
 | ||
| Fig. 10 (a) and (b) AFM image of the compound 2 thin film by solution process and (c) morphology image of evaporated films. | ||
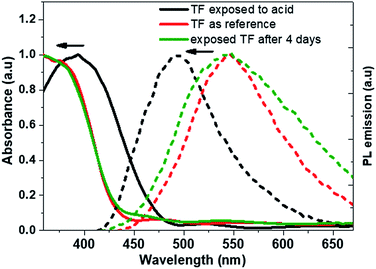
It was followed by absorption measurements and exposed the films under UV lamp was examined to see the change of the fluorescence. Fig. 11a showed a pure film for the reference and Fig. 11b showed exposed to HNO3 vapor film. It can be seen the blue-shift in fluorescence emission, at same wavelength as the compound 2 in solution at pH = 2. The observed phenomenon also was reversible, because after 4 days the films come to the original colour and the fluorescence, Fig. 11c.
Absorption (solid line) and emission (short dashed line) spectra were measured and shown in the Fig. 12. After exposure both spectra showed a hypsochromic effect, for absorption a maximum absorption showed a shift of 37 nm while the emission shifts to 52 nm. As mentioned above, the change in fluorescence was reversible, Fig. 12, showed the absorbance and fluorescence spectra for the compound in thin film exposed to HNO3 and kept at normal atmosphere for four days. Interestingly, the emission is like the original one (λPL = 545 nm). However, the absorbance remains as like the exposed film. It could be the transformation of the organic compound film was not completed. However, the experiment show that it is possible tuning the fluorescence as well as the application as vapor senor fluorescence (Fig. 12).
For making the OLED of compound 2 using the vacuum deposition film and its photo luminance (PL) and electro luminance (EL) spectra are shown in Fig. 13a. The wavelength of maximum emission was about 550 nm. The J–V curve for OLED is shown in Fig. 13b, the threshold voltage was about 4 V, the inset shows a picture for OLED. The average luminance for devices was about 450 cd m−2. It indicates that compound 2 had promising candidate for an electronic device as well as the vapour sensor device.
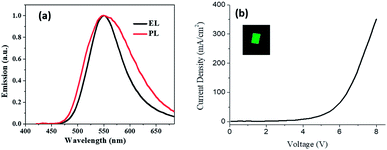 | ||
| Fig. 13 (a) Photoluminescence and electroluminescence spectra of thin film and OLEDs respectively. (b) Electrical characteristics J–V for OLEDs (the inset shows an OLED picture). | ||
2.7 Theoretical calculation
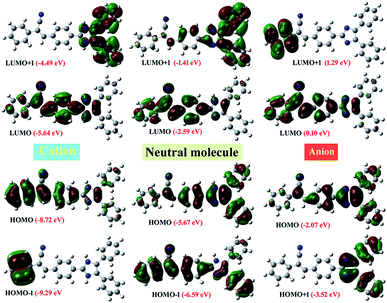
To understand the electronic properties of compound 2, we carried out the TD-DFT calculations in the gas phase and solution state (1,4-dioxane, chloroform, ethyl acetate, THF, DCM, methanol, DMF, and DMSO). It's corresponding to the cation and anion structures with B3LYP/6-311++G (d, p) level of theory. The calculated absorption wavelength (λabs), oscillator strengths (f), and major orbital transitions (in %) for compound 2 is presented in Tables S8 and S9 ESI.† The most important the Frontier molecular orbital (FMO) (Highest Occupied Molecular Orbital, HOMO and Lowest Unoccupied Molecular Orbital, LUMO) are presented in Fig. 14. The computed absorption of the compound 2 in gas phase and in the solutions state showed around 450 nm. These values may be due to the intramolecular charge transfer (H → L transition with 100%) arise from the electron pulling nature of phenylacrylonitrile moiety (acceptor). This CT was observed in the absorption spectrum of powder form but did not observe in the solution and TF (Fig. 9a). The second absorption peaks in the both states showed around 340 nm are corresponding to π → π* transition (H − 1 → L with 86–100%). Another weak transition around 319–330 nm, it belongs to n → π* transition (H → L + 1 with 90–100%). On the other hand, when increasing the solvent polarity, the computed λmax value showed slightly blue shift as like experiment results. To understand the effect of pH on molecular structure, we computed to the absorptions for the compound 2 in the form of the cation and anion environment (Table S9†). From the results, the H → L transition went to blue shift (440 nm in gas and 417 nm in THF), for the cationic environment whereas for the anionic environment absorption moved to a strong red shift (at 582 nm in gas and 562 nm in THF). These results are matched with in the pH experimental values. In order to understand for the strong Stokes shift observed at pH 14. It was performed the HOMO–LUMO analysis for the compound 2 at neutral, cation and anion environment. The HOMO and LUMO energy level of compound 2 (at neutral) was of −5.67 eV and −2.59 eV respectively, and it's ΔEgap of 3.08 eV. These results were closer to the experimental results of the CV measurements (Fig. S5,† HOMO is −5.677 eV and LUMO is −2.868 eV; ΔEgap of 2.81 eV). It noted that the HOMO and LUMO of cation is more stabilized with 3.05 eV than the neutral molecule. Whereas HOMO of anion is less stabilized with 3.60 eV and 2.69 eV for LUMO of anion than neutral molecule. These variations in energy level of FMO is might be reason for the blue shift absorption and emission in acidic and red shift in the basic medium.To recognise that the origin of intramolecular charge transfer in the title molecule, we carried out the NBO analysis for neutral, cation and anionic state of the molecule (Tables S8 and S9†). The result suggested that the whole molecule involved in the intramolecular charge transfer process. Briefly, the phenylacrylnitrile moiety in the neutral molecule is predominately involved in the charge transfer process with the strong stabilization energy. Whereas the imidazole moiety is strongly or moderately involved in the intramolecular charge transfer process with moderate stabilization energy in the cation and anion environment. The NBO analysis suggested that the phenylacrylonitrile moiety acts as a strong electron withdrawing moiety and it enhanced the intramolecular charges transfer along the whole molecule.
Finally, the optoelectronic calculations with the aid Schrödinger programme, we compute the oxidation potential and reduction potential values of compound 2 help us to see that the compound to loose/gain electrons. From the CV values are of 1.455 eV and −1.354 eV respectively, that compared with the calculated are closer for the reduction potential with a difference −0.0461 eV between the calculated and experimental. That is an indication that the compound 2 acta more acceptor than donating. The presence of the electro withdrawing CN group in the molecule is responsible for an oxidation potential higher than similar molecule imidazole groups.58 In the Table S5,† exhibits hole and electron reorganization energies (HRE and ERE). It is worth to notice that the reorganization energy (RE) is one of the parameters governing the hopping rate. It has long been recognized that HRE and ERE are closely related to the geometries of cation and anion states. In fact, the RE is defined as the energy difference between the charged and neutral systems. The molecules with small RE possess high carrier mobility and these energies are in proportion to the deformation of the geometries in charge transfer process. In compound 2 the HRE is 0.1064 smaller than the ERE indicating a smaller geometrical deformation upon electron injection compared to hole injection. This value is remarkably small, indicated that the hole extraction potential of 6.368 eV, which demonstrates that the injection of hole into compound 2 is slightly easier. On the contrary, compound 2 has maximum electron extraction potential of −1.2032 eV, indicating that the injection of electron into the compound 2 becomes much difficult.
3. Conclusion
In summary, it was designed a novel Imidazole based luminogenic compound was characterized by SCXRD, FT-IR, 1H NMR, 13C NMR and EIMS. We investigated the photophysical properties of compound 2 in solution state with various solvents and in the solid states (TF and powder). In the solution state, it showed the positive solvatochromic behaviour and it had a solid-state emission too. Furthermore, by varying the pH medium to observe the intramolecular charge transfer in solution and solid state (TF) and it resulted the halochromic behaviour. The phenyl rings of imidazole moiety trigged by protonation and deprotonation of the imidazole group and its reason for the electronic transition (ICT) via C-2 phenyl ring to the acceptor of phenyl acrylonitrile group. Based on that compound 2 can be used as pH sensor for solution and vapor medium. Optical band gap values are estimated from cyclic voltammetry and the absorption onset. Overall, compound 2 can able to act as D–π–A as well as A′–π–A based on the pH nature. In addition, the compound was used as emitting layer in OLEDs with acceptable performance. TD-DFT computations and the energy levels of FMO are very closer to the experimental results and it aid to give an insight idea to support the studies. Therefore, it can act as a new multi-functional material for the field of sensor and organo-electronic application.4. Experimental section
4.1 Materials and instruments
Benzil(1,2-diphenylethane-1,2-dione), phenylacetonitrile, 4-formylbenzaldehyde (1,4-terephtaldehyde) and ammonium acetate were acquired from Aldrich Chemical Co. and Fermont. The reagents and solvents were used as received without any additional purification. Melting points were measured with an SEV (0–300 °C) apparatus and were reported as uncorrected values. IR spectra of the products were recorded on a Vertex (model 70, Bruker Optics, Germany) 750 FT-IR spectrophotometer by attenuated total reflectance (ATR). 1H NMR and 13C NMR spectra were obtained in DMSO-d6 on a Bruker 500 MHz NMR spectrometer. The electron ionization (EI) spectra were acquired on a Jeol MStation 700-D mass spectrometer (Jeol USA, Peabody, MA). Absorbance and emission (UV-Vis and PL). The absorbance spectra were measured using a spectrometer Cary 300 (Agilent) equipped with a deuterium and halogen lamp. Emission spectra (PL) were acquired with a QE-Pro-FL (Ocean Optics, Dunedin, FL) an UV-Lamp Mineral Light with emission at 401 nm was used as excitation source. I–V curves were acquired with a source-meter Keithley 2450. Electroluminescence spectra were recorded with an Ocean Optics spectrometer. The morphology and thickness were analyzed using atomic force microscopy (AFM) with the microscope EasyScan2 from Nanosurf operating in contact mode under ambient conditions. This has a maximum square scanning area of 110 μm. The adjustment of pH solutions was achieved through the addition of NaOH or HCl solutions and monitored with the aid of Metrohm 716 DMS Titrino Titrator pH meter using buffers of pH 4.0 and pH 9.2 as calibrants. Cyclic Voltammetry (CV) measurements were carried out with a potentiostat (PGSTAT128N), using a three-electrode cell assembly comprising Ag/Ag+ in a 3 M solution of KCl as a reference electrode, a platinum wire (ϕ = 0.2 mm) as the working electrode, a 0.1 M solution of tetrabutylammonium hexafluorophosphate (TBAFP6) CH2Cl2 as a supporting electrolyte and a platinum wire as the counter electrode. Ferrocene was used as an external standard. The scanning rate was 50 mV s−1.4.2 Synthesis of 4-(4,5-diphenyl-1H-imidazol-2-yl) benzaldehyde (1)
A mixture of 4-formylbenzaldehyde (500 mg, 3.730 mmol), benzil (627 mg, 3.730 mmol), NH4OAc (3.45 mg, 44.76 mmol) in acetic acid (50 mL) was refluxed for 5 hours, and then cooled to room temperature. The reaction mixture was poured into the ice-cold water and allowed to be left for 1 h, filtered, and the yellow precipitate was washed with water. The crude product was suspended in EtOAc and filter it. The filtrate was concentrated by evaporation and the solid product washed with 5% (EtOAc![[thin space (1/6-em)]](https://www.rsc.org/images/entities/char_2009.gif) :
:![[thin space (1/6-em)]](https://www.rsc.org/images/entities/char_2009.gif) Hex). The product was identified by their spectral data.78 Pale yellow solid, yield: 42%, mp 233–235 °C (lit. 72 233–235 °C); 1H NMR (500 MHz, DMSO) δ 13.04 (s, 1H), 10.04 (s, 1H), 8.31 (d, J = 8.3 Hz, 2H), 8.02 (d, J = 8.5 Hz, 2H), 7.55 (dd, J = 16.8, 7.4 Hz, 4H), 7.47 (t, J = 7.4 Hz, 2H), 7.42 (d, J = 7.2 Hz, 1H), 7.33 (t, J = 7.5 Hz, 2H), 7.26 (d, J = 7.2 Hz, 1H). IR (KBr, cm−1): 1696(–CHO), 1605(–C
Hex). The product was identified by their spectral data.78 Pale yellow solid, yield: 42%, mp 233–235 °C (lit. 72 233–235 °C); 1H NMR (500 MHz, DMSO) δ 13.04 (s, 1H), 10.04 (s, 1H), 8.31 (d, J = 8.3 Hz, 2H), 8.02 (d, J = 8.5 Hz, 2H), 7.55 (dd, J = 16.8, 7.4 Hz, 4H), 7.47 (t, J = 7.4 Hz, 2H), 7.42 (d, J = 7.2 Hz, 1H), 7.33 (t, J = 7.5 Hz, 2H), 7.26 (d, J = 7.2 Hz, 1H). IR (KBr, cm−1): 1696(–CHO), 1605(–C![[double bond, length as m-dash]](https://www.rsc.org/images/entities/char_e001.gif) NH–), 1309 (–C–N).
NH–), 1309 (–C–N).
4.3 Synthesis of (Z)-3-(4-(4,5-diphenyl-1H-imidazol-2-yl)phenyl)-2-phenylacrylonitrile (2)
A mixture of the compound 1 (50 mg, 0.1542 mmol), 2-phenyl acetonitrile (18 mg, 0.1542 mmol), KOH (1.7 mg, 0.03084 mmol) in MeOH (2 mL) was refluxed for 6 hours to get compound 2 as a yellow solid. After completion, the reaction mixture was dried, added a water to filter the resulting precipitate. For neutralize the precipitate, water was used to wash. In order to recrystallization, briefly, 0.05 g of the title compound was dissolved in 20 mL commercial MeOH, heated at 85 °C for 2 h, filter it and allowed to evaporate the filtrate slowly at room temperature. The expected product was obtained as crystal. Yellow solid, yield: 65%, mp. 244–246 °C; 1H NMR (500 MHz, CDCl3, δ) 9.92 (s, 1H, –NH), 7.95 (d, 2H, J = 10 Hz, ArH), 7.90 (d, 2H, J = 10 Hz, ArH), 7.59–7.58 (m, 4H, ArH), 7.47 (s, 1H,![[double bond, length as m-dash]](https://www.rsc.org/images/entities/char_e001.gif) CH), 7.40–7.24 (m, 11H); 13C NMR (100 MHz, CDCl3, δ) 145.0, 141.6, 134.4, 133.6, 131.6, 129.9, 129.1, 128.9, 128.4, 127.9, 126.0, 125.5, 118.2, 111.4; IR (KBr, cm−1) ν: 3301(NH), 2211 (–C
CH), 7.40–7.24 (m, 11H); 13C NMR (100 MHz, CDCl3, δ) 145.0, 141.6, 134.4, 133.6, 131.6, 129.9, 129.1, 128.9, 128.4, 127.9, 126.0, 125.5, 118.2, 111.4; IR (KBr, cm−1) ν: 3301(NH), 2211 (–C![[triple bond, length as m-dash]](https://www.rsc.org/images/entities/char_e002.gif) N), 1593(–CH
N), 1593(–CH![[double bond, length as m-dash]](https://www.rsc.org/images/entities/char_e001.gif) N–), 1363(–C–N–); MS (ESI): [M+] calculated for C30H21N3 423.17, found 423.0, 154 (100%), 136 (72%), 307 (21%)
N–), 1363(–C–N–); MS (ESI): [M+] calculated for C30H21N3 423.17, found 423.0, 154 (100%), 136 (72%), 307 (21%)
Conflicts of interest
There are no conflicts to declare.Acknowledgements
The authors wish to express their gratitude to VIEP-BUAP (project PEZM-NAT16-G), to project fellowship-PRODEP-SEP 511-6/17-11066 and 511-6/18-16257, to Maxime Siegler for the X-ray determination, Laboratorio Nacional de Supercómputo del Sureste (LNS-BUAP) to perform the calculations as well as to Vladimir Carranza for technical assistance with mass spectrometry.Notes and references
- H. Schill, S. Nizamov, F. Bottanelli, J. Bierwagen, V. N. Belov and S. W. Hell, Chem.–Eur. J., 2013, 19, 16556–16565 CrossRef CAS PubMed.
- D. Huang, T. Zhao, W. Xu, T. Yang and P. S. Cremer, Anal. Chem., 2013, 85, 10240–10248 CrossRef CAS PubMed.
- X.-D. Liu, Y. Xu, R. Sun, Y.-J. Xu, J.-M. Lu and J.-F. Ge, Analyst, 2013, 138, 6542–6550 RSC.
- G. Gryn’ova and C. Corminboeuf, J. Phys. Chem. Lett., 2018, 9, 2298–2304 CrossRef PubMed.
- S. Sasaki, G. P. C. Drummen and G. Konishi, J. Mater. Chem. C, 2016, 4, 2731–2743 RSC.
- C. Wu, J. Wei, D. Tian, Y. Feng, R. H. Miller and Y. Wang, J. Med. Chem., 2008, 51, 6682–6688 CrossRef CAS PubMed.
- G. Cheng, D. Wenyue, Y. Liang, L. Ying, Z. Zhongbo, L. Dan and M. Yuguang, Adv. Mater., 2012, 24, 2413–2417 CrossRef PubMed.
- J. S. Wilson, M. J. Frampton, J. J. Michels, L. Sardone, G. Marletta, R. H. Friend, P. Samori, H. L. Anderson and F. Cacialli, Adv. Mater., 2005, 17, 2659–2663 CrossRef CAS.
- P. Zrazhevskiy, M. Sena and X. Gao, Chem. Soc. Rev., 2010, 39, 4326–4354 RSC.
- H. Sasabe and J. Kido, Chem. Mater., 2011, 23, 621–630 CrossRef CAS.
- D. Ding, J. Liang, H. Shi, R. T. K. Kwok, M. Gao, G. Feng, Y. Yuan, B. Z. Tang and B. Liu, J. Mater. Chem. B, 2014, 2, 231–238 RSC.
- M. Klikar, P. Solanke, J. Tydlitát and F. Bureš, Chem. Rec., 2016, 16, 1886–1905 CrossRef CAS PubMed.
- W. Aigner, O. Bienek, B. P. Falcão, S. U. Ahmed, H. Wiggers, M. Stutzmann and R. N. Pereira, Nanoscale, 2018, 10, 8042–8057 RSC.
- S. Jhulki and J. N. Moorthy, J. Mater. Chem. C, 2018, 6, 8280–8325 RSC.
- P. Kan-Yi and L. Bin, Adv. Funct. Mater., 2009, 19, 277–284 CrossRef.
- T. P. I. Saragi, T. Spehr, A. Siebert, T. Fuhrmann-Lieker and J. Salbeck, Chem. Rev., 2007, 107, 1011–1065 CrossRef CAS PubMed.
- A. Kundu, S. Karthikeyan, Y. Sagara, D. Moon and S. P. Anthony, Phys. Chem. Chem. Phys., 2018, 20, 27385–27393 RSC.
- G. Wiethaus, J. M. Toldo, F. da Silveira Santos, R. da Costa Duarte, P. F. B. Gonçalves and F. S. Rodembusch, Phys. Chem. Chem. Phys., 2019, 21, 4408–4420 RSC.
- Z. Fang, S. Wang, L. Zhao, Z. Xu, J. Ren, X. Wang and Q. Yang, Mater. Chem. Phys., 2008, 107, 305–309 CrossRef CAS.
- A. Hariharasubramanian and Y. D. Ravichandran, RSC Adv., 2014, 4, 54740–54746 RSC.
- Y. Zhang, S.-L. Lai, Q.-X. Tong, M.-F. Lo, T.-W. Ng, M.-Y. Chan, Z.-C. Wen, J. He, K.-S. Jeff, X.-L. Tang, W.-M. Liu, C.-C. Ko, P.-F. Wang and C.-S. Lee, Chem. Mater., 2012, 24, 61–70 CrossRef.
- H.-M. Zhang, W.-F. Fu, S.-M. Chi and J. Wang, J. Lumin., 2009, 129, 589–594 CrossRef CAS.
- J. Kulhánek and F. Bureš, Beilstein J. Org. Chem., 2012, 8, 25–49 CrossRef PubMed.
- J. Jayabharathi, V. Thanikachalam, N. Srinivasan and M. V Perumal, Spectrochim. Acta, Part A, 2012, 90, 125–130 CrossRef CAS PubMed.
- J. Mandal, P. Ghorai, P. Brandão, K. Pal, P. Karmakar and A. Saha, New J. Chem., 2018, 42, 19818–19826 RSC.
- R. Bag, Y. Sikdar, S. Sahu, D. K. Maiti, A. Frontera, A. Bauzá, M. G. B. Drew and S. Goswami, Dalton Trans., 2018, 47, 17077–17085 RSC.
- N. Fridman, M. Kaftory, Y. Eichen and S. Speiser, J. Mol. Struct., 2009, 917, 101–109 CrossRef CAS.
- M. Y. Berezin, J. Kao and S. Achilefu, Chem.–Eur. J., 2009, 15, 3560–3566 CrossRef CAS PubMed.
- K. Aggarwal and J. M. Khurana, J. Photochem. Photobiol., A, 2015, 307–308, 23–29 CrossRef CAS.
- A. Safavi and M. Bagheri, Sens. Actuators, B, 2003, 90, 143–150 CrossRef CAS.
- B. Kumari, S. P. Singh, R. Santosh, A. Dutta, S. S. Mallajosyula, S. Ghosal and S. Kanvah, New J. Chem., 2019, 43, 4106–4115 RSC.
- L. Zhu and Y. Zhao, J. Mater. Chem. C, 2013, 1, 1059–1065 RSC.
- J. N. Zhang, H. Kang, N. Li, S. M. Zhou, H. M. Sun, S. W. Yin, N. Zhao and B. Z. Tang, Chem. Sci., 2017, 8, 577–582 RSC.
- M. Martínez-Abadía, R. Giménez and M. B. Ros, Adv. Mater., 2018, 30, 1704161 CrossRef PubMed.
- C. Dou, L. Han, S. Zhao, H. Zhang and Y. Wang, J. Phys. Chem. Lett., 2011, 2, 666–670 CrossRef CAS.
- R. Usman, A. Khan, M. Wang, Y. Luo, W. Sun, H. Sun, C. Du and N. He, Cryst. Growth Des., 2018, 18, 6001–6008 CrossRef CAS.
- M. Wykes, S. K. Park, S. Bhattacharyya, S. Varghese, J. E. Kwon, D. R. Whang, I. Cho, R. Wannemacher, L. Lüer, S. Y. Park and J. Gierschner, J. Phys. Chem. Lett., 2015, 6, 3682–3687 CrossRef CAS PubMed.
- M. J. Percino, V. M. Chapela, E. Pérez-Gutiérrez, M. Cerón and G. Soriano, Chem. Pap., 2011, 65, 42–51 CAS.
- M. Castro, M. Percino, V. Chapela, M. Ceron, G. Soriano-Moro, J. Lopez-Cruz, F. Melendez, M. E. Castro, M. J. Percino, V. M. Chapela, M. Ceron, G. Soriano-Moro, J. Lopez-Cruz and F. J. Melendez, Int. J. Mol. Sci., 2013, 14, 4005–4029 CrossRef CAS PubMed.
- M. J. Percino, V. M. Chapela, L.-F. Montiel, E. Pérez-Gutiérrez and J. L. Maldonado, Chem. Pap., 2010, 64, 360–367 CAS.
- Z.-Q. Yan, Z.-Y. Yang, H. Wang, A.-W. Li, L.-P. Wang, H. Yang and B.-R. Gao, Spectrochim. Acta, Part A, 2011, 78, 1640–1645 CrossRef PubMed.
- Y. Li, F. Li, H. Zhang, Z. Xie, W. Xie, H. Xu, B. Li, F. Shen, L. Ye, M. Hanif, D. Ma and Y. Ma, Chem. Commun., 2007, 231–233 RSC.
- B.-R. Gao, H.-Y. Wang, Y.-W. Hao, L.-M. Fu, H.-H. Fang, Y. Jiang, L. Wang, Q.-D. Chen, H. Xia, L.-Y. Pan, Y.-G. Ma and H.-B. Sun, J. Phys. Chem. B, 2010, 114, 128–134 CrossRef CAS PubMed.
- F. H. Allen, O. Kennard, D. G. Watson, L. Brammer, A. G. Orpen and R. Taylor, J. Chem. Soc., Perkin Trans. 2, 1987, S1–S19 RSC.
- K. Molčanov, I. Sabljić and B. Kojić-Prodić, CrystEngComm, 2011, 13, 4211–4217 RSC.
- O. V Dolomanov, L. J. Bourhis, R. J. Gildea, J. A. K. Howard and H. Puschmann, J. Appl. Crystallogr., 2009, 42, 339–341 CrossRef.
- T. Steiner, Angew. Chem., Int. Ed., 2002, 41, 48–76 CrossRef CAS.
- M. Inoue and I. Hirasawa, J. Cryst. Growth, 2013, 380, 169–175 CrossRef CAS.
- Z.-B. Cai, L. Bai, Y.-L. Pan, F.-F. Ma, S.-L. Li and Y.-P. Tian, J. Photochem. Photobiol., A, 2017, 346, 194–205 CrossRef CAS.
- G.-C. Zheng, Z.-B. Cai, Y.-L. Pan, L. Bai, Y.-T. Zhou, S.-L. Li and Y.-P. Tian, Tetrahedron, 2016, 72, 2988–2996 CrossRef CAS.
- M. J. Percino, M. Cerón, G. Soriano-Moro, M. E. Castro, V. M. Chapela, J. Bonilla, M. Reyes-Reyes and R. López-Sandoval, CrystEngComm, 2014, 16, 8591–8604 RSC.
- M. M. Duvenhage, M. Ntwaeaborwa, H. G. Visser, P. J. Swarts, J. C. Swarts and H. C. Swart, Opt. Mater., 2015, 42, 193–198 CrossRef CAS.
- J. C. S. Costa, R. J. S. Taveira, C. F. R. A. C. Lima, A. Mendes and L. M. N. B. F. Santos, Opt. Mater., 2016, 58, 51–60 CrossRef CAS.
- S. Dhami, A. J. De Mello, G. Rumbles, S. M. Bishop, D. Phillips and A. Beeby, Photochem. Photobiol., 2018, 61, 341–346 CrossRef.
- M. J. Wirth, TrAC, Trends Anal. Chem., 1982, 1, 383–386 CrossRef CAS.
- R. Ghosh and D. K. Palit, Photochem. Photobiol. Sci., 2013, 12, 987–995 RSC.
- A. O. Eseola, O. Adepitan, H. Görls and W. Plass, New J. Chem., 2012, 36, 891–902 RSC.
- J. J. Guerard, P. R. Tentscher, M. Seijo and J. Samuel Arey, Phys. Chem. Chem. Phys., 2015, 17, 14811–14826 RSC.
- G. M. Sheldrick, Acta Crystallogr., Sect. C: Struct. Chem., 2015, 71, 3–8 Search PubMed.
- M. J. Frisch, G. W. Trucks, H. B. Schlegel, G. E. Scuseria, M. A. Robb, J. R. Cheeseman, G. Scalmani, V. Barone, B. Mennucci, G. A. Petersson, H. Nakatsuji, M. Caricato, X. Li, H. P. Hratchian, A. F. Izmaylov, J. Bloino, G. Zheng, J. L. Sonnenberg, M. Hada, M. Ehara, K. Toyota, R. Fukuda, J. Hasegawa, M. Ishida, T. Nakajima, Y. Honda, O. Kitao, H. Nakai, T. Vreven, J. A. Montgomery, J. E. Peralta, F. Ogliaro, M. Bearpark, J. J. Heyd, E. Brothers, K. N. Kudin, V. N. Staroverov, R. Kobayashi, J. Normand, K. Raghavachari, A. Rendell, J. C. Burant, S. S. Iyengar, J. Tomasi, M. Cossi, N. Rega, J. M. Millam, M. Klene, J. E. Knox, J. B. Cross, V. Bakken, C. Adamo, J. Jaramillo, R. Gomperts, R. E. Stratmann, O. Yazyev, A. J. Austin, R. Cammi, C. Pomelli, J. W. Ochterski, R. L. Martin, K. Morokuma, V. G. Zakrzewski, G. A. Voth, P. Salvador, J. J. Dannenberg, S. Dapprich, A. D. Daniels, O. Farkas, J. B. Foresman, J. V. Ortiz, J. Cioslowski and D. J. Fox, Gaussian 09, Revis. B.01, Gaussian, Inc., Wallingford CT, 2009 Search PubMed.
- Y. Zhao, N. E. Schultz and D. G. Truhlar, J. Chem. Theory Comput., 2006, 2, 364–382 CrossRef PubMed.
- E. G. Hohenstein, S. T. Chill and C. D. Sherrill, J. Chem. Theory Comput., 2008, 4, 1996–2000 CrossRef CAS PubMed.
- S. Grimme, J. Antony, S. Ehrlich and H. Krieg, J. Chem. Phys., 2010, 132, 154104 CrossRef PubMed.
- J. Percino, M. Cerón, P. Venkatesan, P. Ceballos, A. Bañuelos, O. Rodríguez, M. A. Siegler, F. Robles, V. M. Chapela, G. Soriano-Moro, E. Pérez-Gutiérrez, J. Bonilla-Cruz and S. Thamotharan, Cryst. Growth Des., 2017, 17, 1679–1694 CrossRef CAS.
- M. J. Percino, M. Cerón, O. Rodríguez, G. Soriano-Moro, M. E. Castro, V. M. Chapela, M. A. Siegler and E. Pérez-Gutiérrez, Molecules, 2016, 21, 389 CrossRef PubMed.
- P. Venkatesan, M. Cerón, S. Thamotharan, F. Robles and M. J. Percino, CrystEngComm, 2018, 20, 2681–2697 RSC.
- P. Venkatesan, S. Thamotharan, A. Ilangovan, H. Liang and T. Sundius, Spectrochim. Acta, Part A, 2016, 153, 625–636 CrossRef CAS PubMed.
- P. Venkatesan, V. Rajakannan, N. S. Venkataramanan, A. Ilangovan, T. Sundius and S. Thamotharan, J. Mol. Struct., 2016, 1119, 259–268 CrossRef CAS.
- M. Udayakumar, J. Kothandapani, S. S. Ganesan, N. S. Venkataramanan, S. Madan Kumar, K. Byrappa and S. Thamotharan, J. Mol. Struct., 2017, 1133, 510–518 CrossRef CAS.
- J. Tomasi, B. Mennucci and R. Cammi, Chem. Rev., 2005, 105, 2999–3094 CrossRef CAS PubMed.
- S. Miertuš, E. Scrocco and J. Tomasi, Chem. Phys., 1981, 55, 117–129 CrossRef.
- W. Kohn and L. J. Sham, Phys. Rev., 1965, 140, A1133–A1138 CrossRef.
- A. D. Bochevarov, E. Harder, T. F. Hughes, J. R. Greenwood, D. A. Braden, D. M. Philipp, D. Rinaldo, M. D. Halls, J. Zhang and R. A. Friesner, Int. J. Quantum Chem., 2013, 113, 2110–2142 CrossRef CAS.
- J. Breu, P. Stössel, S. Schrader, A. Starukhin, W. J. Finkenzeller and H. Yersin, Chem. Mater., 2005, 17, 1745–1752 CrossRef CAS.
- A. D. Becke, J. Chem. Phys., 1993, 98, 5648–5652 CrossRef CAS.
- C. Lee, W. Yang and R. G. Parr, Phys. Rev. B: Condens. Matter Mater. Phys., 1988, 37, 785–789 CrossRef CAS.
- B. Miehlich, A. Savin, H. Stoll and H. Preuss, Chem. Phys. Lett., 1989, 157, 200–206 CrossRef CAS.
- X. Chen, C. Jia, Z. Wan, J. Feng and X. Yao, Org. Electron., 2014, 15, 2240–2249 CrossRef CAS.
Footnote |
| † Electronic supplementary information (ESI) available. CCDC 1888014. For ESI and crystallographic data in CIF or other electronic format see DOI: 10.1039/c9ra01275c |
| This journal is © The Royal Society of Chemistry 2019 |

