 Open Access Article
Effects of membrane thickness on the performance of ionic polymer–metal composite actuators†
Chungik Oha,
Suran Kima,
Hongjun Kima,
Gun Parka,
Jaegyu Kima,
Jeongjae Ryua,
Panpan Lia,
Sunghwan Lee b,
Kwangsoo Noa and
Seungbum Hong
 *ac
*ac
aDepartment of Materials Science and Engineering, KAIST, Daejeon 34141, Korea. E-mail: seungbum@kaist.ac.kr
bSchool of Engineering Technology, Purdue University, West Lafayette, IN 47907, USA
cKAIST Institute for the NanoCentury, Daejeon 34141, Korea
First published on 10th May 2019
Abstract
In this study, we report the effects of Nafion thickness on the performance of ionic polymer–metal composite (IPMC) actuators. We analyzed the actuation properties of the IPMC actuators, such as displacement and tip force, under external voltage, as a function of their thickness. In order to understand the relationship between thickness and actuation properties, we developed a semi-quantitative model of voltage induced ionic diffusion and its contribution to bending of the Nafion cantilever. Furthermore, we investigated the mechanical properties of the Nafion membranes at sub-micro scale as well as bulk scale, using atomic force microscopy (AFM) and tensile test. The results of the two methods indicated opposite trends of elastic modulus and crystallinity as a function of thickness. We hypothesized that the hot-pressed Nafion was composed of three layers with different crystallinity. Our results suggest that for a high performance IPMC actuator, we need better control of the annealing temperature gradient.
1. Introduction
Ionic polymer metal composite (IPMC) actuators which exhibit electromechanical transduction have attracted significant interest for soft actuator applications such as artificial muscles, biomimetic robots, and biomedicines. The general IPMC structure is electrode/membrane (ionic polymer)/electrode, and overall device performance is, in large part, dependent on the properties of the membrane. Nafion (perfluorosulfonate),1–5 Flemion (perfluorocarboxylate)6–8 and other perfluorinated compounds such as aciplex (perfluorosulfonate) and hyflon (perfluoroalkoxy) are widely employed as a membrane for IPMC actuators, due to their low weight, flexibility and large displacement under low driving voltage (<5 V).5,9 Among these ionic polymers, Nafion has gained particular attention because of its excellent chemical resistance, a higher working temperature as compared to other polymers and high ion conductivity.3–5,7–11Many studies have been carried out to improve the performance of IPMC actuators using Nafion composites or other polymers, including carbon materials such as graphene,12,13 multi-walled carbon nanotubes (MWCNT),14,15 and oxide particles such as BaTiO3.16 The polymers investigated to replace Nafion include kraton,17 poly-vinylidene fluoride (PVDF)/polyvinyl pyrrolidone (PVP)/polystyrene sulfuric acid (PSSA)18 and a series of sulfonated polysulfone (SPSU).19
Another method to improve the performance of IPMC actuators is to replace the electrode materials. Conventionally, IPMC actuators are fabricated by electroless plating platinum (Pt) electrodes onto a Nafion membrane.20 However, this method is time consuming and expensive. In addition, the metal electrode experiences cracking during operation, which causes performance degradation. Therefore, simpler electrode deposition methods such as dip coating,21 and replacing the metal materials with conducting material/Nafion composites in the electrodes have been studied. Carbon materials such as graphene13,21 and MWCNT have been used as the conducting materials. Other metals, such as gold (Au),22,23 palladium (Pd),22–24 and conductive polymers such as poly(3,4-ethylenedioxythiophene) polystyrene sulfonate (PEDOT:PSS)25 have also been used as electrodes.
However, basic factors, such as the thickness dependence of performance, are not well understood at multiscale. The thickness of the Nafion membranes is closely related to the performance of the actuators. Therefore, we systematically analyzed actuation performance under an external voltage to find how Nafion membrane thickness affects the performance of IPMC actuators. In addition, to understand the properties of hot-pressed Nafion membrane, we investigated the crystallinity and mechanical properties of Nafion membrane using atomic force microscopy (AFM) and tensile tests.
2. Experimental
To make Nafion membranes (NR212, N117, Dupont) with different thicknesses, the Nafion membranes were hot-pressed at 150 °C at a uniaxial pressure of 30 MPa for 30 min. The reason we chose 150 °C is that the membrane spreads out at temperatures over 160 °C. This may be related to the two different glass transition temperatures, at 100–120 °C and 190–240 °C.26–28 We set the pressing time to 30 min because there was no significant difference when we varied the time up to 5 h.The IPMC actuators (width/length = 1 cm/3 cm) were fabricated using a direct-assembly-process (DAP). In order to increase the interfacial area and enhance adhesion between the Nafion membrane and electrodes, the surface of the Nafion was roughened using sandpaper (#1200). For the electrode material, multi-wall carbon nanotubes (MWCNTs, Applied Carbon Nano Technology Co.) were utilized. The solution of MWCNTs, Nafion dispersion and isopropyl alcohol was prepared by stirring the mixture for 1 h, and then the solution was painted on both sides of the cast Nafion membranes, followed by drying at 120 °C for 20 min. To further enhance adhesion between the electrodes and Nafion films, the samples were hot-pressed at 110 °C at a uniaxial pressure of 10 MPa for 10 min as shown in ESI Fig. S1.†
Atomic force microscopy (AFM) analysis was performed to evaluate the effect of the roughening treatment on the surface and ANOVA test was performed to verify the reproducibility and repeatability of the roughening process based on the results [see ESI Fig. S2 and Table S1†].
The performance of the IPMC actuators was systematically evaluated. The displacement of the devices was monitored at an ac voltage of 3 V, 0.5 Hz using a displacement measurement sensor (OD85-20T1, SICK), whose laser beam was illuminated perpendicular to the tip of the devices. The distance (d0) between the laser point and fixed end point of IPMC strip is about 86 mm ± 19 mm. The displacement (d) was measured by subtracting the measured distance from the initial value of distance as shown in ESI Fig. S3(a) and (c).† A load cell (GSO-30, Transducer Techniques) was used to measure the tip force of the actuators. The IPMC actuators were attached to one end of the pin of the load cell in an initial condition (zero displacement) as shown in ESI Fig. S3(b).†
To measure the elastic modulus of the Nafion membrane in nano-micro scale, we used an atomic force microscopy (AFM) indentation method as shown in ESI Fig. S4.†
3. Results and discussion
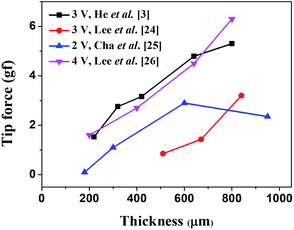
We surveyed the reported maximum tip forces that had been observed when a dc bias voltage was applied across the Nafion membrane as a function of its thickness as shown in Fig. 1.3,29–31 Although variations were observed between different groups, the general trend shows that as the thickness of the Nafion membrane increases, the tip force tends to increase. Many groups attributed this trend to the increase in bending stiffness as a function of IPMC thickness. The bending stiffness (EI) is proportional to the cube of the thickness for rectangular cantilever shapes, which is the multiplication of the elastic modulus and moment of inertia as shown in eqn (1).
 | (1) |
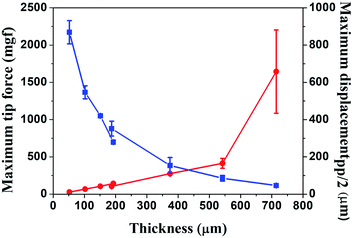
In order to quantitatively understand the thickness dependence of both maximum tip force and maximum displacement, we fabricated Nafion membrane-based cantilevers with different thickness from 52 μm to 714 μm. Fig. 2 shows the maximum displacement (blue line) under an ac voltage of 3 V, 0.5 Hz and the maximum tip force (red line) under a dc voltage of 3 V, as a function of the Nafion membrane thickness. As the thickness of the Nafion membrane increased, the maximum displacement decreased, and the maximum tip force increased, in a trend similar to Fig. 1.
The reason for the smaller absolute values of maximum tip force for the same thickness may have to do with differences in the dimensions (width and length) of the IPMC actuators. He et al.3 and Lee et al.29 operated theirs under a dc voltage of 3 V, with dimensions of 5 mm × 20 mm and 5 mm × 30 mm, respectively. Cha et al.30 and Lee et al.31 operated IPMC actuators under dc voltages of 2 V and 4 V, respectively, with dimensions (width and length) of 5 mm × 30 mm and 5 × 10 mm, respectively.
Another reason may be that the electrodes they used in their IPMC actuators were different. They deposited platinum (Pt) by electroless plating,3,29–31 but we used MWCNTs/Nafion composite as electrodes.
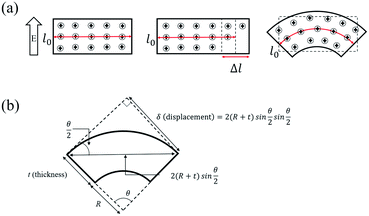
In order to explain the migration of ions and the volume change of the Nafion membrane with the external applied voltage, we provide a schematic diagram in Fig. 3(a). We assume that when we apply voltage there will be an electrical driving force in the form of electric field E setting the ionic current J,
 | (2) |

 | (3) |
 | (4) |
| σΔV = −DΔC + consant | (5) |
So for given ΔV, σ, and D, ΔC should be constant regardless of the thickness. Since we assume that the H+ concentration is uniform before the application of voltage, ΔC = 0 when ΔV = 0. Therefore, the integration constant will be zero in our case, and eqn (5) will change to eqn (6) as shown below.
| σΔV = −DΔC | (6) |
The meaning of eqn (6) is that when we apply the same voltage (ΔV) across the Nafion membrane, the ionic concentration difference (ΔC) across the membrane will be the same regardless of the thickness as shown in Fig. 3(a).
Since the volume of the Nafion linearly scales with the ionic concentration according to Vegard's law,32 we assume that the length of the Nafion linearly scales with ΔC. In our studies, since we applied the same voltage across the Nafion membrane, the difference (Δl) between the expanded part due to the addition of ions and the contracted part due to the reduction of ions should be the same regardless of thickness, as shown in Fig. 3(a). Furthermore, because the membrane should keep its components consistent without an abrupt change in dimension, it should bend as shown in Fig. 3(a).
Fig. 3(b) shows the shape of the IPMC actuators bent by the movement of ions. The displacement (δ) induced by the difference in volume expansion and contraction is derived as follows.
 | (7) |
 | (8) |
 | (9) |
As mentioned above, we assume that there is no change in the length of the middle side, i.e.  So,
So,
 | (10) |
 | (11) |
According to the aforementioned from eqn (2) to (6), we can verify that Δl will be constant regardless of the thickness when the same voltage is applied. Based on these conclusions, we also calculated the displacement of the IPMC actuator as a function of thickness from eqn (7) to (11). The conclusions of the two derived equations eqn (6) and (11) show that the displacement (δ) is inversely proportional to the thickness of the Nafion membrane (t) because l0 and Δl should be constant regardless of the thickness when the same voltage is applied. We fit the theoretical results based on our experimental data, as shown in Fig. 4.
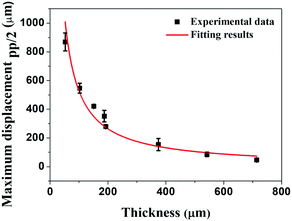 | ||
| Fig. 4 The dotted data show that the maximum displacement of the IPMC actuators, and the solid red line is a fitting line using eqn (11). | ||
In order to understand the trend observed in Fig. 2, we conducted an experiment to measure the elastic modulus both at macroscale and micro/nanoscale. We measured the force–distance curves using atomic force microscopy (AFM), collected the indentation curves over an 80 μm × 80 μm area of Nafion membrane and mapped the elastic modulus as shown in ESI Fig. S5† by Hertzian model fitting of the force-indentation depth curve at each point. We indented with a loading force of about 8.11 μN at all points and fitted the loading curve using eqn (12).33
 | (12) |
 | (13) |
In Fig. 5, we plotted the elastic modulus of Nafion membranes composed of both NR212 and N117 as measured by tensile test (red lines) and AFM indentation (blue lines). From the results of the tensile tests, the overall trend was that the elastic modulus decreased as the thickness increased except for the single sheet of NR212 Nafion membrane.
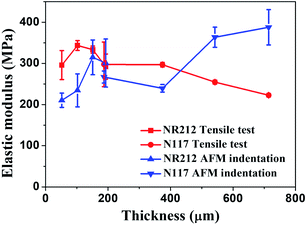 | ||
| Fig. 5 The elastic modulus of Nafion membranes NR212 and N117, measured by tensile test (red lines) and AFM indentation (blue lines). | ||
This trend is opposite to the one obtained using AFM indentation, whose results indicated that the elastic modulus increased as the thickness increased. AFM indentation is surface sensitive, so the elastic modulus obtained by AFM reflects the characteristics of the thin surface layer. However, the tensile test measures the whole structure, so the larger volume inside the Nafion layer will contribute more to the elastic modulus. Given this, if the trends in the elastic modulus of the surface layer is different than the modulus of the inner part, we can expect to see an opposing trend in elastic modulus, as depicted in Fig. 5.
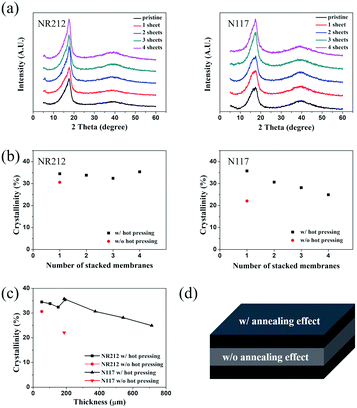
In order to see if this was really the case, we characterized the crystallinity of the Nafion layer using X-ray diffractometer. Fig. 6(a–c) shows the XRD patterns for each Nafion membrane. We calculated the crystallinity of each membrane by deconvoluting the amorphous and crystalline peaks.37,38 In this calculation, we assumed that the crystalline region of the Nafion, the carbon backbone (PTFE), was perfectly crystalline and that the sulfonic acid groups represented disordered regions.
The hot-pressed Nafion membranes (black dots) had increased crystallinity compared to the one prepared without hot pressing (red dot) for both NR212 and N117. Our data attests to the fact that hot pressing has a significant impact on the crystallization of the Nafion membrane we studied. In addition, the overall crystallinity decreased as the thickness of the Nafion membrane increased, which could potentially explain the decrease in elastic modulus measured by the tensile test. However, it is expected that the crystallinity of the surface layer would increase compared with the as-fabricated membrane, and that the thickness of the surface layer would also increase as the thickness of the Nafion membrane increased. This may explain the increasing trend in elastic modulus measured by the AFM indentation test.
It should be noted, though, that the hot-pressing conditions may have to be varied to yield the same results, depending on the membrane. Fig. 6(c) shows the crystallinity of the Nafion membrane after hot-pressing as a function of thickness. The overall trend is that the crystallinity decreases as the thickness increases. We developed a hypothesis to explain this trend, as illustrated in Fig. 6(d).
Fig. 6(d) shows the surface and internal states of the Nafion membrane after the hot-pressing. We hypothesize that during the hot-pressing, an annealing effect occurs from the surface to the inside of the Nafion membrane, leading to a sandwich structure. In order to produce a uniformly annealed layer, one has to increase the pressure and temperature of the hot-pressing. This is difficult, considering the fact that the conditions of annealing time and temperature to achieve full annealing are different for each thickness. Therefore, we suggest that one should use an oven to apply uniform heat, which will result in a Nafion membrane with uniform crystallinity.
4. Conclusions
In summary, we fabricated Nafion membranes with different thickness using the hot pressing method, and studied the dependence of elastic modulus on thickness and its relationship with crystallinity. Under the same hot-pressing process conditions (150 °C, 30 MPa, 30 min), the crystallinity of the Nafion membrane increased compared to that of the Nafion membrane without hot-pressing treatment. However, the degree of crystallinity decreased as the thickness increased (as the number of stacked films increased) and approached the value of the Nafion membrane without hot-pressing treatment.Furthermore, we found that the macroscopic elastic moduli of the Nafion membranes with different thickness, as well as the Nafion membranes without hot-pressing, were strongly coupled to their degrees of crystallinity. Finally, we hypothesized that the change in crystallinity of the Nafion membranes during hot-pressing occurred from the surface inward, based on the elastic modulus mapping using atomic force microscopy (AFM). Our results can provide insight into the complex mechanical properties of Nafion membranes.
Conflicts of interest
There are no conflicts to declare.Acknowledgements
This work was supported by the KUSTAR-KAIST Institute, KAIST, Korea, the Korea Research Fellowship Program funded by the National Research Foundation of Korea (No. 2017H1D3A1A01054478), the KAIST GCORE (Global Center for Open Research with Enterprise) grant funded by the Ministry of Science and ICT (Project #N11190026), Basic Science Research Programs (No. 2018R1A2B6002194) through the NRF, Korea funded by the Ministry of Science and ICT, and Big Sciences Research Program (No. 2017M1A2A2044498) through the NRF, Korea funded by the Ministry of Science and ICT.Notes and references
- M. Shahinpoor and K. J. Kim, Smart Mater. Struct., 2001, 10, 819–833 CrossRef CAS.
- D. Pugal, K. Jung, A. Aabloo and K. J. Kim, Polym. Int., 2009, 59, 279–289 CrossRef.
- Q. He, M. Yu, L. Song, H. Ding, X. Zhang and Z. Dai, J. Bionic Eng., 2011, 8, 77–85 CrossRef.
- R. Tiwari and E. Garcia, Smart Mater. Struct., 2011, 20, 083001 CrossRef.
- B. Bhandari, G.-Y. Lee and S.-H. Ahn, Int. J. Precis. Eng. Man., 2012, 13, 141–163 CrossRef.
- J. Wang, C. Xu and M. Taya, J. Mater. Res., 2006, 21, 2018–2022 CrossRef CAS.
- J. Wang, H. Sato, C. Xu and M. Taya, J. Appl. Phys., 2009, 105, 083515 CrossRef.
- J. Wang, C. Xu, M. Taya and Y. Kuga, Smart Mater. Struct., 2007, 16, S214–S219 CrossRef CAS.
- S. Mohsen and J. K. Kwang, Smart Mater. Struct., 2001, 10, 819 CrossRef.
- D. Pugal, K. Jung, A. Aabloo and K. J. Kim, Polym. Int., 2010, 59, 279–289 CrossRef CAS.
- J. Wang, C. Xu, M. Taya and Y. Kuga, J. Mater. Res., 2006, 21, 2018–2022 CrossRef CAS.
- L. Naji, M. Safari and S. Moaven, Carbon, 2016, 100, 243–257 CrossRef CAS.
- L. Zu, Y. Li, H. Lian, Y. Hu, W. Chang, B. Liu, Y. Liu, X. Ao, Q. Li and X. Cui, Macromol. Mater. Eng., 2016, 301, 1076–1083 CrossRef CAS.
- J. Ru, Y. Wang, L. Chang, H. Chen and D. Li, Smart Mater. Struct., 2016, 25, 095006 CrossRef.
- L. N. Hao, Y. Chen and Y. S. Zhao, Mater. Res. Innovations, 2015, 19(suppl. 1), S1-477–S1-481 CrossRef.
- K. Bian, H. Liu, G. Tai, K. Zhu and K. Xiong, J. Phys. Chem. C, 2016, 120, 12377–12384 CrossRef CAS.
- Inamuddin, A. Khan, M. Luqman and A. Dutta, Sens. Actuators, A, 2014, 216, 295–300 CrossRef CAS.
- K. Tien Nguyen, S. Young Ko, J.-O. Park and S. Park, J. Mech. Robot., 2016, 8, 041006 CrossRef.
- Y. Tang, Z. Xue, X. Zhou, X. Xie and C.-Y. Tang, Sens. Actuators, B, 2014, 202, 1164–1174 CrossRef CAS.
- S. Kim, S. Hong, Y.-Y. Choi, H. Song and K. No, Electrochim. Acta, 2013, 108, 547–553 CrossRef CAS.
- K. Surana, P. K. Singh, B. Bhattacharya, C. S. Verma and R. M. Mehra, Ceram. Int., 2015, 41, 5093–5099 CrossRef CAS.
- Q. He, L. Song, M. Yu and Z. Dai, Smart Mater. Struct., 2015, 24, 075001 CrossRef.
- Y. Wang, H. Chen, Y. Wang, Z. Zhu and D. Li, Electrochim. Acta, 2014, 129, 450–458 CrossRef CAS.
- V. Palmre, S. J. Kim, D. Pugal and K. Kim, Int. J. Smart Nano Mater., 2014, 5, 99–113 CrossRef CAS.
- A. Aabloo, V. De Luca, G. Di Pasquale, S. Graziani, C. Gugliuzzo, U. Johanson, C. Marino, A. Pollicino and R. Puglisi, Sens. Actuators, A, 2016, 249, 32–44 CrossRef CAS.
- H.-Y. Jung and J. W. Kim, Int. J. Hydrogen Energy, 2012, 37, 12580–12585 CrossRef CAS.
- H.-Y. Jung, K.-Y. Cho, Y. M. Lee, J.-K. Park, J.-H. Choi and Y.-E. Sung, J. Power Sources, 2007, 163, 952–956 CrossRef CAS.
- S. H. de Almeida and Y. Kawano, J. Therm. Anal. Calorim., 1999, 58, 569–577 CrossRef CAS.
- S. J. Lee, M. J. Han, S. J. Kim, J. Y. Jho, H. Y. Lee and Y. H. Kim, Smart Mater. Struct., 2006, 15, 1217–1224 CrossRef.
- G.-C. Cha, J.-S. Song, S.-M. Lee and M.-S. Mun, Polymer, 2006, 30, 471–477 CAS.
- S.-G. Lee, H.-C. Park, S. D. Pandita and Y. Yoo, Int. J. Control Autom. Syst., 2006, 4, 748–755 Search PubMed.
- L. Vegard, Z. Phys., 1921, 5, 17–26 CrossRef CAS.
- M. R. VanLandingham, J. S. Villarrubia, W. F. Guthrie and G. F. Meyers, Macromol. Symp., 2001, 167, 15–44 CrossRef CAS.
- Q. S. Li, G. Y. H. Lee, C. N. Ong and C. T. Lim, Biochem. Biophys. Res. Commun., 2008, 374, 609–613 CrossRef CAS PubMed.
- Y.-R. Chang, V. K. Raghunathan, S. P. Garland, J. T. Morgan, P. Russell and C. J. Murphy, J. Mech. Behav. Biomed. Mater., 2014, 37, 209–218 CrossRef CAS PubMed.
- A. Fabre, S. Salameh, L. C. Ciacchi, M. T. Kreutzer and J. R. van Ommen, J. Nanopart. Res., 2016, 18, 200 CrossRef PubMed.
- H. Kim, S. Lee, S. Kim, C. Oh, J. Ryu, J. Kim, E. Park, S. Hong and K. No, J. Mater. Sci., 2016, 52, 2400–2412 CrossRef.
- X. Cheng, C. Peng, M. You, L. Liu, Y. Zhang and Q. Fan, Electrochim. Acta, 2006, 51, 4620–4625 CrossRef CAS.
Footnote |
| † Electronic supplementary information (ESI) available. See DOI: 10.1039/c9ra01751h |
| This journal is © The Royal Society of Chemistry 2019 |

