DOI:
10.1039/C9RA02307K
(Paper)
RSC Adv., 2019,
9, 14609-14620
Photocatalytic improvement of Y3+ modified TiO2 prepared by a ball milling method and application in shrimp wastewater treatment
Received
26th March 2019
, Accepted 29th April 2019
First published on 10th May 2019
Abstract
Semiconductor photocatalysis is an advanced oxidation process driven by solar energy which has widespread applications in the treatment of organic pollutants in liquid and gas phases. In this work, titanium dioxide nanoparticles modified with yttrium ions (Y3+) were prepared by a ball milling method. The effects of Y3+ mole fraction, ball-to-powder weight ratio, milling time and milling rate on the photocatalytic activities were evaluated by the degradation of methylene blue (MB) under UV light. Then Y3+/TiO2 photocatalysts prepared at the optimized ball milling conditions were applied to treat shrimp wastewater under UV and visible light. Chemical oxygen demand (CODCr), 3D fluorescence spectroscopy and total organic carbon (TOC) were used to detect the water samples taken from the photocatalytic experiments. Experimental results showed that when the mole fraction was 2%, the ball-to-powder weight ratio was 4![[thin space (1/6-em)]](https://www.rsc.org/images/entities/char_2009.gif) :
:![[thin space (1/6-em)]](https://www.rsc.org/images/entities/char_2009.gif) 1, milling time was 4 h and milling rate was 500 rpm, the reaction rate constant of MB degradation can reach up to 0.1112 min−1 which was 4.2 times as fast as pure TiO2. All Y3+/TiO2 samples showed a red shift of absorption compared to pure TiO2 and it led to a visible light absorption response. The content of surface oxygen vacancies has significantly increased and the BET specific area increased to 104 m2 g−1. The CODCr removal rates of shrimp wastewater were 43.8% and 37.5% for 2% Y3+/TiO2 under UV and visible light, respectively. Besides, the TOC removal rates were 67.5% and 38.8%, respectively. Humic-like substances and fulvic-like substances in shrimp wastewater can be mineralized after 90 minutes irradiation.
1, milling time was 4 h and milling rate was 500 rpm, the reaction rate constant of MB degradation can reach up to 0.1112 min−1 which was 4.2 times as fast as pure TiO2. All Y3+/TiO2 samples showed a red shift of absorption compared to pure TiO2 and it led to a visible light absorption response. The content of surface oxygen vacancies has significantly increased and the BET specific area increased to 104 m2 g−1. The CODCr removal rates of shrimp wastewater were 43.8% and 37.5% for 2% Y3+/TiO2 under UV and visible light, respectively. Besides, the TOC removal rates were 67.5% and 38.8%, respectively. Humic-like substances and fulvic-like substances in shrimp wastewater can be mineralized after 90 minutes irradiation.
1. Introduction
In recent years, with the rapid development of marine aquaculture, the increasing amount of discharge wastewater from coastal farms has led to an ecosystem imbalance in offshore areas and the environment of the coastal water has been severely damaged.1 Compared with industrial wastewater and domestic sewage, marine aquaculture wastewater may include dissolved metabolic waste, drug residues, antimicrobial agents, nutrients, solid waste, etc.2 Therefore, when it is discharged in large quantities, it can result in offshore water pollution and eutrophication. Generally, many conventional physical, chemical and biological methods can be applied to aquaculture wastewater treatment.3 Physical technologies such as precipitation, filtration, adsorption, and so on, have been widely used due to their low equipment and operating costs.4 The major suspended solids and partial chemical oxygen demand (COD) can be removed using these techniques. However, the poor removal of dissolved organic matter, total nitrogen (TN) and total phosphorus (TP) has restricted the application of physical methods.5 In addition, the traditional biological methods have mainly utilized mixed strains derived from natural or artificial environments. Nevertheless, the scarce nitrifying bacteria and salt effect in seawater can bring about low effective microorganism proportion and low processing load per volume.6 Nowadays, chemical methods are regarded as some of the most promising technologies because the organic matter and pathogens in wastewater can be quickly and efficiently removed and eliminated.7
Much attention has been paid to semiconductor photocatalysis for the ability to degrade organic contaminants in water or air.8 Recently, Bi-based photocatalysts such as BiPO4 and BiOCl with different facets have been designed and investigated in NOx removal and toluene oxidation, respectively.9,10 More interestingly, the new mechanisms have been discussed in detail by experimental results and theoretical calculation. In addition, other photocatalysts such as g-C3N4,11 Fe3O4,12 MnO13 and Cu2O14 with excellent photocatalytic activities have also been prepared and used in environmental treatment. Photocatalytic technology has shown better COD removal and sterilization performance in water treatment compared to other techniques.15 TiO2 has become one of the most commonly used photocatalysts due to its high efficiency, chemical stability and low cost.16 However, there are two major drawbacks which the band gap of TiO2 is relatively wide and visible light can't be absorbed.17 In order to improve its photocatalytic activity and practical applications, many efforts have been made, such as element doping, semiconductor coupling and noble metal deposition.18 Lots of researches suggest that the TiO2 photocatalysts doping with nonmetal or metal exhibit visible light response and excellent photocatalytic activity.19 A growing number of experimental and theoretical researches have been concentrated on rare earth metal doped TiO2 photocatalysts recently. Due to the unique electronic structure of rare earth metals, it is beneficial for improving the photocatalytic activity of TiO2 by introducing 4f electron orbital acted as electron traps.20
Ball milling method makes use of the violent collision, extrusion, and friction among the grinding medium and powder so that the mechanical energy can be transferred to the powders.21 The plastic deformation of the powders has taken place during the circular crushing-compression process.22 The following mechanochemical process may be the result of one or several of these effects. Firstly, the instantaneous high temperature and collision force can be generated at local collision sites between materials and grinding medium that may result in crystal defects diffusion and partial atomic rearrangement and cause nanoscale thermochemical reaction.23 Secondly, the release of local stress is often accompanied with the generation of structural defects and the transformation of thermal energy.24 Besides, the powders can be destroyed by severe collision, leading to structural cracking and lattice distortion. As a result, a new surface with high activity is produced. The composite materials, alloys, and other materials which are difficult to obtain by conventional methods usually can be synthesized by ball milling method.25 Therefore, it has been extensively applied to industrial production due to its simple process, low cost and high efficiency. In this research, a series of Y3+ modified TiO2 nanoparticles with different mole fraction of Y3+ have been successfully synthesized by ball milling method. The ball milling conditions were optimized by the degradation of MB under UV light. The highest photocatalytic activity of Y3+ modified TiO2 sample was used to shrimp wastewater treatment.
2. Experimental section
2.1 Chemicals
Titanium dioxide (99.5%, anatase) was purchased from TANSAIL, Nanjing. Yttrium oxide (Y2O3, 99.5%) was purchased from Hunan Rare Earth Metal Material Research Institution. Hydrochloric acid (HCl, 36.0–38.0%), sulfuric acid (H2SO4, 95.0–98.0%), potassium dichromate (K2Cr2O7, 99.8%), silver(I) nitrate (AgNO3, 99.8%) and mercury(II) sulfate (HgSO4, 98.5%) were purchased from Shanghai Fusheng Industry Co., Ltd.
2.2 Preparation of Y3+ modified TiO2 photocatalysts
The Y3+/TiO2 photocatalysts was synthesized by ball milling from TiO2, Y3+ solution and grinding balls with QM-3SP04 planetary mill (made in Nanjing, China). The experimental steps were as shown in Fig. 1: firstly, different amounts of Y2O3 were dissolved by HCl to obtain Y3+, and then the above Y3+ solutions were added with TiO2 powders and agate balls in the grinding jars. The mole fractions (nY3+/nTi) were ranged from 0.5% to 3%. The ball-to-powder weight ratios were ranged from 1![[thin space (1/6-em)]](https://www.rsc.org/images/entities/char_2009.gif) :
:![[thin space (1/6-em)]](https://www.rsc.org/images/entities/char_2009.gif) 1 to 10
1 to 10![[thin space (1/6-em)]](https://www.rsc.org/images/entities/char_2009.gif) :
:![[thin space (1/6-em)]](https://www.rsc.org/images/entities/char_2009.gif) 1. Next, the mixtures were ball-milled for different hours at room temperature. The milling times were changed from 1 to 10 hours and the ball milling rates were set from 300 rpm to 550 rpm. After this process, the mixtures were washed and dried at 90 °C for 4 hours and grinded into powders with a mortar. Pure TiO2 without adding any Y3+ was prepared under the optimized ball milling conditions.
1. Next, the mixtures were ball-milled for different hours at room temperature. The milling times were changed from 1 to 10 hours and the ball milling rates were set from 300 rpm to 550 rpm. After this process, the mixtures were washed and dried at 90 °C for 4 hours and grinded into powders with a mortar. Pure TiO2 without adding any Y3+ was prepared under the optimized ball milling conditions.
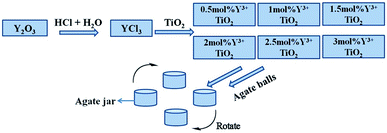 |
| | Fig. 1 Schematic diagram of preparation of Y3+/TiO2 and pure TiO2 photocatalysts. | |
2.3 Characterization
UV-vis absorption spectra were detected by LAMBDA 750 spectrophotometer (PerkinElmer, America) in the range of 200 to 800 nm. The X-ray photoelectron spectroscopy (XPS) was measured to analyze surface elements and chemical compositions of the as-prepared samples using a PHI 5000 Versa probe II scanning spectrometer (ULVAC-PHI, Japan). X-ray diffraction (XRD) was measured with Ultima IV (Rigaku, Japan) X-ray diffractometer to obtain the crystal phase and lattice parameter of the photocatalysts. The diffraction angle was set up from 10° to 80° and the scanning speed was 5° min−1. The BET specific surface areas were measured by the N2 adsorption–desorption isotherms at 77.35 K with an Autosorb iQ sorption analyzer (Quantochrome, America). A JSM-7100F field-emission scanning electron microscopy (JEOL, Japan) was used to determine the morphology of the samples and the accelerating voltage was 5 kV. High-resolution transmission electron microscope (HRTEM) images were performed with a JEM-2100F field-emission transmission electron microscopy.
2.4 Photocatalytic experiments
As shown in Fig. 2, the photocatalytic activities of Y3+/TiO2 were determined by the degradation of 25 mg L−1 MB solutions under a 300 W medium pressure mercury lamp (λ = 365 nm). Accurately 0.1 g Y3+/TiO2 powders were added into 500 mL MB solutions for each reaction. Before the illumination, the mixtures were stirred in dark for 30 minutes to reach adsorption–desorption equilibrium. A cold trap was used to provide recirculating cooling water to control lamp temperature and an air pump was installed to provide continuous air into reaction vessel, respectively. Then, 5 mL reaction solution was taken out at certain time and centrifuged to remove the Y3+/TiO2 powders. The absorbance of MB was measured at 664 nm using a UV 2700 (Shimadzu, Japan) spectrophotometer. The effects of ball milling conditions on the photocatalytic activity of Y3+/TiO2 were determined by the reaction rate constant of MB degradation.
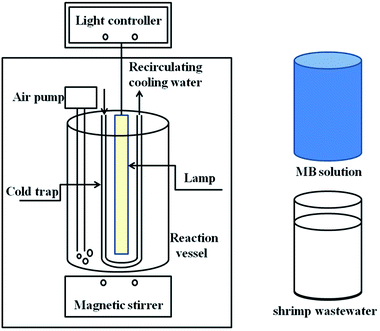 |
| | Fig. 2 Schematic diagram of photocatalytic degradation of MB solution and shrimp wastewater. | |
According to the above experiments, the highest photocatalytic efficiency of Y3+/TiO2 sample under the optimized ball milling condition was used to shrimp wastewater treatment. The wastewater was taken from the high level ponds in the offshore area of Haikou City (China) during July 2018. Similarly, 1.5 g Y3+/TiO2 powders and 750 mL shrimp wastewater were added into a 1 L reaction vessel. After magnetic stirred, the recirculating cooling water and air pump were turned on. A 300 W medium pressure mercury lamp and a 300 W Xe-lamp were used as light source to provide UV and visible light, respectively. The photocatalytic reaction time was 4 hours and 20 mL suspensions were taken out every 15 minutes. Then the centrifuged water samples were used to measure chemical oxygen demand (CODCr) with a DRB 200 thermostat (HACH America). Generally, the concentration of chloride ions in discharged wastewater is higher than 1000 mg L−1 because seawater is the water source of shrimp farming. Therefore, HgSO4 was added to the water sample before digestion to react with chloride ions and form complex. The typical steps were as follows. First of all, precisely 0.05 g HgSO4 and 4 mL COD digestion solution were added into each HACH chemistry vials. Then 2 mL centrifuged water samples were taken out and well mixed with the reagents in the vials. Vials were digested for 2 hours at 150 °C. After the vial was cooled down to room temperature, the CODCr value was measured by a DR/2800 (HACH, America) spectrophotometer.
3. Results and discussion
The UV-vis absorption spectra of Y3+ modified TiO2 and pure TiO2 samples were detected in the range of 200–800 nm which were shown in Fig. 3. A sharp absorption rise can be seen from 400 nm in each Y3+/TiO2 sample, which can be ascribed to the electron transfer in TiO2.26 The Y3+ modified TiO2 samples absorb the UV light much more than pure TiO2. In the range of 400–750 nm, Y3+ modification leads to visible light response. As a result, compared to pure TiO2, all Y3+/TiO2 samples exhibit a redshift of the absorption. Tauc plot method was employed to calculate the band gap of Y3+/TiO2. The equation was as mentioned below:
where A stands for proportional constant, h is Planck's constant, ν represents the frequency of vibration, Eg is band gap, n = 2 is appropriate for indirect allowed transition and α is the absorption coefficient.27 The band gap of Y3+ modified TiO2 and pure TiO2 samples were shown in Table 1. The band gap value of 2% Y3+ modified TiO2 was 3.04 eV which was less than pure TiO2. A new 3d electronic energy level appeared above the valence band and the electrons can be transferred from the O 2p states to the Y 3d states firstly. The distance between valence band and conduction band was reduced indirectly and the electron–hole recombination rate was delayed.28
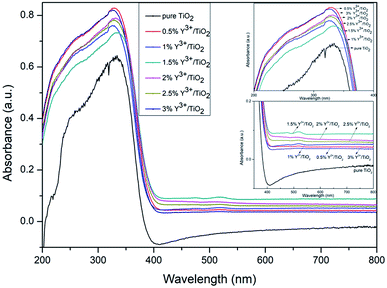 |
| | Fig. 3 UV-vis absorption spectra of Y3+/TiO2 and pure TiO2 photocatalysts. | |
Table 1 BET surface area and band gap of Y3+/TiO2, pure TiO2 and raw TiO2 photocatalysts
| Sample label |
nY3+/nTi |
SBET (m2 g−1) |
Band gap (eV) |
| Raw TiO2 |
None |
65 |
3.20 |
| Pure TiO2 |
None |
68 |
3.20 |
| Y3+/TiO2 |
0.5% |
77 |
3.11 |
| Y3+/TiO2 |
1.0% |
80 |
3.10 |
| Y3+/TiO2 |
1.5% |
86 |
3.07 |
| Y3+/TiO2 |
2.0% |
104 |
3.04 |
| Y3+/TiO2 |
2.5% |
81 |
3.09 |
| Y3+/TiO2 |
3.0% |
77 |
3.08 |
As shown in Fig. 4, XPS was used to detect the surface elements and chemical characters of pure TiO2 and 2% Y3+/TiO2 photocatalysts prepared under optimized ball milling conditions. The high resolution (HR) XPS spectra of Ti 2p and O 1s recorded the chemical composition of titanium and oxygen, respectively. The Ti 2p XPS spectrum of pure TiO2 (a) can be separated into two chemical states at the binding energy (BE) of 458.3 eV and 463.9 eV, which can be attributed to Ti 2p3/2 and Ti 2p1/2, respectively. The difference of 5.6 eV confirms the typical BE of Ti4+ in TiO2. The Ti 2p XPS spectrum of 2% Y3+/TiO2 (c) can be separated into four chemical states at BE of 458.4 eV (9.91%), 460.2 eV (56.75%), 463.9 eV (4.96%) and 465.8 eV (28.38%), respectively. The Ti 2p3/2 and Ti 2p1/2 peaks at the BE of 458.4 eV and 463.9 eV can be identified as Ti3+. Similarly, the Ti 2p3/2 and Ti 2p1/2 peaks at the BE of 460.2 eV and 465.8 eV can be assigned to Ti4+. This indicated that Y3+ ions existed either in the interstitial sites of TiO2 matrix or adsorbed on the surface of TiO2 during ball milling process.29 This small amount of Ti3+ (14.87%) was observed due to charge imbalance, lattice distortion and oxygen defects in TiO2.30 The O 1s XPS spectrum of pure TiO2 (b) can be separated into two peaks at BE of 529.4 eV and 531.6 eV, which can be related to lattice oxygen (OL) and chemisorbed oxygen (OH).31 The amounts of OL and OH in pure TiO2 were 56% and 44%, respectively. The O 1s XPS spectrum of 2% Y3+/TiO2 (d) can be separated into three peaks at BE of 529.4 eV (6.62%), 531.6 eV (61.88%) and 533.5 eV (31.50%), which can be related to lattice oxygen (TiOx), bridging hydroxyl oxygen (Ti–OH–Ti) and terminal hydroxyl oxygen (Ti–OH), respectively. It is known that the interactions among surface hydroxyl groups and organic pollutants had a significant influence on the photocatalytic activity of TiO2. The results were in line with Jiang's research.32 Compared to pure TiO2, an increase content of surface oxygen vacancy and a decrease content of lattice oxygen in 2% Y3+/TiO2 photocatalysts were the reasons of higher photocatalytic activity.
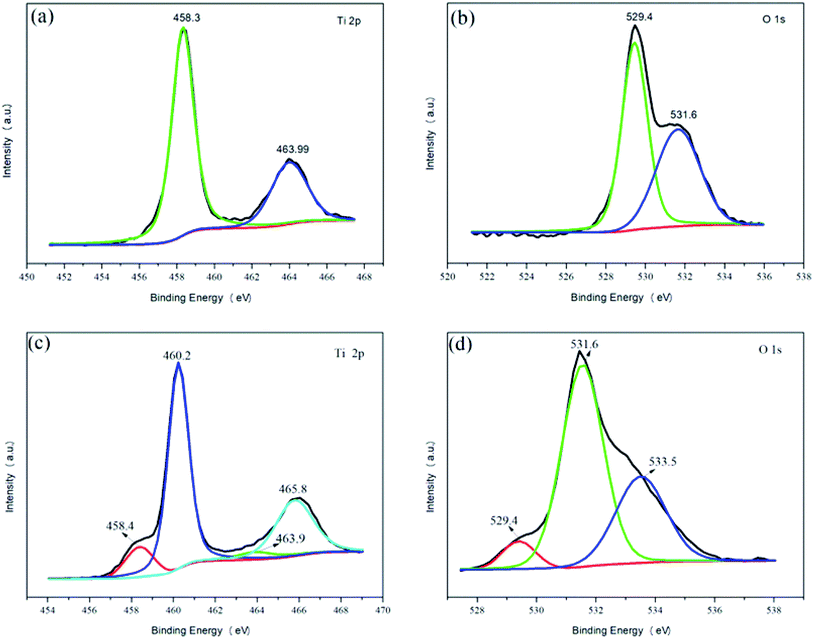 |
| | Fig. 4 XPS spectra of pure TiO2 (a and b) and 2% Y3+/TiO2 (c and d). | |
The crystal phase composition, atomic and molecular structure and lattice parameter were determined by XRD. The XRD patterns of pure TiO2 and Y3+/TiO2 photocatalysts prepared under optimized ball milling conditions were shown in Fig. 5. Each of the patterns turned out that the single anatase phase TiO2 was formed. The diffraction peaks at 2θ values of 25.4°, 37.0°, 37.8°, 38.6°, 48.1°, 53.9°, 55.1° and 62.1° can be related to (101), (103), (004), (112), (200), (105), (211) and (213) planes in JCPDS no. 21-1272 standard card. The 2θ value of (101) plane in pure TiO2 was 25.4°. By contrast, the 2θ values of (101) plane in Y3+/TiO2 were 25.44°, 25.48°, 25.52°, 25.54°, 25.54° and 25.56°, respectively. With the Y3+ content increases, the position of (101) plane moved toward a large angle. According to Bragg's law, the interplanar spacing became smaller. The shift of the diffraction peak can be associated with lattice parameter changes. The factors that affect the lattice parameters were the lattice distortion caused by solute elements in interstitial sites and the dislocation caused by mutual replacements of elements.33 Furthermore, the characteristic peaks of Y2O3 were not found in each of Y3+/TiO2 samples. Y3+ ions existed in interstitial sites of TiO2 lattice or a highly dispersed amorphous phase adsorbed on the TiO2 surface. This result was in accordance with literature reports.34 Compared with pure TiO2, the diffraction peak intensity decreased and full width at half maximum (FWHM) increased slight in all Y3+/TiO2 samples. The crystallinity of Y3+/TiO2 decreased and Y3+ modification could induce lattice distortion. This distortion can cause lattice defects and an increase of surface oxygen vacancies which are beneficial for the migration of photo-generated carriers.35 Therefore, the photocatalytic activity of TiO2 can be improved and this result was in agreement with XPS result.
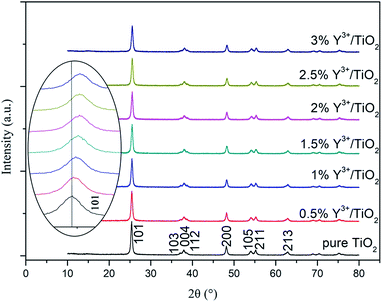 |
| | Fig. 5 X-ray diffraction patterns of Y3+/TiO2 and pure TiO2 samples. | |
As shown in Table 1, the BET surface areas of Y3+/TiO2 and pure TiO2 photocatalysts prepared under optimized ball milling conditions were similar. The specific surface area of all Y3+/TiO2 samples was in the range of 77–104 m2 g−1 and higher than that of pure TiO2 sample (68 m2 g−1). In Fig. 6, the N2 adsorption/desorption isotherms of raw TiO2, pure TiO2 and 2%Y3+/TiO2 samples are type IV isotherms with a distinct hysteresis loop occurring at relative pressure ranges of 0.7–0.95 P/P0. Compared with pure TiO2, rare earth metal ions (Y3+) modification is beneficial to increase the specific surface area of TiO2. In the range of 0.5% to 2%, the specific surface area of TiO2 can be increased with the increase of Y3+ mole fraction. The highest BET surface area was obtained for 2% Y3+/TiO2 sample which can reach to 104 m2 g−1. The Y3+ radius (0.0893 nm) is larger than the Ti4+ radius (0.068 nm), so Y3+ could hardly enter TiO2 lattice to replace Ti4+ but exist in interstitial sites of TiO2 or adsorbed on the TiO2 surface.36 Moreover, lattice distortion and charge imbalance can be induced. As a result, more surface oxygen defects are generated and particle dispersion can be improved. It indicated that Y3+ modification could decrease the agglomeration and the specific surface area can be improved. These results are coincidence with the results from XPS, XRD and SEM. Higher specific surface area can improve the adsorption capacity of TiO2 nanoparticles and migration of the interface charges.37 Better adsorption of organic pollutant determined higher photocatalytic activity.
 |
| | Fig. 6 Nitrogen adsorption and desorption isotherms of raw TiO2, pure TiO2 and 2% Y3+/TiO2. | |
As it can be seen from Fig. 7, the HRTEM images of pure TiO2 (a and b) and 2% Y3+/TiO2 (c and d) samples present obvious agglomeration and the particle sizes are about 20 nm which is in good agreement with the XRD results. The calculated distances between lattice planes of pure TiO2 and 2% Y3+/TiO2 are 0.351 nm and 0.354 nm, respectively. The results coincide with the crystal plane spacing of anatase TiO2 (101) plane. The morphologies of pure TiO2 (a) and 2% Y3+ modified TiO2 (b) prepared under optimized ball milling conditions were observed by scanning electron microscopy which was shown in Fig. 8. The raw TiO2 nanoparticles were ball milled to get pure TiO2 photocatalysts which were arranged closely and the agglomeration phenomenon was serious. Compared with pure TiO2, adding Y3+ during the ball milling process can hinder the agglomeration and make TiO2 particles more dispersible.38 The 2% Y3+ modified TiO2 sample possessed more uniform particle distribution and best dispersion. The highest BET surface area was in good consistent with this result. The instantaneous energy produced by violent collision that made Y3+ interacted on the surface of TiO2.39 As a result, charge imbalance can be induced and more surface oxygen vacancies were generated, which was in accord with XPS result.
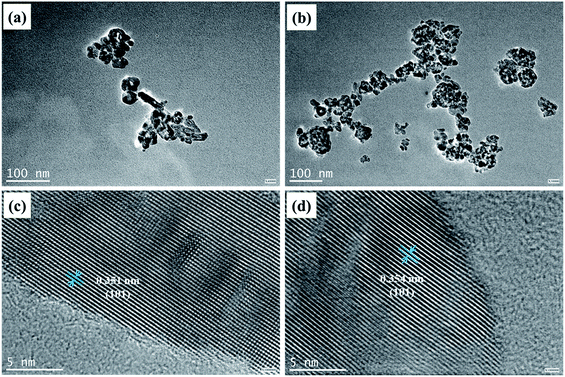 |
| | Fig. 7 The HRTEM images of pure TiO2 (a and b) and Y3+/TiO2 (c and d). | |
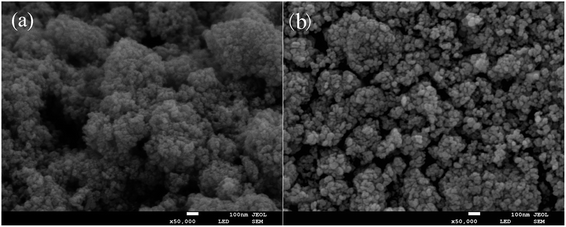 |
| | Fig. 8 SEM images of pure TiO2 (a) and 2% Y3+/TiO2 (b) samples prepared under optimized ball milling conditions. | |
In order to study the effect of Y3+ mole fraction and ball milling conditions on the photocatalytic activity of TiO2, a comprehensive experiment was carried out. The results were shown in Fig. 9. The Y3+ content was from 0.5% to 3%, the ball-to-powder weight ratio was from 1![[thin space (1/6-em)]](https://www.rsc.org/images/entities/char_2009.gif) :
:![[thin space (1/6-em)]](https://www.rsc.org/images/entities/char_2009.gif) 1 to 10
1 to 10![[thin space (1/6-em)]](https://www.rsc.org/images/entities/char_2009.gif) :
:![[thin space (1/6-em)]](https://www.rsc.org/images/entities/char_2009.gif) 1, the milling time was from 1 to 10 hours and the milling rate was from 300 to 550 rpm, respectively. There was a significant trend of linear correlation between ln(Ct/C0) and reaction time t, which was consistent with first-order reaction kinetic model.40 The apparent first-order reaction rate constants of the degradation of MB solution were calculated as followed:
1, the milling time was from 1 to 10 hours and the milling rate was from 300 to 550 rpm, respectively. There was a significant trend of linear correlation between ln(Ct/C0) and reaction time t, which was consistent with first-order reaction kinetic model.40 The apparent first-order reaction rate constants of the degradation of MB solution were calculated as followed:
where
C0 is the concentration of MB at the beginning of the reaction and
Ct is the concentration of MB at reaction time
t, and
k stands for the first-order kinetic reaction constant, respectively.
41 The kinetic equations and reaction rate constants for different mole fractions, ball-to-powder weight ratios, milling times and milling rates were shown in
Tables 2–5, respectively.
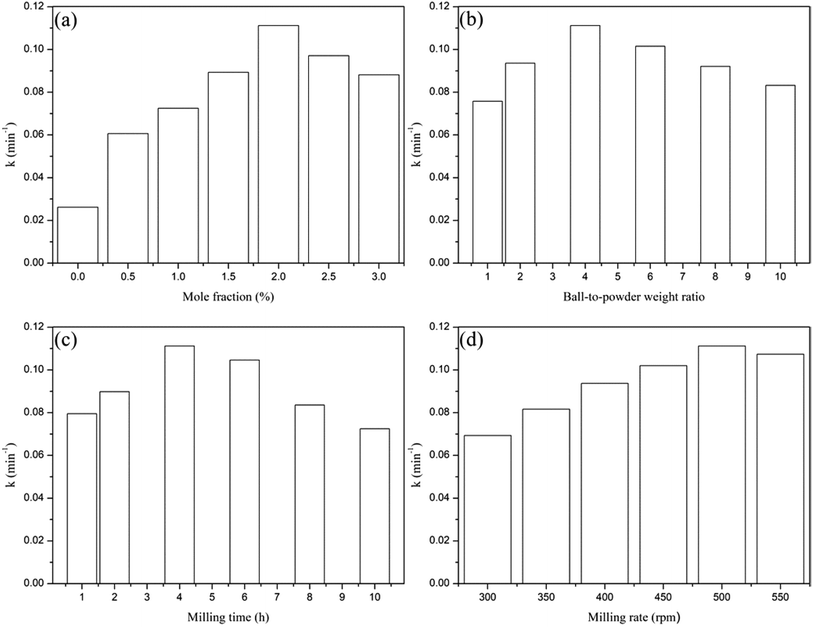 |
| | Fig. 9 Effects of mole fraction (a), ball-to-powder weight ratio (b), milling time (c) and milling rate (d) on photocatalytic activities of Y3+/TiO2 photocatalysts. | |
Table 2 Kinetic equation and reaction rate constants (k) for different mole fraction of Y3+/TiO2
| Mole fraction (nY3+/nTi) |
Kinetic equation |
Reaction rate constant k (min−1) |
R2 |
| 0 |
Ct = C0e−0.0262t |
0.0262 |
0.991 |
| 0.5% |
Ct = C0e−0.0606t |
0.0606 |
0.986 |
| 1.0% |
Ct = C0e−0.0725t |
0.0725 |
0.988 |
| 1.5% |
Ct = C0e−0.0893t |
0.0893 |
0.990 |
| 2.0% |
Ct = C0e−0.1112t |
0.1112 |
0.993 |
| 2.5% |
Ct = C0e−0.0971t |
0.0971 |
0.982 |
| 3.0% |
Ct = C0e−0.0881t |
0.0881 |
0.989 |
Table 3 Kinetic equation and reaction rate constants (k) for different b-t-p weight ratio of Y3+/TiO2
| Ball-to-powder weight ratio |
Kinetic equation |
Reaction rate constant k (min−1) |
R2 |
1![[thin space (1/6-em)]](https://www.rsc.org/images/entities/char_2009.gif) : :![[thin space (1/6-em)]](https://www.rsc.org/images/entities/char_2009.gif) 1 1 |
Ct = C0e−0.0758t |
0.0758 |
0.980 |
2![[thin space (1/6-em)]](https://www.rsc.org/images/entities/char_2009.gif) : :![[thin space (1/6-em)]](https://www.rsc.org/images/entities/char_2009.gif) 1 1 |
Ct = C0e−0.0936t |
0.0936 |
0.985 |
4![[thin space (1/6-em)]](https://www.rsc.org/images/entities/char_2009.gif) : :![[thin space (1/6-em)]](https://www.rsc.org/images/entities/char_2009.gif) 1 1 |
Ct = C0e−0.1112t |
0.1112 |
0.993 |
6![[thin space (1/6-em)]](https://www.rsc.org/images/entities/char_2009.gif) : :![[thin space (1/6-em)]](https://www.rsc.org/images/entities/char_2009.gif) 1 1 |
Ct = C0e−0.1015t |
0.1015 |
0.988 |
8![[thin space (1/6-em)]](https://www.rsc.org/images/entities/char_2009.gif) : :![[thin space (1/6-em)]](https://www.rsc.org/images/entities/char_2009.gif) 1 1 |
Ct = C0e−0.0921t |
0.0921 |
0.983 |
10![[thin space (1/6-em)]](https://www.rsc.org/images/entities/char_2009.gif) : :![[thin space (1/6-em)]](https://www.rsc.org/images/entities/char_2009.gif) 1 1 |
Ct = C0e−0.0832t |
0.0832 |
0.996 |
Table 4 Kinetic equation and reaction rate constants (k) for different milling time of Y3+/TiO2
| Milling time (h) |
Kinetic equation |
Reaction rate constant k (min−1) |
R2 |
| 1 |
Ct = C0e−0.0795t |
0.0795 |
0.972 |
| 2 |
Ct = C0e−0.0898t |
0.0898 |
0.980 |
| 4 |
Ct = C0e−0.1112t |
0.1112 |
0.993 |
| 6 |
Ct = C0e−0.1046t |
0.1046 |
0.988 |
| 8 |
Ct = C0e−0.0836t |
0.0836 |
0.975 |
| 10 |
Ct = C0e−0.0725t |
0.0725 |
0.987 |
Table 5 Kinetic equation and reaction rate constants (k) for different milling rate of Y3+/TiO2
| Milling rate (rpm) |
Kinetic equation |
Reaction rate constant k (min−1) |
R2 |
| 300 |
Ct = C0e−0.0693t |
0.0693 |
0.974 |
| 350 |
Ct = C0e−0.0816t |
0.0816 |
0.986 |
| 400 |
Ct = C0e−0.0937t |
0.0937 |
0.980 |
| 450 |
Ct = C0e−0.1020t |
0.1020 |
0.982 |
| 500 |
Ct = C0e−0.1112t |
0.1112 |
0.993 |
| 550 |
Ct = C0e−0.1073t |
0.1073 |
0.989 |
It can be seen from Fig. 9(a) that in the range of 0.5–2%, k increased from 0.0606 min−1 to 0.1112 min−1 with the increase of Y3+/Ti mole fraction. Then k decreased to 0.0881 min−1 in the range of 2–3%. The best loading amount of Y3+ is 2% and the photocatalytic efficiency was 4.2 times that of pure TiO2. As shown in (b), when the ball-to-powder weight ratio was increased from 1![[thin space (1/6-em)]](https://www.rsc.org/images/entities/char_2009.gif) :
:![[thin space (1/6-em)]](https://www.rsc.org/images/entities/char_2009.gif) 1 to 4
1 to 4![[thin space (1/6-em)]](https://www.rsc.org/images/entities/char_2009.gif) :
:![[thin space (1/6-em)]](https://www.rsc.org/images/entities/char_2009.gif) 1, k increased from 0.0758 min−1 to 0.1112 min−1. An appropriate ball-to-powder weight ratio was good for the collision, shearing and grinding interactions among raw materials and grinding balls. If the ratio was too large, it caused great energy losses because parts of grinding balls are in the “idle” state. On the contrary, the buffer function was too large and interactions among grinding balls and powders were reduced.42 The optimized ball-to-powder weight ratio was 4
1, k increased from 0.0758 min−1 to 0.1112 min−1. An appropriate ball-to-powder weight ratio was good for the collision, shearing and grinding interactions among raw materials and grinding balls. If the ratio was too large, it caused great energy losses because parts of grinding balls are in the “idle” state. On the contrary, the buffer function was too large and interactions among grinding balls and powders were reduced.42 The optimized ball-to-powder weight ratio was 4![[thin space (1/6-em)]](https://www.rsc.org/images/entities/char_2009.gif) :
:![[thin space (1/6-em)]](https://www.rsc.org/images/entities/char_2009.gif) 1 in the experiment. The effect of milling time on photocatalytic activity of Y3+/TiO2 was shown in Fig. 9(c). The first-order reaction rate constant k increased steadily with the increase of milling time in the range of 1–4 hours. When the milling time was too long, the reaction rate constant k decreased to 0.0725 min−1. The surface active sites of TiO2 can be reduced to a certain degree for milling too long, so the best milling time was 4 hour. The relationship of milling rate and k was displayed in Fig. 9(d). In the range of 300 to 500 rpm, k increased from 0.0693 min−1 to 0.1112 min−1. When the milling rate was increased to 550 rpm, k decreased to 0.1073 min−1. Considering the service life time of planetary mill, the milling rate should not be set too fast. The optimum milling rate was 500 rpm.
1 in the experiment. The effect of milling time on photocatalytic activity of Y3+/TiO2 was shown in Fig. 9(c). The first-order reaction rate constant k increased steadily with the increase of milling time in the range of 1–4 hours. When the milling time was too long, the reaction rate constant k decreased to 0.0725 min−1. The surface active sites of TiO2 can be reduced to a certain degree for milling too long, so the best milling time was 4 hour. The relationship of milling rate and k was displayed in Fig. 9(d). In the range of 300 to 500 rpm, k increased from 0.0693 min−1 to 0.1112 min−1. When the milling rate was increased to 550 rpm, k decreased to 0.1073 min−1. Considering the service life time of planetary mill, the milling rate should not be set too fast. The optimum milling rate was 500 rpm.
The 2% Y3+/TiO2 photocatalysts showed excellent photocatalytic performance under the optimized ball milling conditions in the above experiments. Photocatalytic efficiencies of 2% Y3+/TiO2 and pure TiO2 for shrimp wastewater treatment under UV and visible light irradiation were also investigated. As shown in Fig. 10(a), photocatalytic performances of 2% Y3+/TiO2 and pure TiO2 were estimated by measuring the CODCr changes of shrimp wastewater in 240 minutes under a 300 W medium pressure mercury lamp. The CODCr value of shrimp wastewater was about 1340 mg L−1 at the beginning of the reaction. It can be seen that the values of CODCr has not been unchanged obviously on the whole under UV light irradiation without any photocatalysts. The CODCr removal rates measured in the presence of 2% Y3+/TiO2 and pure TiO2 photocatalysts are 43.8% and 32.7%, respectively. It can be noticed that CODCr values declined obviously in the first 15 minutes of the reaction. Because these organic compounds which can be easily oxidized in shrimp wastewater were photodegraded at an early stage. The CODCr values increased evidently from 45 to 75 minutes. As the reaction continued, the CODCr values decreased gradually after 150 minutes irradiation. The types of organic matters in shrimp wastewater are very complicated. There are numerous organic compounds that are difficult to be oxidized or degraded.43 Therefore, the easily degradable organic pollutions are continuously removed in the first period of the photocatalytic reaction. These complexed organic compounds can be destroyed by hydroxyl radicals and superoxide radicals and transformed into small substances.44 Then a large number of small substances can be oxidized and this leads to the rise of CODCr value. It can be seen in Fig. 10(b), the CODCr removal rates of Y3+/TiO2 and pure TiO2 under simulated visible light are 37.5% and 25.4%, respectively.
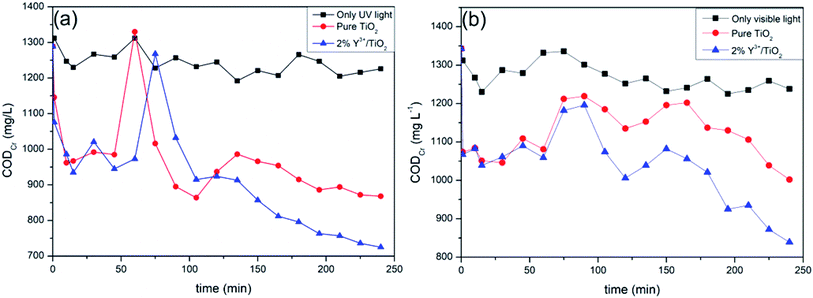 |
| | Fig. 10 CODCr changes under UV light (a) or visible light (b) in the presence of 2% Y3+/TiO2, pure TiO2 photocatalysts. | |
As it can be seen from Fig. 11, 3D fluorescence spectroscopy was used to analyze the shrimp wastewater samples during the photocatalytic experiment. According to the distribution of various substances in the 3D fluorescence spectra, three typical fluorescence peaks can be confirmed. Peak A at (Ex/Em) = 240/420 nm and peak B at (Ex/Em) = 310/420 nm can be related to microbial and terrestrial fulvic-like substances and humic-like substances which are in accordance with H. Liang's study.45 The fulvic-like substances and humic-like substances are these organic polymer compounds which are mainly derived from the microbial decomposition of animals and plants residue.46 In the shrimp wastewater, these organic pollutants are mainly caused by the residual baits and untreated metabolites and residues of shrimp and fish.47 As illustrated in Fig. 11(a), the fulvic-like substances and humic-like substances cover the relatively large proportions at the beginning of the photocatalytic reaction. As the reaction continues, the fluorescence intensities of peak A and B are significantly reduced and the two peaks disappear completely after 90 minutes irradiation. Photocatalytic treatment achieves a remarkable fluorescent intensity reduction of peak A and B. The molecular structure of fluorescent substances in shrimp wastewater can be effectively destroyed by hydroxyl radicals and superoxide radicals. These strong oxidative species in water can play a role in degrading complex organic matters.48
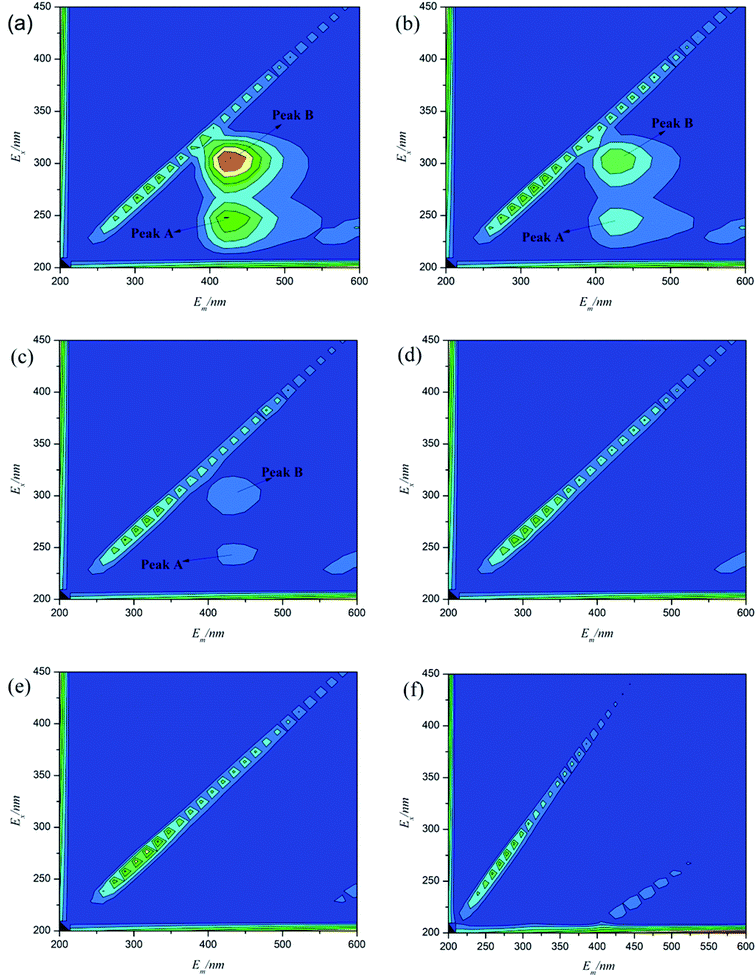 |
| | Fig. 11 Excitation–emission-matrix fluorescence spectra of 0 min (a), 15 min (b), 45 min (c), 90 min (d), 240 min (e), pure water (f) samples during the photocatalytic experiment. | |
As a key measurement indicator of the degradation degree of the organics polluting, TOC can be utilized to reflect the mineralization of organic matters.49 As shown in Fig. 12, photocatalytic performances of 2% Y3+/TiO2 and pure TiO2 were evaluated by measuring the TOC changes of shrimp wastewater in 240 minutes under UV light (a) and visible light (b), respectively. For comparison, only UV or visible light are provided without adding photocatalysts. The TOC value of shrimp wastewater is about 13.7 mg L−1 at the beginning of the reaction. It can be seen from Fig. 12(a), the TOC values are significantly reduced in the first 15 minutes of the reaction, which is consistent with the changes of CODCr. The main reason is that these easily oxidized organic matters in shrimp wastewater are complete photodegraded in the beginning. As the reaction continues, TOC values have not been changed significantly only under UV light irradiation. The TOC removal rates of 2% Y3+/TiO2 and pure TiO2 reaction systems are 67.5% and 49.8% after 240 minutes UV light irradiation, respectively. A maximum TOC removal rate of 67.5% is obtained and 2% Y3+/TiO2 sample exhibits the excellent photocatalytic performance. As shown in Fig. 12(b), the TOC removal rates of 2% Y3+/TiO2 and pure TiO2 reaction systems are 38.8% and 25.7% after 240 minutes visible light irradiation, respectively. Combined with CODCr and 3D fluorescence results, the humic-like and fulvic-like substances in shrimp wastewater can be mineralized by using 2% Y3+/TiO2 samples as photocatalysts. The remaining organic substances in water need further irradiation time to get totally mineralized.
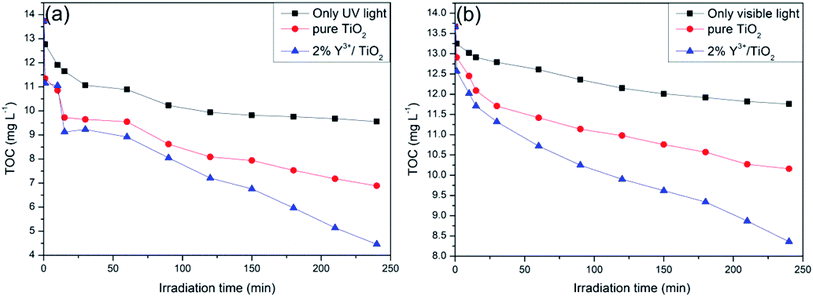 |
| | Fig. 12 TOC changes measured during photocatalytic reaction of 2% Y3+/TiO2 and pure TiO2 under UV light (a) or visible light (b). | |
The photocatalytic mechanism diagram of Y3+/TiO2 sample is shown in Fig. 13. The electron transition occurs between the O 2p orbit at the top of the valence band and the Ti 3d orbit at the bottom of the conduction band.50 A new energy level is introduced above the top of the valence band due to Y3+ modification. When the light is illuminated on the surface of TiO2, the electrons in the valence band are excited and transited to the above energy level. Then the electrons can be excited by the higher wavelength light and transited to the conduction band.51 It leads to red-shifted light absorption and visible light response compared with pure TiO2. The Y 3d energy level acts as a bridge of electron transition to promote the separation efficiency of photo-generated electron–hole pairs, so the photocatalytic activity can be improved.52
| organic pollutant + ·O2− → products |
| organic pollutant + ·OH → products |
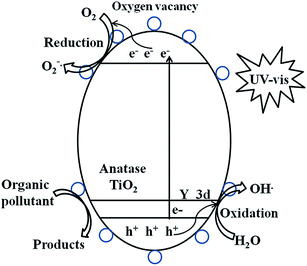 |
| | Fig. 13 Schematic of the photocatalytic reaction by Y3+ modified TiO2 photocatalysts. | |
In addition, the large radius Y3+ ions exist in the interstitial sites of TiO2 matrix or absorb on the surface of TiO2. It leads to lattice distortion and surface charge imbalance in TiO2.53 Compared to pure TiO2, the surface oxygen vacancies in Y3+/TiO2 are greatly increased. Electrons can be trapped by oxygen vacancies and migrated to the surface of TiO2. Other present oxygen species can be transferred by the trapped electrons to form superoxide radicals. Similarly, more hydroxide species can be converted by photo-generated holes into hydroxyl radicals. Thereby, the organic pollutants in the wastewater can be transferred into other products with the high oxidative radicals.54
4. Conclusions
A ball milling method was employed to prepare Y3+ modified TiO2 photocatalysts. UV-vis absorption results revealed that all Y3+/TiO2 photocatalysts showed a redshift of absorption compared to pure TiO2 and it led to visible light absorption response. XPS and XRD analysis indicated that Y3+ ions existed either in the interstitial sites of TiO2 matrix or adsorbed on the surface of TiO2. The increase of surface oxygen vacancy and the lattice distortion and dislocation generated by Y3+ modification were the result of better photocatalytic activity. Combined with SEM and BET, it can be concluded that Y3+ modification can inhibit the agglomeration of TiO2 nanoparticles and increase the BET specific surface area. The 2% Y3+/TiO2 samples exhibited the best photocatalytic activity under the optimized ball milling conditions. The humic-like substances and fulvic-like substances in shrimp wastewater can be effectively degraded in the presence of 2% Y3+/TiO2 under UV irradiation.
Conflicts of interest
There are no conflicts to declare.
Acknowledgements
This research was supported by the Department of Science & Technology of Hainan Province, P. R. China for program fund (no. 20156242, 20152033, 217100, 217101, ZDYF2017011, Hys2018-209), and the Program of State Key Laboratory of Pollution Control and Resource Reuse (PCRRF17026).
Notes and references
- S. MiarAlipour, D. Friedmann, J. Scott and R. Amal, J. Hazard. Mater., 2018, 341, 404–423 CrossRef.
- J. Li, C. Liu, X. Li, Z. Wang, Y. Shao, S. Wang, X. Sun, W. Peng, J. Guo and T. Sham, Chem. Mater., 2016, 28, 4467–4475 CrossRef CAS.
- J. Schneider, M. Matsuoka, M. Takeuchi, J. Zhang, Y. Horiuchi, M. Anpo and D. Bahnemann, Chem. Rev., 2014, 114, 9919–9986 CrossRef CAS.
- X. Chen and S. Mao, Chem. Rev., 2007, 107, 2891–2959 CrossRef CAS PubMed.
- M. Setvin, X. Shi, J. Hulva, T. Simschitz, G. Parkinson, M. Schmid, C. Valentin, A. Selloni and U. Diebold, ACS Catal., 2017, 7, 7081–7091 CrossRef CAS PubMed.
- C. Zhan, F. Chen, J. Yang, D. Dai, X. Cao and M. Zhong, J. Hazard. Mater., 2014, 267, 88–97 CrossRef CAS PubMed.
- X. Hu, X. Hu, C. Tang, S. Wen, X. Wu, J. Long, X. Yang, H. Wang and L. Zhou, Chem. Eng. J., 2017, 330, 355–371 CrossRef CAS.
- Y. Wang, R. Shi, J. Jun and Y. Zhu, Appl. Catal., B, 2010, 100, 179–183 CrossRef CAS.
- J. Li, W. Zhang, M. Ran, Y. Sun, H. Huang and F. Dong, Appl. Catal., B, 2019, 243, 313–321 CrossRef CAS.
- J. Li, X. Dong, G. Zhang, W. Cui, W. Cen, Z. Wu, S. Lee and F. Dong, J. Mater. Chem. A, 2019, 7, 3366–3374 RSC.
- J. Li, X. Dong, Y. Sun, G. Jiang, Y. Chu, S. Lee and F. Dong, Appl. Catal., B, 2018, 239, 187–195 CrossRef CAS.
- F. Zhou, R. Wang, J. Yin, Z. Han, L. Zhang, T. Jiao, J. Zhou, L. Zhang and Q. Peng, RSC Adv., 2019, 9, 878–883 RSC.
- Y. Xu, B. Ren, R. Wang, L. Zhang, T. Jiao and Z. Liu, Nanomaterials, 2019, 9, 10 CrossRef.
- Y. Feng, T. Jiao, J. Yin, L. Zhang, L. Zhang, J. Zhou and Q. Peng, Nanoscale Res. Lett., 2019, 14, 78 CrossRef PubMed.
- L. Zhang, Y. Wang, T. Xu, S. Zhu and Y. Zhu, J. Mol. Catal. A: Chem., 2010, 331, 7–14 CrossRef CAS.
- X. Wu and Z. Nan, Mater. Chem. Phys., 2019, 227, 302–312 CrossRef CAS.
- J. Fang, F. Wang, K. Qian, H. Bao, Z. Jiang and W. Huang, J. Phys. Chem. C, 2008, 112, 18150–18156 CrossRef CAS.
- H. Li, B. Sun, F. Yang, Z. Wang, Y. Xu, G. Tian, K. Pan, B. Jiang and W. Zhou, RSC Adv., 2019, 9, 7870–7877 RSC.
- J. Zhang, Z. Zhao, X. Wang, T. Yu, J. Guan, Z. Yu, Z. Li and Z. Zou, J. Phys. Chem. C, 2010, 114, 18396–18400 CrossRef CAS.
- G. Mamba, X. Mbianda and A. Mishra, Mater. Res. Bull., 2016, 75, 59–70 CrossRef CAS.
- G. Chen, D. Li, F. Li, Y. Fan, H. Zhao, Y. Luo, R. Yu and Q. Meng, Appl. Catal., A, 2012, 443–444, 138–144 CrossRef CAS.
- J. Xu, J. Shui, J. Wang, M. Wang, H. Liu, S. Dou, I. Jeon, J. Seo, J. Baek and L. Dai, ACS Nano, 2014, 8, 10920–10930 CrossRef CAS PubMed.
- X. Li, Z. Shao, K. Liu, Q. Zhao, G. Liu and B. Xu, J. Electroanal. Chem., 2017, 801, 368–372 CrossRef CAS.
- Y. Tang, Y. Zhang, J. Deng, J. Wei, L. Hong, B. Chandran, Z. Dong, Z. Chen and X. Chen, Adv. Mater., 2014, 26, 6111–6118 CrossRef CAS PubMed.
- S. Huang, L. Cheong, D. Wang and C. Shen, ACS Appl. Mater. Interfaces, 2017, 9, 23672–23678 CrossRef CAS PubMed.
- J. Zhang, W. Wu, S. Yan, G. Chu, S. Zhao, X. Wang and C. Li, Appl. Surf. Sci., 2015, 344, 249–256 CrossRef CAS.
- J. Lin, R. Zong, M. Zhou and Y. Zhu, Appl. Catal., B, 2009, 89, 425–431 CrossRef CAS.
- B. Chen, Y. Meng, J. Sha, C. Zhong, W. Hu and N. Zhao, Nanoscale, 2018, 10, 34–68 RSC.
- D. Wu, C. Li, Q. Kong, Z. Shi, D. Zhang, L. Wang, L. Han, X. Zhang and Q. Lin, J. Rare Earths, 2018, 36, 819–825 CrossRef CAS.
- H. Dong, G. Zeng, L. Tang, C. Fan, C. Zhang, X. He and Y. He, Water Res., 2015, 79, 128–146 CrossRef CAS PubMed.
- S. Paul, P. Chetri, B. Choudhury, G. Ahmed and A. Choudhury, J. Colloid Interface Sci., 2015, 439, 54–61 CrossRef CAS PubMed.
- H. Jiang, Y. Liu, J. Li and H. Wang, J. Rare Earths, 2016, 34, 604–613 CrossRef CAS.
- L. Sun, X. Zhao, X. Cheng, H. Sun, Y. Li, P. Li and W. Fan, Langmuir, 2012, 28, 5882–5891 CrossRef CAS.
- S. Bingham and W. Daoud, J. Mater. Chem., 2011, 21, 2041–2050 RSC.
- X. Zhang, Y. Xie, H. Chen, J. Guo, A. Meng and C. Li, Appl. Surf. Sci., 2014, 317, 43–48 CrossRef CAS.
- G. Mamba, X. Mbianda and A. Mishra, Mater. Res. Bull., 2016, 75, 59–70 CrossRef CAS.
- L. Kong, C. Wang, H. Zheng, X. Zhang and Y. Liu, J. Phys.
Chem. C, 2015, 119, 16623–16632 CrossRef CAS.
- T. Minato, S. Kajita, C. Pang, N. Asao, Y. Yamamoto, T. Nakayama, M. Kawai and Y. Kim, ACS Nano, 2015, 9, 6837–6842 CrossRef CAS PubMed.
- J. Zhou, M. Zhang and Y. Zhu, Phys. Chem. Chem. Phys., 2015, 17, 3647–3652 RSC.
- X. Yang, H. Zhao, J. Feng, Y. Chen, S. Gao and R. Cao, J. Catal., 2017, 351, 59–66 CrossRef CAS.
- J. Reszczynska, T. Grzyb, J. Sobczak, W. Lisowski, M. Gazda, B. Ohtani and A. Zaleska, Appl. Catal., B, 2015, 163, 40–49 CrossRef CAS.
- A. Kar, Y. Smith and V. Subramanian, Environ. Sci. Technol., 2009, 43, 3260–3265 CrossRef CAS PubMed.
- P. Parnicka, P. Mazierski, T. Grzyb, Z. Wei, E. Kowalska, B. Ohtani, W. Lisowski, T. Klimczuk and J. Nadolna, J. Catal., 2017, 353, 211–222 CrossRef CAS.
- D. Tobaldi, R. Ferreira, R. Pullar, M. Seabra, L. Carlos and J. Labrincha, J. Mater. Chem. C, 2015, 3, 4970–4986 RSC.
- J. Xing, H. Wang, X. Cheng, X. Tang, X. Luo, J. Wang, T. Wang, G. Li and H. Liang, Chem. Eng. J., 2018, 344, 62–70 CrossRef CAS.
- N. Dhakal, S. Salinas-Rodriguez, A. Ouda, J. Schippers and M. Kennedy, J. Membr. Sci., 2018, 555, 418–428 CrossRef CAS.
- M. Muller, J. Jimenez, M. Antonini, Y. Dudal, E. Latrille, F. Vedrenne, J. Steyer and D. Patureau, Waste Manage., 2014, 34, 2572–2580 CrossRef CAS.
- E. Carstea, J. Bridgeman, A. Baker and D. Reynolds, Water Res., 2016, 95, 205–219 CrossRef CAS.
- Y. Wei, C. Liu, S. Luo, J. Ma, Y. Zhang, H. Feng, K. Yin and Q. He, Chem. Eng. J., 2018, 354, 825–834 CrossRef CAS.
- X. Zhou, N. Liu and P. Schmuki, ACS Catal., 2017, 7, 3210–3235 CrossRef CAS.
- R. Jaiswal, J. Bharambe, N. Patel, A. Dashora, D. Kothari and A. Miotello, Appl. Catal., B, 2015, 168, 333–341 CrossRef.
- S. Peng, Y. Huang and Y. Li, Mater. Sci. Semicond. Process., 2013, 16, 62–69 CrossRef CAS.
- H. Shi, T. Zhang, T. An, B. Li and X. Wang, J. Colloid Interface Sci., 2012, 380, 121–127 CrossRef CAS PubMed.
- M. Dorraj, B. Goh, N. Sairi, P. Woi and W. Basirun, Appl. Surf. Sci., 2018, 439, 999–1009 CrossRef CAS.
Footnote |
| † Di Wu and Chen Li contributed equally. |
|
| This journal is © The Royal Society of Chemistry 2019 |
Click here to see how this site uses Cookies. View our privacy policy here.  Open Access Article
 ab,
Chen Li†ab,
Dashuai Zhang
 ab,
Lili Wangab,
Xiaopeng Zhang
 *abc,
Zaifeng Shi*ab and
Qiang Lin
 ab
ab
![[thin space (1/6-em)]](https://www.rsc.org/images/entities/char_2009.gif) :
:![[thin space (1/6-em)]](https://www.rsc.org/images/entities/char_2009.gif) 1, milling time was 4 h and milling rate was 500 rpm, the reaction rate constant of MB degradation can reach up to 0.1112 min−1 which was 4.2 times as fast as pure TiO2. All Y3+/TiO2 samples showed a red shift of absorption compared to pure TiO2 and it led to a visible light absorption response. The content of surface oxygen vacancies has significantly increased and the BET specific area increased to 104 m2 g−1. The CODCr removal rates of shrimp wastewater were 43.8% and 37.5% for 2% Y3+/TiO2 under UV and visible light, respectively. Besides, the TOC removal rates were 67.5% and 38.8%, respectively. Humic-like substances and fulvic-like substances in shrimp wastewater can be mineralized after 90 minutes irradiation.
1, milling time was 4 h and milling rate was 500 rpm, the reaction rate constant of MB degradation can reach up to 0.1112 min−1 which was 4.2 times as fast as pure TiO2. All Y3+/TiO2 samples showed a red shift of absorption compared to pure TiO2 and it led to a visible light absorption response. The content of surface oxygen vacancies has significantly increased and the BET specific area increased to 104 m2 g−1. The CODCr removal rates of shrimp wastewater were 43.8% and 37.5% for 2% Y3+/TiO2 under UV and visible light, respectively. Besides, the TOC removal rates were 67.5% and 38.8%, respectively. Humic-like substances and fulvic-like substances in shrimp wastewater can be mineralized after 90 minutes irradiation.![[thin space (1/6-em)]](https://www.rsc.org/images/entities/char_2009.gif) :
:![[thin space (1/6-em)]](https://www.rsc.org/images/entities/char_2009.gif) 1 to 10
1 to 10![[thin space (1/6-em)]](https://www.rsc.org/images/entities/char_2009.gif) :
:![[thin space (1/6-em)]](https://www.rsc.org/images/entities/char_2009.gif) 1. Next, the mixtures were ball-milled for different hours at room temperature. The milling times were changed from 1 to 10 hours and the ball milling rates were set from 300 rpm to 550 rpm. After this process, the mixtures were washed and dried at 90 °C for 4 hours and grinded into powders with a mortar. Pure TiO2 without adding any Y3+ was prepared under the optimized ball milling conditions.
1. Next, the mixtures were ball-milled for different hours at room temperature. The milling times were changed from 1 to 10 hours and the ball milling rates were set from 300 rpm to 550 rpm. After this process, the mixtures were washed and dried at 90 °C for 4 hours and grinded into powders with a mortar. Pure TiO2 without adding any Y3+ was prepared under the optimized ball milling conditions.

![[thin space (1/6-em)]](https://www.rsc.org/images/entities/char_2009.gif) :
:![[thin space (1/6-em)]](https://www.rsc.org/images/entities/char_2009.gif) 1 to 10
1 to 10![[thin space (1/6-em)]](https://www.rsc.org/images/entities/char_2009.gif) :
:![[thin space (1/6-em)]](https://www.rsc.org/images/entities/char_2009.gif) 1, the milling time was from 1 to 10 hours and the milling rate was from 300 to 550 rpm, respectively. There was a significant trend of linear correlation between ln(Ct/C0) and reaction time t, which was consistent with first-order reaction kinetic model.40 The apparent first-order reaction rate constants of the degradation of MB solution were calculated as followed:
1, the milling time was from 1 to 10 hours and the milling rate was from 300 to 550 rpm, respectively. There was a significant trend of linear correlation between ln(Ct/C0) and reaction time t, which was consistent with first-order reaction kinetic model.40 The apparent first-order reaction rate constants of the degradation of MB solution were calculated as followed:
![[thin space (1/6-em)]](https://www.rsc.org/images/entities/char_2009.gif) :
:![[thin space (1/6-em)]](https://www.rsc.org/images/entities/char_2009.gif) 1
1![[thin space (1/6-em)]](https://www.rsc.org/images/entities/char_2009.gif) :
:![[thin space (1/6-em)]](https://www.rsc.org/images/entities/char_2009.gif) 1
1![[thin space (1/6-em)]](https://www.rsc.org/images/entities/char_2009.gif) :
:![[thin space (1/6-em)]](https://www.rsc.org/images/entities/char_2009.gif) 1
1![[thin space (1/6-em)]](https://www.rsc.org/images/entities/char_2009.gif) :
:![[thin space (1/6-em)]](https://www.rsc.org/images/entities/char_2009.gif) 1
1![[thin space (1/6-em)]](https://www.rsc.org/images/entities/char_2009.gif) :
:![[thin space (1/6-em)]](https://www.rsc.org/images/entities/char_2009.gif) 1
1![[thin space (1/6-em)]](https://www.rsc.org/images/entities/char_2009.gif) :
:![[thin space (1/6-em)]](https://www.rsc.org/images/entities/char_2009.gif) 1
1![[thin space (1/6-em)]](https://www.rsc.org/images/entities/char_2009.gif) :
:![[thin space (1/6-em)]](https://www.rsc.org/images/entities/char_2009.gif) 1 to 4
1 to 4![[thin space (1/6-em)]](https://www.rsc.org/images/entities/char_2009.gif) :
:![[thin space (1/6-em)]](https://www.rsc.org/images/entities/char_2009.gif) 1, k increased from 0.0758 min−1 to 0.1112 min−1. An appropriate ball-to-powder weight ratio was good for the collision, shearing and grinding interactions among raw materials and grinding balls. If the ratio was too large, it caused great energy losses because parts of grinding balls are in the “idle” state. On the contrary, the buffer function was too large and interactions among grinding balls and powders were reduced.42 The optimized ball-to-powder weight ratio was 4
1, k increased from 0.0758 min−1 to 0.1112 min−1. An appropriate ball-to-powder weight ratio was good for the collision, shearing and grinding interactions among raw materials and grinding balls. If the ratio was too large, it caused great energy losses because parts of grinding balls are in the “idle” state. On the contrary, the buffer function was too large and interactions among grinding balls and powders were reduced.42 The optimized ball-to-powder weight ratio was 4![[thin space (1/6-em)]](https://www.rsc.org/images/entities/char_2009.gif) :
:![[thin space (1/6-em)]](https://www.rsc.org/images/entities/char_2009.gif) 1 in the experiment. The effect of milling time on photocatalytic activity of Y3+/TiO2 was shown in Fig. 9(c). The first-order reaction rate constant k increased steadily with the increase of milling time in the range of 1–4 hours. When the milling time was too long, the reaction rate constant k decreased to 0.0725 min−1. The surface active sites of TiO2 can be reduced to a certain degree for milling too long, so the best milling time was 4 hour. The relationship of milling rate and k was displayed in Fig. 9(d). In the range of 300 to 500 rpm, k increased from 0.0693 min−1 to 0.1112 min−1. When the milling rate was increased to 550 rpm, k decreased to 0.1073 min−1. Considering the service life time of planetary mill, the milling rate should not be set too fast. The optimum milling rate was 500 rpm.
1 in the experiment. The effect of milling time on photocatalytic activity of Y3+/TiO2 was shown in Fig. 9(c). The first-order reaction rate constant k increased steadily with the increase of milling time in the range of 1–4 hours. When the milling time was too long, the reaction rate constant k decreased to 0.0725 min−1. The surface active sites of TiO2 can be reduced to a certain degree for milling too long, so the best milling time was 4 hour. The relationship of milling rate and k was displayed in Fig. 9(d). In the range of 300 to 500 rpm, k increased from 0.0693 min−1 to 0.1112 min−1. When the milling rate was increased to 550 rpm, k decreased to 0.1073 min−1. Considering the service life time of planetary mill, the milling rate should not be set too fast. The optimum milling rate was 500 rpm.


