 Open Access Article
Facile synthesis of a zeolitic imidazolate framework-8 with reduced graphene oxide hybrid material as an efficient electrocatalyst for nonenzymatic H2O2 sensing†
Suling Yang ab,
Ning Xia*ab,
Mengyu Liab,
Panpan Liuab,
Yuxin Wangab and
Lingbo Quabc
aCollege of Chemistry and Chemical Engineering, Anyang Normal University, Anyang 455002, PR China. E-mail: yang_suling@163.com; xianing82414@163.com; Fax: +86 3722900040; Tel: +86 03722900040
bHenan Key Laboratory of New Opto-electronic Functional Materials, PR China
cCollege of Chemistry and Molecular Engineering, Zhengzhou University, Zhengzhou 450001, PR China
First published on 15th May 2019
Abstract
A zeolitic imidazolate framework-8 (ZIF-8)/reduced graphene oxide (rGO) nanocomposite was formed by using an efficient synthetic method. The morphology and structure of the ZIF-8/rGO nanocomposite were characterized by scanning electron spectroscopy (SEM), X-ray diffraction (XRD) and thermogravimetric analysis (TGA) mapping. The ZIF-8/rGO nanocomposites were immobilized on a carbon paste electrode (CPE) to construct a high-performance nonenzymatic electrochemical H2O2 sensor. A cyclic voltammetry (CV) study showed that the ZIF-8/rGO nanocomposites displayed better electrocatalytic activity toward H2O2 reduction compared to that of ZIF-8. An amperometric study indicated that the H2O2 sensor displayed high performance, which offered a low detection limit (0.05 μM) (S/N = 3), a high sensitivity (4.01 μA mM−1 cm−2), and a wide linear range (from 1.0 to 625 μM). An electrochemical reaction mechanism was proposed for H2O2 reduction on the ZIF-8/rGO/CPE. Importantly, the as-fabricated H2O2 sensor exhibited good reproducibility and excellent selectivity. Furthermore, the constructed high-performance sensor was utilized to monitor the H2O2 levels in real samples, and satisfactory results were obtained. These results demonstrated that the ZIF-8/rGO nanocomposite can be used as a good electrochemical sensor material in practical applications.
1. Introduction
In recent years, hydrogen peroxide (H2O2) has attracted considerable attention due to its important applications in food, industrial engineering, agriculture, medicine and health, clinical control and the environment.1–3 Thus, it would be very valuable to develop a simple, fast, reliable and accurate technique to detect H2O2. Among the various techniques proposed for H2O2 monitoring, electrochemical methods are the most convenient and effective.4–6 Unfortunately, enzyme-based biosensors for H2O2 detection cannot be subjected to harsh environments because enzymes can easily degrade, denature and become inactive after they are applied onto the electrode surface, and enzyme-based biosensors have high costs and storage requirements.7 To overcome several of the limitations defined above, peroxidase-like nanocomposite-based nonenzymatic electrochemical sensors for H2O2 detection have been developed in recent years. To obtain various nanocomposites with peroxidase-like bioactivity, noble metal-based materials (Pt, Pd, Ag, Au, etc.),8–10 carbon-based composites,11,12 metal oxide-based composites (MnO2,13 ZnO,14 Sn3O4,15 etc.), MOFs,15,16 etc., have been proposed and constructed to prepare nonenzymatic H2O2 sensors. Moreover, MOFs are worth further studying for the preparation of ideal catalytically active nanocomposites.17Metal–organic frameworks (MOFs), formed by metal connectors and organic linker molecules through strong coordinating bonds, have attracted enormous attention in recent years due to their advantages of ordered crystalline structures, large pore volumes, highly accessible surface areas, chemical tunability and available metal sites.18 Owing to these remarkable merits, MOFs have been widely applied in the areas of catalysis, drug delivery, and gas storage.17,19–21 Moreover, MOFs and their derived nanomaterials are interesting electrode materials and have been used in solar cells, energy storage devices, lithium-ion rechargeable batteries, fuel cells, and sensors.22–24 Nevertheless, the few adverse properties of MOFs are their poor thermal stability, weak electrical conductivity, and low mechanical strength and unstable nature in aqueous solution, which limit their further use as electrochemical sensors. In recent years, high-conductivity materials (carbon-based materials, noble metal-based materials, transition metal-based materials, etc.) have been coupled with MOFs to form nanocomposites and improve the electrochemical properties and electron conductivities of MOFs.25–27 The utilization of MOFs as a component in the preparation of metal-MOF/graphene-based materials is a convenient and effective strategy to enhance the electrochemical performance of MOFs.1,4
Graphene, a single layer of carbon atoms in a two-dimensional lattice, has received widespread attention due to its interesting nanostructure and extraordinary properties, such as high electron conductivity and exceptionally high surface area. These excellent properties make graphene a promising component for the preparation of graphene–MOF composites to enhance the electrochemical performance of MOFs. In recent years, many techniques have been developed to prepare graphene–MOF composites, including in situ growth, hydrothermal, direct mixing, Pickering emulsion polymerization, and atomic layer deposition methods.28–30 However, the above-mentioned methods still have shortcomings regarding the scalability and controllability of the preparation process for graphene–MOF composites. The strategy of directly mixing MOFs with graphene has been widely applied for obtaining graphene–MOF composites,31,32 but the preparation process often suffers from the following problems. The addition of the MOF components may not effectively prevent the aggregation of graphene nanosheets, which normally results in an uneven dispersion of each of the components within the resulting graphene–MOF composite. Although several researchers33,34 have reported that 3D graphene structures can be applied as templates for the production of graphene–MOF composites with uniform hierarchical structures, complex synthetic steps are normally required. Thus, it is still challenging to develop a low-cost, high-dimensionally controllable and convenient synthesis for graphene–MOF composites.
In this research, chitosan (CS) was used to reduce graphene oxide (GO) into reduced GO (rGO) and introduce functional groups (−NH2, –COOH) onto the surface of rGO. In addition, CS enables rGO to be well dispersed in an aqueous solution. ZIF-8 is a new subclass of porous metal–organic frameworks in which divalent metal cations are linked by imidazolate anions into tetrahedral frameworks that frequently possess a zeolite topology. We proposed a general, simple, and inexpensive approach, called the simple mixing method, for the preparation of ZIF-8/rGO nanocomposites, which can be used as electrode-modifying materials. The prepared ZIF-8/rGO nanocomposite, derived from a ZIF-8 and graphene, exhibited excellent electrochemical performance for the application of nonenzymatic detection of H2O2.
2. Experimental section
2.1. Chemicals
Ultrapure water was obtained from a Millipore Milli-Q UF-Plus Ultrapure Water System (Mequon, WI, US) (18 MΩ cm) and used throughout the experiments unless otherwise noted. H2O2 (30% w/w in H2O), 2-methylimidazole, Zn(NO3)2·6H2O, glucose, ethanol, uric acid (UA), ascorbic acid (AA) and methanol, graphite powder (99.95%, 325 mesh), and CS (75% deacetylated) were purchased from Sigma-Aldrich and used as received. All other chemicals used were of at least analytical reagent grade. A CS solution (0.5 wt%) was prepared by dissolving CS powder in an acetic acid (1 wt%) solution and then adjusting the pH to 5–6. The prepared CS solution was stored in a refrigerator until used. A 0.1 M pH 7.0 phosphate buffered saline (PBS) solution was used for H2O2 detection. All solutions were deoxygenated by purging with nitrogen gas before use.2.2. Instruments
A CHI 842C electrochemical workstation (Austin, TX, USA) was used to perform the electrochemical experiments. A conventional three-electrode system was used, in which either a bare CPE or modified CPE was used as the working electrode, Ag/AgCl (saturated KCl) and a platinum wire were used as the reference and counter electrodes, respectively. The potentials measured during the electrochemical experiments refer to this reference electrode. The surface morphology was characterized using field emission scanning electron microscopy (FESEM, JEOL 7401 F) and an X-ray diffractometer (Philips, X'pert, Netherlands).2.3. Synthesis of ZIF-8
The ZIF-8 was synthesized by reacting the precursor mixture at room temperature according to a previously reported protocol.35 Briefly, a solid mixture of 2-methylimidazole, Zn(NO3)2·6H2O, and methanol was prepared with a mass ratio of 1.1![[thin space (1/6-em)]](https://www.rsc.org/images/entities/char_2009.gif) :
:![[thin space (1/6-em)]](https://www.rsc.org/images/entities/char_2009.gif) 1
1![[thin space (1/6-em)]](https://www.rsc.org/images/entities/char_2009.gif) :
:![[thin space (1/6-em)]](https://www.rsc.org/images/entities/char_2009.gif) 32 in a glass vial and stirred for 12 h at room temperature. Then, the precipitate was collected by filtration, washed subsequently with ethanol for several times, dried in a vacuum drying oven at 30 °C for 1 day, and stored in a vial for further characterization.
32 in a glass vial and stirred for 12 h at room temperature. Then, the precipitate was collected by filtration, washed subsequently with ethanol for several times, dried in a vacuum drying oven at 30 °C for 1 day, and stored in a vial for further characterization.
2.4. Preparation of H2O2 biosensors
GO was prepared according to a modified Hummers' method.36 rGO was obtained by using CS as a reductant to reduce GO similar to a previously reported method.4 In simple, equivalent volumes of 1 mg mL−1 GO and 0.5 wt% CS solutions were fully stirred until a uniform yellow-brown solution was achieved. Subsequently, the above-mentioned solution was placed in a 90 °C water bath accompanied by vigorous stirring for 5 h until the color of the solution turned black. Finally, the resulting product was centrifuged and washed 3 times to obtain the CS-functionalized rGO. The detailed characterization results and discussion of the CS-rGO are shown in Fig. S1.†The ZIF-8/rGO composite was prepared through a simple mixing method. Briefly, the prepared ZIF-8 crystals (30 mg) were rapidly added into a methanol dispersion of graphene (1 mg mL−1, 20 mL) under vigorous sonication to form a ZIF-8/rGO suspension. Afterwards, the prepared composite suspension was subjected to a freeze-dry process to remove the methanol and obtain a ZIF-8/rGO composite powder. A bare CPE was prepared by mixing spectral graphite and amount of silicone oil in a mass ratio of 80![[thin space (1/6-em)]](https://www.rsc.org/images/entities/char_2009.gif) :
:![[thin space (1/6-em)]](https://www.rsc.org/images/entities/char_2009.gif) 30. The paste was thoroughly hand-mixed in a mortar and then firmly pressed into one end of a glassy tube (d = 4 mm). Electrical contact was established by a copper wire inserted deep into the opposite end of the tube. For electrode modification, 2 mg of the ZIF-8/rGO powder was dispersed into 1 mL of N,N-dimethylformamide by sonication. A 6.0 μL aliquot of the ZIF-8/rGO suspension was drop cast onto the CPE to form the ZIF-8/rGO-modified CPE (ZIF-8/rGO/CPE). For comparison, a ZIF-8/CPE and rGO/CPE were prepared through a similar procedure.
30. The paste was thoroughly hand-mixed in a mortar and then firmly pressed into one end of a glassy tube (d = 4 mm). Electrical contact was established by a copper wire inserted deep into the opposite end of the tube. For electrode modification, 2 mg of the ZIF-8/rGO powder was dispersed into 1 mL of N,N-dimethylformamide by sonication. A 6.0 μL aliquot of the ZIF-8/rGO suspension was drop cast onto the CPE to form the ZIF-8/rGO-modified CPE (ZIF-8/rGO/CPE). For comparison, a ZIF-8/CPE and rGO/CPE were prepared through a similar procedure.
3. Results and discussion
3.1. Morphology and physical characterization of the ZIF-8 nanosphere
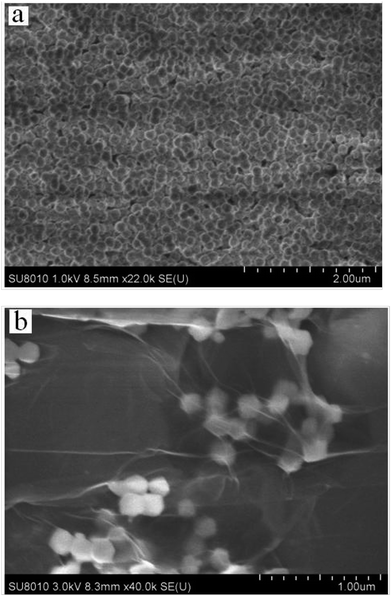
The characterizations of rGO are shown in Fig. S1 and S2 (ESI†). The morphology of the as-synthesized ZIF-8 nanosphere and the ZIF-8 nanosphere/rGO was recorded by SEM. Fig. 1a clearly reveal that the product consists of isometrical nanoparticles ZIF-8 nanosphere with a narrow size distribution. A statistical evaluation of 200 nanospheres results in an average diameter of 110 nm. As shown in Fig. 1b, the SEM image of ZIF-8 nanosphere/rGO nanocomposite shows that numerous ZIF-8 nanosphere disperse in rGO. The ZIF-8 exhibits milk-white particles due to the light scattering of the nanospheres. The transparent flake-like rGO with wrinkled and folded features is readily observed. Due to the smooth and planar nanosheets provided by rGO sheets, the ZIF-8 can well-proportioned dispersed with each other on the rGO nanosheets instead of aggregation.XRD patterns of experimental ZIF-8 and reported ZIF-8 were presented in Fig. 2. The XRD pattern of ZIF-8 showed strong and narrow peaks (black pattern), indicating that the as-prepared sample had good crystallinity. The main peak positions of the ZIF-8 were in the range of 5–50°. Comparison of all the observed peaks taken from the experimental ZIF-8 sample with those of a previously reported pattern37 (see Fig. 2) demonstrates that the product is single-phase ZIF-8 material.
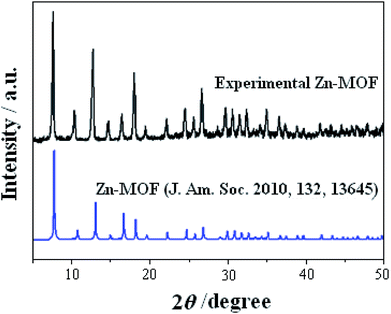 | ||
| Fig. 2 Experimental XRD pattern of the nanosphere ZIF-8 powder (black pattern) and XRD pattern simulated from the ZIF-8 crystal structure data37 (blue pattern). | ||
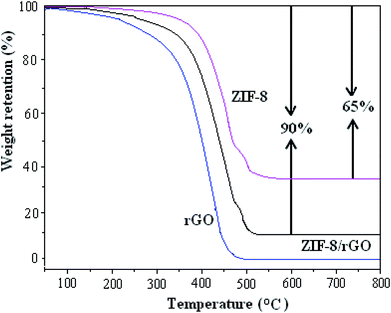
The weight percentage of the ZIF-8, rGO and ZIF-8/rGO composite was obtained by TGA (see Fig. 3), which was recorded from 25 to 800 °C with a heating flow air. The 65% weight loss of the ZIF-8 is entirely from the removal of the guest molecules (e.g., methanol) from the cavities, some species (e.g., Hmim) from the surfaces of the nanocrystals, and organic linker molecules. The final white solid residue was ZnO.38 It is worth noting that ZnO remain stable during the heating process, and rGO was completely burned out. The 90% weight loss of the ZIF-8/rGO composite is entirely from weight loss of the ZIF-8 and the burning of the rGO.
Raman spectra of the as-prepared GO, rGO and ZIF-8/rGO are given in Fig. S3 (ESI†). It provided convincing evidence for the graphene fragment structure. As can be seen, the rGO and GO show the characteristic D-band (∼1360 cm−1) and G-band (∼1590 cm−1), corresponding to the characteristic D and G bands of carbon materials. Generally speaking, the D band represents the structural defects and disordered structures, while the G band is assigned to the E2g vibration mode of sp2 domain indicative of the degree of graphitization. The D/G intensity ratio (ID/IG) is often used to reflect the structural disorder. The as-prepared CS-functionalized rGO is found to have the high ID/IG of ∼0.55, obviously lower than the ID/IG of ∼0.95 observed for GO, similar to that of reported functionalized graphene,39 which indicates the successful preparation of functionalized rGO. After ZIF-8/rGO composite formation, the increase in intensity ratio for D/G (0.64) is observed. This confirms successful deposition of ZIF-8 on rGO sheets.
The electro conductivity of all the samples was demonstrated by recording CVs in a suitable redox probe. CV measurements were carried out in the 5.0 mM [Fe(CN)6]3−/[Fe(CN)6]4− and 0.1 M KCl solutions at a scan rate of 100 mV s−1. As shown in Fig. S4 (ESI†), ZIF-8/rGO/CPE (a) has the strongest peak current, followed by rGO/CPE (b), and while ZIF-8/CPE (d) gives the unconspicuous peak current. It was therefore shown that ZIF-8/rGO/CPE has superior electron transport capability than rGO/CPE.
From the BET (Brunauer, Emmett and Teller) analysis, the observed N2 adsorption/desorption isotherms of the ZIF-8, rGO and ZIF-8/rGO composite samples are shown in Fig. S5 (ESI†). The samples show similar isotherm curves. According to the BET analysis, the specific surface area of ZIF-8, rGO and ZIF-8/rGO composite is 195.38, 170.00 and 284.10 m2 g−1, respectively. This is an evidence to suggest that the incorporation of ZIF-8 to rGO can improve the surface area.
3.2. Electrochemical response of H2O2 at different electrodes
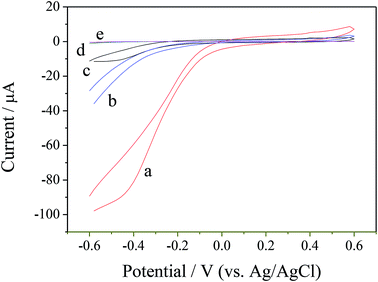
Fig. 4 shows the electrochemical responses of the different electrodes in 0.1 M pH 7.0 PBS containing 1.0 mM H2O2, which were obtained using cyclic voltammetry (CV), including ZIF-8/rGO/CPE (curve a), rGO/CPE (curve b), ZIF-8/CPE (curve c) and CPE (curve d). As can be observed, no detectable signal was observed for the bare CPE after the addition of H2O2, indicating the negligible electrocatalytic activity of the bare CPE (curve a) toward H2O2. However, in terms of rGO/CPE (curve b) and ZIF-8/CPE (curve c), after the addition of 1.0 mM H2O2, an obvious increase in the current at negative potential is observed, indicating that both rGO and ZIF-8 showed electrocatalytic activity toward H2O2. When the two electrocatalysts were integrated together to form a ZIF-8/rGO hybrid-materials-modified electrode, a remarkably high current at negative potential is obtained, which is the highest among all of the electrodes. According to the above observations, a possible electrochemical reaction mechanism can be proposed for H2O2 reduction on the ZIF-8/rGO/CPE. In general, H2O2 may be reduced according to the following equation:| H2O2 + 2e− + 2H+ → 2H2O |
The reduction current for H2O2 can be increased on the surface of the ZIF-8/rGO/CPE.
Among them, ZIF-8, delivers the better catalytic activity towards H2O2 electro-reduction. The main catalytic center can be attributed to the discrete Zn nodes in ZIF-8 owe to the reverse oxidation of Zn1+ to Zn2+.40 Besides, the existence of rGO in the ZIF-8/rGO structure can improve the charge-transfer ability of the modified electrode. The other plausible reason for the enhanced catalytic activity may be attributable to a synergistic effect between rGO and ZIF-8.
To further verify the electro-catalytic effect of ZIF-8/rGO, amperometric response was investigated at −0.3 V. As can be seen from Fig. 5, compared to rGO/CPE (b), ZIF-8/CPE (c) and CPE (d), the highest current response of ZIF-8/rGO/CPE (a) was displayed, which well revealed the considerable electro-catalytic activity of nanocomposite toward the reduction of H2O2.
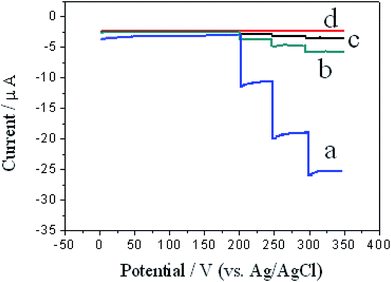 | ||
| Fig. 5 Amperometric response of ZIF-8/rGO/CPE (a), rGO/CPE (b), ZIF-8/CPE (c) and CPE (d) for successive additions of 0.1 mM H2O2 in 0.1 M pH 7.0 PBS at an applied potential of −0.3 V. | ||
3.3. Amperometric sensing of H2O2
The rapid and sensitive H2O2 detection capabilities of the ZIF-8/rGO modified CPE were tested through the amperometric response upon successive injections of different amounts of H2O2 (Fig. 6). At applied potential of −0.3 V. When the concentration of H2O2 changes from 1.0 μM to 625 μM, the response current and H2O2 concentration shows linear relationship in the ranges of 1.0 μM to 168 μM and 168 μM to 625 μM, respectively (Fig. 7). The regression equations are: ii μA = −1.0519 − 0.1143C/μM (r = 0.9969) for the range of 1.0 μM to 168 μM (Fig. 7) and ii μA = −7.0676 − 0.0970C/μM (r = 0.9910) for the range of 168 μM to 625 μM (Fig. 7). The different accumulation efficiency at different concentrations results in the different slopes of the two calibration curve. According to the following equation:41 the limit of detection (LOD) = 3.3 (sy/x/b), where sy/x is the residual standard deviation, b the slope of the calibration plot. This method usually implies a decision about controlling both false positive and false negative errors (α = β = 0.05). The lower limit of detection was calculated to be 0.05 μM. Table 1 lists the comparative characteristics of the as-prepared sensor with those of previously reported sensors for the detection of H2O2. The detection limit of H2O2 (0.05 μM) is lower than several MOF-based H2O2 sensors,3,42,43 graphene-based H2O2 sensors,30,44,45 and biomolecule-based H2O2 sensors.46,47 Here, it is worth noting that Song et al.4 prepared H2O2 sensors by combining sulfonated graphene with hemin, chitosan (CS), Cu-MOF and rGO. Although this biosensor demonstrated several excellent characteristics, the intrinsically biomolecular-based biosensor limits its widespread application due to the challenges in retaining the native stability and reaction activity of the biomolecule. However, in contrast, the H2O2 sensor constructed in this work displays several obvious advantages, such as a simple fabrication process, an excellent performance and a good electrocatalytic ability toward H2O2 without the aid of peroxide enzymes.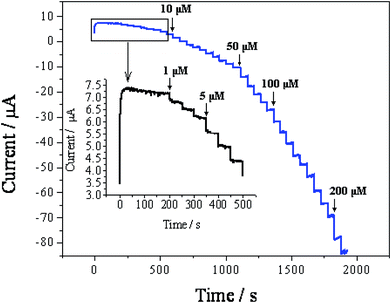 | ||
| Fig. 6 Amperometric response of the ZIF-8/rGO/CPE upon successive injections of different amounts of H2O2 into a stirring 0.1 M PBS (pH 7.0) solution at an applied potential of −0.3 V. | ||
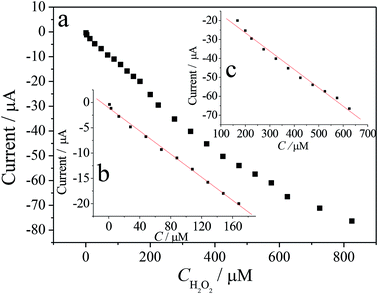 | ||
| Fig. 7 (a) Plot of the response current of H2O2 vs. its concentrations; (b) in the range of 1.0–168 μM; (c) in the range of 168–625 μM. | ||
| Electrode material | Reduction potential | Linear range/μM | LOD/μM | Ref. |
|---|---|---|---|---|
| Cu-MOF | −0.2 V (Ag/AgCl) | 1–900 | 1.0 | 38 |
| Cr-MOF | −0.375 V (Ag/AgCl) | 25–500 mM | 3.52 mM | 3 |
| Co-MOF | −0.40 V (standard Hg/HgO) | 5–9.0 mM | 3.76 mM | 39 |
| Graphene/Cu2O | −0.4 V (Ag/AgCl) | 800–7800 | 20.8 | 40 |
| Fe3O4/GO-PAMAM/Au | −0.2 V (Ag/AgCl) | 0.2–1000 | 2 | 41 |
| Cytc-HRP/ConA/HRP/MUA-MCH/Au | −0.05 V (SCE) | 20–3000 | 7.83 | 42 |
| Peroxidase/ionic liquid/Au/titanate | −0.4 V(Ag/AgCl) | 5–1000 | 2.1 | 43 |
| Cu-hemin MOFs/CS-rGO | −0.175 V (SCE) | 0.065–410 | 0.019 | 4 |
| Zn-MOF/ rGO | −0.3 (Ag/AgCl) | 1.0–625 | 0.05 | This work |
Under the optimized conditions, the reproducibility and stability of the ZIF-8/rGO/CPE were studied. The same ZIF-8/GR/CPE was independently measured the same H2O2 solution 5 times, and the relative standard deviation (RSD) of the electrochemical response was 5.5%. These results revealed that the ZIF-8/rGO/CPE had good reproducibility. Between measurements, the ZIF-8/rGO/CPE was stored at room temperature. When used once per 1 day, 98.5% and 95.6% of the initial response of the ZIF-8/rGO/CPE toward H2O2 remained after 1 and 5 days, respectively. These results indicated the excellent stability of the ZIF-8/rGO/CPE.
3.4. Interference studies and detection of H2O2 in real sample
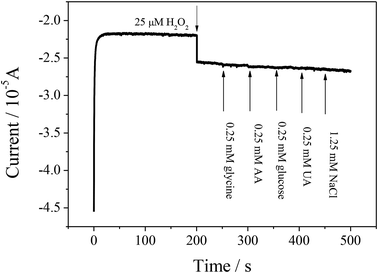
If the prepared sensor can be applied to analyze H2O2 in physiological samples, then it will be a meaningful device. Glycine, AA, glucose, UA and NaCl are common molecules in the physiological samples. An interference investigation was carried out by recording the amperometric response upon successive injection of glycine, AA, glucose, UA and NaCl, as shown in Fig. 8. The ZIF-8/rGO/CPE showed an obvious current response toward H2O2. With the successive additions of glycine, AA, glucose, UA and NaCl, no obvious amperometric response is observed, according to a relative error of < ±15%, indicating that the presence of these interferences do not affect the measurement of H2O2.To further investigate the use of the sensor for practical analysis, the constructed sensor was applied to detect H2O2 in milk samples because H2O2 is often used as a preservative agent in milk. The concentrations of H2O2 in milk samples were determined with the standard addition method. In order to confirm the accuracy of this method, a H2O2 quantitative assay kit (water-compatible) was used as a control experiment. The UV-Vis absorbance spectra were obtained on a UV-2700 spectrophotometer (Shimadzu), and the maximum absorption wavelength of 560 nm was used for the quantitative assay. A comparison of the results of the prepared electrode and the H2O2 quantitative assay kit is listed in Table 2. The results indicate that the sensor developed in this work could be efficiently used for the determination of H2O2 in real samples.
| Sample | Added (μM) | Proposed sensor | Quantitative assay kit | ||
|---|---|---|---|---|---|
| Found (μM) | Recovery | Found (μM) | Recovery | ||
| 1 | 2 | 1.90 ± 0.20 | 95.0% | 1.95 ± 0.11 | 97.5% |
| 2 | 20 | 20.00 ± 0.13 | 100.0% | 18.6 ± 0.06 | 93.0% |
| 3 | 200 | 195.0 ± 0.04 | 97.5% | 203.6 ± 0.21 | 101.8% |
4. Conclusions
In conclusion, a novel nanocomposite was developed comprising ZIF-8 nanospheres with rGO. The resulting ZIF-8/rGO nanocomposite demonstrated a high electrocatalytic ability toward H2O2 reduction. Compared to the known sensors of H2O2, the proposed electrode exhibits several interesting advantages: (i) simplicity of the preparation method for the direct crystallization of ZIF-8 in air; (ii) high sensitivity due to the large surface area, good electrocatalytic activity of ZIF-8 and electrical conductivity of graphene; (iii) excellent selectivity owing to the size exclusion provided by ZIF-8; (iv) rapid response because of the inherent properties of ZIF-8 and rGO; and (v) good stability of the modified electrode. The results showed that the ZIF-8/rGO is a promising electrode material for application in electroanalysis, and it may introduce new methods to construct nonenzymatic electrochemical sensors that have excellent activity and high sensitivity.Conflicts of interest
There are no conflicts to declare.Acknowledgements
The present work was supported by grants from the National Natural Science Foundation of China (NSFC, No. 21804002), the Program for Science and Technology Innovation Talents at the University of Henan Province (No. 18HASTIT005), Key scientific research projects in Henan colleges and Universities (No. 19A150016) and Anyang Science and Technology Bureau (No. 28).References
- Y. Zhou, C. Li, Y. Hao, B. Ye and M. Xu, Talanta, 2018, 188, 282–287 CrossRef CAS PubMed.
- R. Zhang and W. Chen, Biosens. Bioelectron., 2017, 89, 249–268 CrossRef CAS PubMed.
- N. S. Lopa, M. M. Rahman, F. Ahmed, S. Chandra Sutradhar, T. Ryu and W. Kim, Electrochim. Acta, 2018, 274, 49–56 CrossRef CAS.
- L. Wang, H. Yang, J. He, Y. Zhang, J. Yu and Y. Song, Electrochim. Acta, 2016, 213, 691–697 CrossRef CAS.
- S. L. Yang, G. Li, G. F. Wang, L. X. Liu and L. B. Qu, J. Alloys Compd., 2016, 688, 910–916 CrossRef CAS.
- N. Isoaho, E. Peltola, S. Sainio, J. Koskinen and T. Laurila, RSC Adv., 2018, 8, 35802–35812 RSC.
- Y. Y. Zhang, X. Y. Bai, X. M. Wang, K. K. Shiu, Y. L. Zhu and H. Jiang, Anal. Chem., 2014, 86, 9459–9465 CrossRef CAS PubMed.
- Y. Sun, M. Luo, X. Meng, J. Xiang, L. Wang, Q. Ren and S. Guo, Anal. Chem., 2017, 89, 3761–3767 CrossRef CAS PubMed.
- L. L. Tian, K. D. Xia, W. P. Hu, X. H. Zhong, Y. L. Chen, C. Yang, G. G. He, Y. Y. Su and L. Li, Electrochim. Acta, 2017, 231, 190–199 CrossRef CAS.
- S. Berbeć, S. Żołądek, A. Jabłońska and B. Pałys, Sens. Actuators, B, 2018, 258, 745–756 CrossRef.
- Y. Yuan, F. Zhang, H. Wang, J. Liu, Y. Zheng and S. Hou, RSC Adv., 2017, 7, 30542–30547 RSC.
- C. Peng, S. Zhou, X. Zhang, T. Zeng, W. Zhang, H. Li, X. Liu and P. Zhao, Sens. Actuators, B, 2018, 270, 530–537 CrossRef CAS.
- K. Vijayalakshmi, A. Renitta, K. Alagusundaram and A. Monamary, Mater. Chem. Phys., 2018, 214, 43–439 CrossRef.
- Y. Zheng, Z. Wang, F. Peng and L. Fu, Braz. J. Pharm. Sci., 2016, 52, 781–786 CrossRef CAS.
- C. Zhang, M. Wang, L. Liu, X. Yang and X. Xu, Electrochem. Commun., 2013, 33, 131–134 CrossRef CAS.
- B. Sherino, S. Mohamad, S. N. A. Halim and N. S. A. Manan, Sens. Actuators, B, 2018, 254, 1148–1156 CrossRef CAS.
- Z. Liang, C. Qu, D. Xia, R. Zou and Q. Xu, Angew. Chem., Int. Ed. Engl., 2018, 57, 4891–4896 CrossRef PubMed.
- S. L. James, Chem. Soc. Rev., 2003, 32, 276–288 RSC.
- A. Dhakshinamoorthy, A. M. Asiri and H. García, Angew. Chem., Int. Ed. Engl., 2016, 55, 5414–5445 CrossRef CAS PubMed.
- X. Chen, R. Tong, Z. Shi, B. Yang, H. Liu, S. Ding, X. Wang, Q. Lei, J. Wu and W. Fang, ACS Appl. Mater. Interfaces, 2018, 10, 2328–2337 CrossRef CAS PubMed.
- C. Y. Gao, H. R. Tian, J. Ai, L. J. Li, S. Dang, Y. Q. Lan and Z. M. Sun, Chem. Commun., 2016, 52, 11147–11150 RSC.
- D. Y. Ahn, D. Y. Lee, C. Y. Shin, H. T. Bui, N. K. Shrestha, L. Giebeler, Y. Y. Noh and S. H. Han, ACS Appl. Mater. Interfaces, 2017, 9, 12930–12935 CrossRef CAS PubMed.
- K. M. Choi, J. H. Park and J. K. Kang, Chem. Mater., 2015, 27, 5088–5093 CrossRef CAS.
- Z. Song, N. Cheng, L. Andrew and X. Sun, Catalysts, 2016, 6, 1–19 Search PubMed.
- Y. Zhang, X. Bo, C. Luhana, H. Wang, M. Li and L. Guo, Chem. Commun., 2013, 49, 6885–6887 RSC.
- P. Arul and S. Abraham John, Electrochim. Acta, 2017, 235, 680–689 CrossRef CAS.
- Y. Shu, Y. Yan, J. Chen, Q. Xu, H. Pang and X. Hu, ACS Appl. Mater. Interfaces, 2017, 9, 22342–22349 CrossRef CAS PubMed.
- M. S. Rahmanifar, H. Hesari, A. Noori, M. Y. Masoomi, A. Morsali and M. F. Mousavi, Electrochim. Acta, 2018, 275, 76–86 CrossRef CAS.
- L. Liu, Y. Yan, Z. Cai, S. Lin and X. Hu, Adv. Mater. Interfaces, 2018, 5, 1701548 CrossRef.
- F. Zhang, L. Liu, X. Tan, X. Sang, J. Zhang, C. Liu, B. Zhang, B. Han and G. Yang, Soft Matter, 2017, 13, 7365–7370 RSC.
- C. Petit and T. J. Bandosz, Adv. Mater., 2009, 21, 4753–4757 CrossRef CAS.
- M. Jahan, Q. Bao and K. P. Loh, J. Am. Chem. Soc., 2012, 134, 6707–6713 CrossRef CAS PubMed.
- X. Cao, B. Zheng, X. Rui, W. Shi, Q. Yan and H. Zhang, Angew. Chem., Int. Ed. Engl., 2014, 53, 1404–1409 CrossRef CAS PubMed.
- X. Ge, Z. Li and L. Yin, Nano Energy, 2017, 32, 117–124 CrossRef CAS.
- X. Xu, W. Shi, P. Li, S. Ye, C. Ye, H. Ye and T. Lu, Chem. Mater., 2017, 29, 6058–6065 CrossRef CAS.
- W. S. Hummers and R. E. Offeman, J. Am. Chem. Soc., 1958, 80, 1339 CrossRef CAS.
- N. Chang, Z. Y. Gu and X. P. Yan, J. Am. Chem. Soc., 2010, 39, 13645–13647 CrossRef PubMed.
- J. Cravillon, S. Münzer, S. J. Lohmeier, A. Feldhoff, K. Huber and M. Wiebcke, Chem. Mater., 2009, 21, 1410–1412 CrossRef CAS.
- H. Tetsuka, R. Asahi, A. Nagoya, K. Okamoto, I. Tajima, R. Ohta and A. Okamoto, Adv. Mater., 2012, 24, 5333–5338 CrossRef CAS PubMed.
- Y. Wang, P. Hou, Z. Wang and P. Kang, ChemPhysChem, 2017, 18, 3142–3147 CrossRef CAS PubMed.
- E. Desimoni, B. Brunetti and R. Cattaneo, Ann. Chim., 2004, 94, 555–569 CrossRef CAS.
- D. Zhang, J. Zhang and R. Zhang, Talanta, 2015, 144, 1176–1181 CrossRef CAS PubMed.
- L. Yang, C. Xu, W. Ye and W. Liu, Sens. Actuators, B, 2015, 215, 489–496 CrossRef CAS.
- M. Liu, R. Liu and W. Chen, Biosens. Bioelectron., 2013, 45, 206–212 CrossRef CAS PubMed.
- X. Yang, L. Wang, G. Zhou, N. Sui, Y. Gu and J. Wan, J. Cluster Sci., 2014, 26, 1–10 Search PubMed.
- Y. Song, Y. Wang, H. Liu and L. Wang, Int. J. Electrochem. Sci., 2012, 7, 11206–11218 CAS.
- X. Liu, H. Feng, R. Zhao, Y. Wang and X. Liu, Biosens. Bioelectron., 2012, 31, 101–104 CrossRef CAS PubMed.
Footnote |
| † Electronic supplementary information (ESI) available. See DOI: 10.1039/c9ra02096a |
| This journal is © The Royal Society of Chemistry 2019 |

