 Open Access Article
Simultaneous size manipulation and red upconversion luminescence enhancement of CaF2:Yb3+/Ho3+ nanoparticles by doping with Ce3+ ions
Xu Yang ac,
Maohui Yuan
 *ac,
Rui Wang
 ac,
Xiaofan Zhaoac,
Zining Yangac,
Kai Hanbc,
Hongyan Wang
 *ac and
Xiaojun Xuabc
aCollege of Advanced Interdisciplinary Studies, National University of Defence Technology, Changsha, 410073, China. E-mail: yuanmaohuino1@126.com; wanghongyan@nudt.edu.cn
bState Key Laboratory of Pulsed Power Laser Technology, National University of Defence Technology, Changsha, 410073, China
cHunan Provincial Key Laboratory of High Energy Laser Technology, National University of Defence Technology, Changsha, 410073, China
First published on 30th April 2019
Abstract
Harnessing the color tuning capability of upconversion nanoparticles (UCNPs) is of great significance in the field of advanced bioimaging and color display. Here, we report the tunable size and upconversion luminescence (UCL) multicolor in CaF2:Yb3+/Ho3+/Ce3+ UCNPs, which were synthesized by a facile hydrothermal method. It was found that the size of these UCNPs could be controlled (from 600 to 30 nm) by varying the concentration of Ce3+ ions. Under the excitation of a 980 nm continuous-wave (CW) laser, the UCL color of these UCNPs can be tuned from green to red as the doped Ce3+ ions gradually increase from 0 to 10 mol% and the red-to-green (R/G) ratio is enhanced remarkably. It is suggested that the cross-relaxation (CR) processes between Ho3+ and Ce3+ ions contribute to the tunable multicolor and enhancement of the R/G ratio. The mechanism of these processes is well supported by the time-resolved decay and near infrared (NIR) emission measurements.
1. Introduction
UCNPs doped with lanthanide ions are a unique category of luminescent materials featuring abundant electronic transition in 4f electron shells, possessing remarkable optical properties, such as a sharp emission peak, long luminescence decay time and extremely low susceptibility to the chemical environment. These materials have the capability to upconvert two or more low energy photons into one high energy photon, with various emission bands ranging from violet to infrared.1–3 Over the past decade, this anti-Stokes optical property has advanced a broad range of applications, including bioimaging,4,5 lasers,6 anti-counterfeiting,7 photovoltaics,8,9 drug delivery,10,11 and solar energy harvesting.12 In particular, manipulating the upconversion (UC) color of UCNPs has gained tremendous attention throughout the past few years due to its promise for applications in multiplex biological labelling,13,14 color display,15,16 and imaging.17,18 Moreover, owing to being located in the “optical window” of bio-tissues and cells, red UC emission centered at 650 nm is favored by application in the biomedicine area.19,20 In addition, when the luminescence color is tuned from green to red (even a single-red-band), it presents much better chromatic purity, resulting in a much higher spatial resolution in bio-medical field applications (e.g. bioimaging).11,21 Thus, it is of great significance to achieve enhancing red UCL in lanthanide doped nanoparticles through color manipulation.Up to now, effective and controllable approaches have been implemented to tune the UCL color, including controlling the power density of excitation laser,22 varying the excitation pulse width and wavelength,23,24 changing temperature,25 modulating the doping concentration and introducing suitable doping ions.26–29 However, except the last two methods, most of them could be hindered by extra requirements for laser sources and experimental environment in specific applications. So far, many UC materials have easily realized red emission, for example, NaYF4:Yb3+/Er3+ nanoparticles facilitating red UC emission by increasing the concentration of Yb3+ ions, NaYF4:Yb3+/Er3+ (Yb3+/Ho3+) nanoparticles emitting red UC emission via codoping with Mn2+, Fe3+ or Pb2+.11,18,30,31
Yb3+/Ho3+ codoped UCNPs are one of the most efficient UC materials and have been widely studied. Generally, under the excitation of 980 nm CW laser, Yb3+/Ho3+ codoped UCNPs mainly exhibit green (5S2/5F4 → 5I8, 540 nm) and red (5F5 → 5I8, 650 nm) UC emissions. It should be mentioned that the red UC emission closely associated with two extra non-radiative relaxation (NR) processes (5I6 → 5I7 and 5S2/5F4 → 5F5). Consequently, altering these two NR processes could effectively change the red UC emission radiative probability and modulate the luminescence color. Based on the analysis above, Zhang et al. reported the single-red-band UC emission in NaYF4:Yb3+/Ho3+ nanoparticles by codoping with Ce3+ ions for the first time.32 Moreover, similar phenomenon has been demonstrated in NaGdF4, NaLuF4, LiYbF4, AgLa(MoO4)2 and Sr2GdF7 host lattices.33–37 Actually, CaF2 is also an important yet under-studied UCNPs due to its low phonon energy, easy substitution by lanthanide ions and non-toxicity to biological tissues, which has been widely applied in biological fields such as biological labelling38,39 and drug delivery.40 Besides, the Ce3+ ion has a larger ionic radius than Ca2+ ion. This indicates that the incorporation of Ce3+ ions in CaF2:Yb3+/Ho3+ UCNPs would vary the particle size of the CaF2 host lattice. The simultaneous size manipulation and UCL multicolor tunability, especially dominant red emission of UCNPs could meet the growing demand in biological applications. However, relevant studies are still challenging and rarely reported. Until now, this has been realized in Yb3+/Er3+ codoped UCNPs by doping with Fe3+ and Mn2+ ions.18,41 To the best of our knowledge, Ce3+-induced UCL multicolor and size manipulation of Yb3+/Ho3+ codoped UCNPs has never been reported so far.
In this work, we synthesized the Ce3+ doped CaF2:Yb3+/Ho3+ UCNPs through a hydrothermal method. The influence of Ce3+ concentration on the size and phase of CaF2 nanoparticles was studied in detail. Under the excitation of 980 nm CW laser, the UCL color of these UCNPs can be tuned from green to red as the doped Ce3+ ions increase from 0 to 10 mol%. Moreover, the mechanism of the enhancement of red UC emission has been demonstrated by the measurements of fluorescence lifetime, NIR emission as well as the dependence of luminescence intensity on the excitation power.
2. Experimental details
2.1. Synthesis of CaF2:Yb3+/Ho3+/Ce3+ (20/2/x mol%) UCNPs
The raw materials were purchased from Aladdin (China), including YbCl3·6H2O (99.9% metals basis), HoCl3·6H2O (99.9% metals basis), CeCl3·7H2O (99.9% metals basis), CaCl2·2H2O (99.99% metals basis), ethylenediaminetetraacetic acid (EDTA) (99% analytical grade) and NaBF4 (99.99% metals basis). All the chemicals were used as received without further purification.The CaF2:Yb3+/Ho3+/Ce3+ UCNPs were synthesized by a modified hydrothermal procedure. The molar ratio of (Ln3+ & Ca2+)/EDTA/NaBF4 was fixed to 1![[thin space (1/6-em)]](https://www.rsc.org/images/entities/char_2009.gif) :
:![[thin space (1/6-em)]](https://www.rsc.org/images/entities/char_2009.gif) 1
1![[thin space (1/6-em)]](https://www.rsc.org/images/entities/char_2009.gif) :
:![[thin space (1/6-em)]](https://www.rsc.org/images/entities/char_2009.gif) 2. In a typical procedure, 2 mmol of chloride salts and 2 mmol EDTA were dissolved in 20 mL of deionized (DI) water and the mixtures were stirred vigorously for 1 h. Then, 20 mL of aqueous solution containing 4 mmol NaBF4 was transferred to the aqueous solution prepared above. By stirring for another 1 h, a milky colloidal solution was obtained. Subsequently, the mixtures were transferred into a 50 mL Teflon-lined autoclave and heated at 200 °C for 30 h, and then slowly cooled down to room temperature. The precipitates were collected by centrifugation at 6000 rpm for 4 min, and washed with DI water and ethanol for several times, and dried at 40 °C for 12 h in air. Different dopant contents of UCNPs were synthesized by varying the composition of the RECl3 and CaCl2 while keeping the total RE3+ and Ca2+ ions constant at 2 mmol.
2. In a typical procedure, 2 mmol of chloride salts and 2 mmol EDTA were dissolved in 20 mL of deionized (DI) water and the mixtures were stirred vigorously for 1 h. Then, 20 mL of aqueous solution containing 4 mmol NaBF4 was transferred to the aqueous solution prepared above. By stirring for another 1 h, a milky colloidal solution was obtained. Subsequently, the mixtures were transferred into a 50 mL Teflon-lined autoclave and heated at 200 °C for 30 h, and then slowly cooled down to room temperature. The precipitates were collected by centrifugation at 6000 rpm for 4 min, and washed with DI water and ethanol for several times, and dried at 40 °C for 12 h in air. Different dopant contents of UCNPs were synthesized by varying the composition of the RECl3 and CaCl2 while keeping the total RE3+ and Ca2+ ions constant at 2 mmol.
2.2. Physical characterization
The powder X-ray diffraction (XRD) patterns of the UCNPs were measured by an X-ray diffractometer with Cu Kα radiation at 40 kV and 200 mA (TTR III system, Rigaku), with the angular 2θ ranging from 20° to 80°. The scanning rate of the 2θ angle of the XRD spectra was 10° min−1. Meanwhile, the size and morphology of these UCNPs were characterized by transmission electron microscopy (TEM) (Tecnai G2 F20, FEI). Before the TEM test, all the samples were dispersed in ethanol and sonicated for 10 min, and a drop of the solution of each sample was evaporated on a copper mesh grid supported by a carbon film.2.3. Photoluminescence measurements
The UCNPs were dispersed in ethanol and irradiated by 980 nm CW laser with a focus diameter of 4 mm. The UCL was collected by a lens coupled grating monochromator (Omni-λ3072i, Zolix) with an integrated photomultiplier tube (PMTH-S1-R928). For the NIR emission measurements, a NIR spectrometer (NIR 1700, ideaoptics) was utilized. The decay profiles of UC emissions were recorded by a digital oscilloscope (1 GHz, InfiniiVision DSOX6002A, KEYSIGHT) and a nanosecond pulsed 980 nm laser used as the excitation source (the repetition rate is 10 Hz and the pulse duration is 20 ns). All the above experiments were carried out at room temperature.3. Results and discussion
The morphology and phase of the as-prepared CaF2:Yb3+/Ho3+/Ce3+ UCNPs were characterized by TEM and XRD. Fig. 1(a–f) present the TEM micrographs of the CaF2:Yb3+/Ho3+ (20/2 mol%) UCNPs doped with 0, 2, 4, 6, 8 and 10 mol% Ce3+ ions, respectively. It could be seen that these UCNPs are nearly monodispersed with uniform size distribution in each sample. The mean size of UCNPs decreases from 600 to 30 nm with the doping Ce3+ ions increasing from 0 to 10 mol%. Notably, the size of the UCNPs is independent on the doping Ce3+ ions (when the doping Ce3+ ions larger than 6 mol%), which always keep the approximate average size of 30 nm. The tunable size reduction of the UCNPs might attribute to the fact that the larger Ce3+ ions enter the CaF2 host lattice by substituting relatively smaller Ca2+ ions.3,42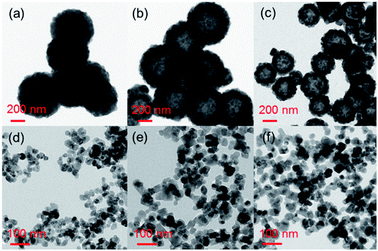 | ||
| Fig. 1 (a–f) Typical TEM images of CaF2:Yb3+/Ho3+ (20/2 mol%) UCNPs doped with 0, 2, 4, 6, 8, 10 mol% Ce3+ ions, respectively. | ||
Fig. 2 displays the XRD patterns of the CaF2:Yb3+/Ho3+ UCNPs doping with different concentrations of Ce3+ ions. All the diffraction peaks match well with the standard peak positions of the cubic phase of CaF2 materials (JCPDS no. 87-0976), which indicates that the as-prepared UCNPs are highly crystallized. It should be noted that the diffraction peaks shifted slightly towards lower angle, which is ascribed to the substitution of smaller Ca2+ ions by the relatively larger Ce3+ ions.
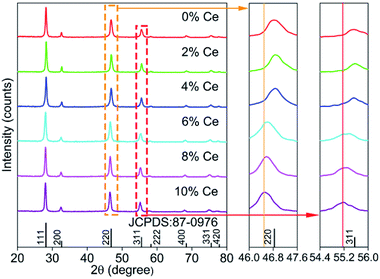 | ||
| Fig. 2 XRD patterns of CaF2:Yb3+/Ho3+ UCNPs doped with Ce3+ ions of 0–10 mol%, and its local magnification. | ||
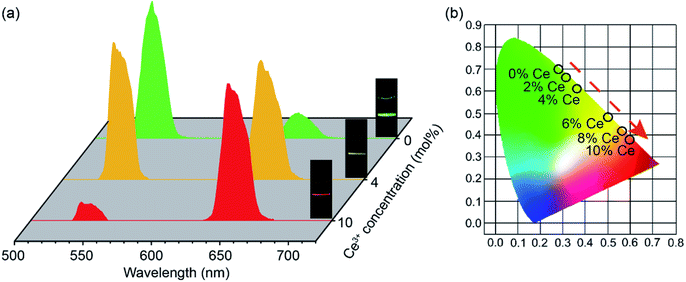
Fig. 3(a) illustrates the UC emission spectra of CaF2:Yb3+/Ho3+ UCNPs doping with different Ce3+ ions (0, 4 and 10 mol%), and the insets exhibit the corresponding UCL color. Two typical UC emissions of Ho3+ ion can be observed under the excitation of 980 nm CW laser: green (541 nm) and red (650 nm) emission bands, attributing to the transitions of 5S2/5F4 → 5I8, and 5F5 → 5I8, respectively. For Ce3+-free UCNPs, it is found that the green emission (541 nm) is stronger than the red emission (650 nm), which exhibits a green luminescence color. By increasing the doping Ce3+ ions up to 4 mol%, the red emission is further enhanced, leading to the color changing from green to yellow. If the doping Ce3+ ions further increase to 10 mol%, the green UC emission is efficiently suppressed and the red UC emission is significantly enhanced, resulting in the luminescence color tuning from yellow to red. As presented in Fig. 3(b), we have calculated the CIE chromaticity coordinates of CaF2:Yb3+/Ho3+ UCNPs doping with different concentrations of Ce3+ ions (0–10 mol%) based on their UCL spectra. The result reveals that a wide range of multicolor can be acquired by adjusting the concentrations of Ce3+ ions. This means that these UCNPs could be suitable for different applications.
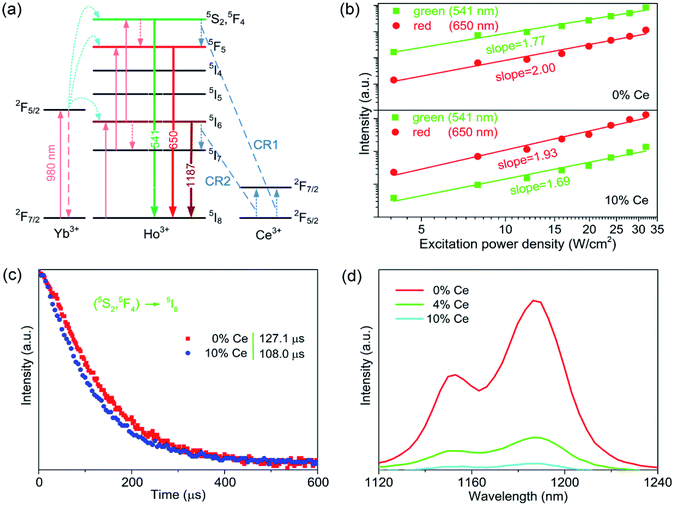
To figure out the color tuning capability of CaF2:Yb3+/Ho3+/Ce3+ UCNPs in detail, UC samples with Ce3+ ions contents ranging from 0 to 10 mol% were prepared, and the corresponding UC spectra were measured as well. The R/G intensity ratio is calculated as exhibited in Fig. 4. When the Ce3+ concentration varies from 0 to 10 mol%, the R/G ratio can be promoted from 0.17 to 7.44. It indicates that the doping of Ce3+ ions plays an important role in tuning the luminescence color. To understand the mechanism of the UC emission, the population processes in CaF2:Yb3+/Ho3+/Ce3+ UCNPs are schematically demonstrated. As shown in Fig. 5(a), a proposed energy level diagram of Yb3+, Ho3+, Ce3+ ions and the relevant ET processes are also displayed. Under the excitation of 980 nm CW laser, the Yb3+ ions absorb the laser energy and the ground state (2F7/2) can be excited to the excited state (2F5/2). Next, Ho3+ ions are excited from ground state 5I8 to 5I6 through the efficient ET process between Yb3+ and Ho3+ ions, and a NR process occurs in the 5I6 state, which leads to a population in the 5I7 state. Similarly, 5F5 and 5S2/5F4 state of Ho3+ ions can be populated by the utilization the ET processes from the excited Yb3+ ions as well. Therefore, once these excited states are populated, the efficient UC emissions will generate, including the green (5S2/5F4 → 5I8) and red (5F5 → 5I8) emission, as well as a NIR (5I6 → 5I8) emission. It should be mentioned that the NR process from 5S2/5F4 to the 5F5 state also makes contribution to the red emission. As discussed in the section of introduction, the two NR processes (5I6 → 5I7 and 5S2/5F4 → 5F5) could involve in the modulation of red emission of Ho3+ ions. It should be noted that the phonon energy of CaF2 host lattice (∼350 cm−1) is much lower than the energy gaps of 5S2/5F4 → 5F5 and 5I6 → 5I7 (∼3000 cm−1). This means that these two NR processes in CaF2 UCNPs should occur inefficiently. However, the energy gap between the ground and excited states (2F5/2 and 2F7/2) of Ce3+ ions is about 3000 cm−1, which matches well with the value of energy gap of the above two NR processes. This results in a fact that these two NR processes are replaced by the following two CR processes: 5S2/5F4(Ho3+) + 2F5/2(Ce3+) → 5F5(Ho3+) + 2F7/2(Ce3+) (CR1) and 5I6(Ho3+) + 2F5/2(Ce3+) → 5I7(Ho3+) + 2F7/2(Ce3+) (CR2). Hence, the introduction of Ce3+ ions into CaF2:Yb3+/Ho3+ UCNPs would significantly change the NR probability. These two CR processes result in the population of red emitting level 5F5 and its intermediate level 5I7, together with the depopulation of green emitting level 5S2/5F4 and its intermediate level 5I6. Thus, the efficient CR processes contribute to the remarkable enhancement of red emission and the suppressed green emission.
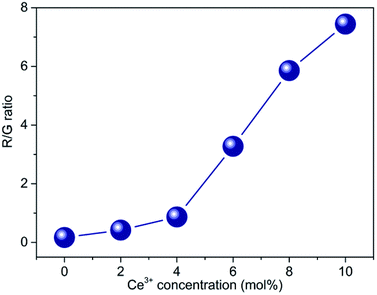 | ||
| Fig. 4 The R/G ratio of CaF2:Yb3+/Ho3+ UCNPs doped with different Ce3+ concentrations (0–10 mol%). (R and G represent red and green UC emissions, respectively.) | ||
Fig. 5(b) displays the dependence of the red and green UC emission as a function of the pump density. Generally, the number of photons required for UC emission is determined by the following formula: I ∝ Pn, where I represents the UC emission intensity, P is pump power density, and n is the number of photons required for UCL. Thus, the slope of the plot of UC emission intensity as a function of pump density determines the number n in the logarithmic coordinate. In Fig. 5(b), the slopes of green and red UC emissions are all close to 2. It suggests that the red and green UC emissions of these two samples are both two-photon processes. Noted that the number of photons required for green and red emissions of CaF2:Yb3+/Ho3+/Ce3+ UCNPs is slightly lower than those of CaF2:Yb3+/Ho3+ counterparts. This is attributed to the fact that the population of intermediate level of the red UC emission in CaF2:Yb3+/Ho3+ is cancelled in CaF2:Yb3+/Ho3+ doped with 10 mol% Ce3+ ions due to the quenching of the green UC emission.
As illustrated in Fig. 5(c), the decay curves of green UC emission for Ce3+-free and 10 mol% Ce3+ doped CaF2:Yb3+/Ho3+ UCNPs are performed under the excitation of 980 nm pulsed laser. The lifetime of the green UC emission was measured to be 127.1 and 108.0 μs for the UCNPs doping with 0 and 10 mol% Ce3+ ions, respectively. The decrease of lifetime confirms the existence of the CR1 process. Fig. 5(d) shows the NIR emission (1187 nm, attributed to the transition of 5I6 → 5I8 of Ho3+ ions) spectra of CaF2:Yb3+/Ho3+ UCNPs doping with different concentrations of Ce3+ ions (0, 4 and 10 mol%). It can be found that the NIR emission intensity decreases as the doped Ce3+ ions increase, verifying the occurrence of CR2 process. As discussed above, the addition of Ce3+ ions in Yb3+/Ho3+ codoped materials will lead to the occurrence of CR1 and CR2 processes between the Ce3+ and Ho3+ ions, resulting in the enhancing red and suppressing green UC emissions.
4. Conclusions
In conclusion, CaF2:Yb3+/Ho3+ (20/2 mol%) UCNPs codoped with different concentrations of Ce3+ ions were successfully synthesized by a simple hydrothermal method. Size manipulation was achieved in the CaF2:Yb3+/Ho3+ UCNPs by doping with different concentrations of Ce3+ ions. In addition, the introduction of Ce3+ ion can greatly suppress the green and enhance the red UC emission, resulting in the luminescence color changing from green to red. The R/G ratios can be varied from 0.17 to 7.44 as the doped Ce3+ ions increase from 0 to 10 mol%. The mechanism of the enhancement of red emission has also been demonstrated based on the two CR processes between Ho3+ and Ce3+ ions, which was supported by the time-resolved decay curves and NIR emissions. The tunability of multicolor and enhancement of red emission make these UCNPs suitable for applications in bioimaging and color display.Conflicts of interest
There are no conflicts to declare.Acknowledgements
We would like to gratefully acknowledge the financial support from the State Key Laboratory of Laser Interaction with Matter Foundation (SKLLIM1708).Notes and references
- Y. Liu, Y. Lu, X. Yang, X. Zheng, S. Wen, F. Wang, X. Vidal, J. Zhao, D. Liu, Z. Zhou, C. Ma, J. Zhou, J. A. Piper, P. Xi and D. Y. Jin, Nature, 2017, 543, 229–233 CrossRef CAS PubMed.
- B. Zhou, B. Y. Shi, D. Y. Jin and X. G. Liu, Nat. Nanotechnol., 2015, 10, 924–936 CrossRef CAS PubMed.
- F. Wang, Y. Han, C. S. Lim, Y. H. Lu, J. Wang, J. Xu, H. Y. Chen, C. Zhang, M. H. Hong and X. G. Liu, Nature, 2010, 463, 1061–1065 CrossRef CAS PubMed.
- Q. Liu, Y. Sun, T. Yang, W. Feng, C. Li and F. Li, J. Am. Chem. Soc., 2011, 133, 17122–17125 CrossRef CAS PubMed.
- J. Zhou, Z. Liu and F. Li, Chem. Soc. Rev., 2012, 41, 1323–1349 RSC.
- E. M. Dianov, Light: Sci. Appl., 2012, 1, e12 CrossRef.
- Y. Han, H. Li, Y. Wang, Y. Pan, L. Huang, F. Song and W. Huang, Sci. Rep., 2017, 7, 1320 CrossRef PubMed.
- W. Zou, C. Visser, J. A. Maduro, M. S. Pshenichnikov and J. C. Hummelen, Nat. Photonics, 2012, 560–564 CrossRef CAS.
- G. B. Shan and G. P. Demopoulos, Adv. Mater., 2010, 22, 4373–4377 CrossRef CAS PubMed.
- C. Wang, L. Cheng and Z. Liu, Biomaterials, 2011, 32, 1110–1120 CrossRef CAS PubMed.
- G. Tian, Z. Gu, L. Zhou, W. Yin, X. Liu, L. Yan, S. Jin, W. Ren, G. Xing, S. Li and Y. Zhao, Adv. Mater., 2012, 24, 1226–1231 CrossRef CAS PubMed.
- J. J. Zhou, J. Y. Deng, H. M. Zhu, X. Y. Chen, Y. Teng, H. Jia, S. Q. Xu and J. R. Qiu, J. Mater. Chem. C, 2013, 1, 8023–8027 RSC.
- F. Wang and X. G. Liu, J. Am. Chem. Soc., 2008, 130, 5642–5643 CrossRef CAS PubMed.
- F. Wang and X. G. Liu, Chem. Soc. Rev., 2009, 38, 976–989 RSC.
- Y. Zhang, L. Huang and X. Liu, Angew. Chem., Int. Ed., 2016, 55, 5718–5722 CrossRef CAS PubMed.
- B. Chen, W. Kong, Y. Liu, Y. Lu, M. Li, X. Qiao, X. Fan and F. Wang, Angew. Chem., Int. Ed., 2017, 129, 10519–10523 CrossRef.
- F. Wang and X. G. Liu, Acc. Chem. Res., 2014, 47, 1378–1385 CrossRef CAS PubMed.
- J. Tang, L. Chen, J. Li, Z. Wang, J. H. Zhang, L. G. Zhang, Y. S. Luo and X. J. Wang, Nanoscale, 2015, 7, 14752–14759 RSC.
- J. Wang, F. Wang, C. Wang, Z. Liu and X. Liu, Angew. Chem., Int. Ed., 2011, 50, 10369–10372 CrossRef CAS PubMed.
- W. Gao, R. B. Wang, Q. Y. Han, J. Dong, L. X. Yan and H. R. Zheng, J. Phys. Chem. C, 2015, 119, 2349–2355 CAS.
- X. F. Yu, L. D. Chen, M. Li, M. Y. Xie, L. Zhou, Y. Li and Q. Q. Wang, Adv. Mater., 2008, 20, 4118–4123 CrossRef CAS.
- J. C. Boyer, C. J. Carling, B. D. Gates and N. R. Branda, J. Am. Chem. Soc., 2010, 132, 15766–15772 CrossRef CAS PubMed.
- R. Deng, F. Qin, R. Chen, W. Huang, M. Hong and X. Liu, Nat. Nanotechnol., 2015, 10, 237–242 CrossRef CAS PubMed.
- H. Wen, H. Zhu, X. Chen, T. F. Hung, B. Wang, G. Zhu, S. F. Yu and F. Wang, Angew. Chem., Int. Ed., 2013, 52, 13419–13423 CrossRef CAS PubMed.
- D. D. Li, Q. Y. Shao, Y. Dong, F. Fang and J. Q. Jiang, Part. Part. Syst. Charact., 2015, 32, 728–733 CrossRef CAS.
- Z. T. Chen, E. H. Song, M. Wu, S. Ding, S. Ye and Q. Y. Zhang, J. Alloys Compd., 2016, 667, 134–140 CrossRef CAS.
- H. Guo, N. Dong, M. Yin, W. Zhang, L. Lou and S. Xia, J. Phys. Chem. B, 2004, 108, 19205–19209 CrossRef CAS.
- H. Guo and Y. M. Qiao, Opt. Mater., 2009, 31, 583–589 CrossRef CAS.
- D. Peng, Q. Ju, X. Chen, R. Ma, B. Chen, G. Bai, J. Hao, X. Qiao, X. Fan and F. Wang, Chem. Mater., 2015, 27, 3115–3120 CrossRef CAS.
- Y. Li, G. F. Wang, K. Pan, N. Y. Fan, S. Liu and L. Feng, RSC Adv., 2013, 3, 1683–1686 RSC.
- K. L. Reddy, V. Srinivas, K. R. Shankar, S. Kumar, V. Sharma, A. Kumar, A. Bahuguna, K. Bhattacharyya and V. Krishnan, J. Phys. Chem. C, 2017, 121, 11783–11793 CrossRef.
- G. Chen, H. Liu, G. Somesfalean, H. Liang and Z. Zhang, Nanotechnology, 2009, 20, 385704 CrossRef PubMed.
- T. Pang and J. Wang, Mater. Res. Express, 2018, 5, 015049 CrossRef.
- W. Gao, J. Dong, J. Liu and X. Yan, Mater. Res. Bull., 2016, 80, 256–262 CrossRef CAS.
- W. Gao, J. Dong, X. Yan, L. Liu, J. Liu and W. Zhang, J. Lumin., 2017, 192, 513–519 CrossRef CAS.
- T. Li, C. Guo, H. Suo and P. Zhao, J. Mater. Chem. C, 2016, 4, 1964–1971 RSC.
- F. Hu, J. Zhang, O. Giraldo, W. Song, R. Wei, M. Yin and H. Guo, J. Lumin., 2018, 201, 493–499 CrossRef CAS.
- G. Wang, Q. Peng and Y. Li, J. Am. Chem. Soc., 2009, 131, 14200–14201 CrossRef CAS PubMed.
- R. Wang, M. Yuan, C. Zhang, H. Wang and X. Xu, Opt. Mater., 2018, 79, 403–407 CrossRef CAS.
- X. Deng, Y. Dai, J. Liu, Y. Zhou, P. Ma, Z. Cheng, Y. Chen, K. Deng, X. Li, Z. Hou, C. Li and J. Lin, Biomaterials, 2015, 50, 154–163 CrossRef CAS PubMed.
- S. Zeng, Z. Yi, W. Lu, C. Qian, H. Wang, L. Rao, T. Zeng, H. Liu, B. Fei and J. Hao, Adv. Funct. Mater., 2014, 24, 4051–4059 CrossRef CAS.
- X. Zhao and M. C. Tan, J. Mater. Chem. C, 2015, 3, 10207–10214 RSC.
| This journal is © The Royal Society of Chemistry 2019 |

