DOI:
10.1039/C9RA04654B
(Paper)
RSC Adv., 2019,
9, 31133-31149
Properties and degradation of castor oil-based fluoridated biopolyurethanes with different lengths of fluorinated segments
Received
21st June 2019
, Accepted 9th September 2019
First published on 2nd October 2019
Abstract
To develop a durable, biodegradable polymer, this study successfully synthesized a castor-oil-based prepolymer by using methylene diphenyl diisocyanate as a hard segment, polycaprolactone as a soft segment, and castor oil as a functional monomer. We added perfluorinated alkyl segments with varying chain lengths into the castor-oil-based polymer to synthesize castor-oil-based fluoridated biopolyurethanes (FCOPUs) with different fluorinated segment lengths. The castor-oil-based polyurethanes with different fluorinated segment lengths had similar molecular weights, which enabled accurate analysis of the effect of the lengths of fluorinated segments on FCOPUs. Nuclear magnetic resonance (NMR) was used to perform 1H NMR, 19F NMR, 19F–19F COSY, 1H–19F COSY, and HMBC analyses on the FCOPU structures. The results of Fourier transform infrared spectroscopy and X-ray photoelectron spectroscopy curve fitting verified the interaction between C–F⋯H–N and C–F⋯C![[double bond, length as m-dash]](https://www.rsc.org/images/entities/char_e001.gif) O. This interaction increased as the fluorinated segments became longer. Regarding the thermal properties of the FCOPUs, the thermogravimetric analysis, differential scanning calorimetry, and dynamic mechanical analysis results revealed that long fluorinated segments were associated with increased thermal stability in the FCOPUs. The atomic force microscopy and tensile strength test suggested that long fluorinated segments contained in the FCOPUs increased the degree of phase separation and tensile strength in FCOPUs. Finally, we dipped the FCOPUs in a 3 wt% NaOH solution, calculated the weight loss of the FCOPUs, and observed their surface structure by using scanning electron microscopy.
O. This interaction increased as the fluorinated segments became longer. Regarding the thermal properties of the FCOPUs, the thermogravimetric analysis, differential scanning calorimetry, and dynamic mechanical analysis results revealed that long fluorinated segments were associated with increased thermal stability in the FCOPUs. The atomic force microscopy and tensile strength test suggested that long fluorinated segments contained in the FCOPUs increased the degree of phase separation and tensile strength in FCOPUs. Finally, we dipped the FCOPUs in a 3 wt% NaOH solution, calculated the weight loss of the FCOPUs, and observed their surface structure by using scanning electron microscopy.
1. Introduction
Since the 1950s, human beings have produced approximately 8.3 billion tons of plastics, most of which do not biodegrade in the environment; with increasing environmental awareness, people have become more aware of the damaging effects of plastics on the environment.1,2 Accordingly, degradable polymers have been widely studied, including polylactic acid (PLA),3 polyhydroxybutyrate (PHB),4 petroleum-based polymers (e.g., polycaprolactone [PCL] and poly[butylene] succinate [PBS]),5–7 and vegetable oils. Even though degradable polymers might appear to be ideal from an environmental perspective, the durability of degradable polymers requires further examination.8 Vegetable oils are renewable, low-cost, and chemically modifiable resources.9 Castor oil (CO) is a vegetable oil that is extracted from castor beans, contains three hydroxyl groups, can be used as a bifunctional monomer, and thus has been applied in preparing various biodegradable polymers.10,11
Thermoplastic polyurethane (PU) is a block copolymer that is often synthesized with diol (soft segment), diisocyanate (hard segment), and chain extenders.12,13 The incompatibility between soft and hard segments leads to microphase separation, and the level of microphase separation is closely related to the tensile strength of PU.14,15 Studies have discussed factors causing microphase separation in PU, such as hydrogen bonds (HBs)16,17 and the ratio of soft and hard segments.18,19 Thermoplastic PU exhibits high strength, toughness, and wearability, and has properties of both plastics and elastomers;20,21 thus it can be used in various industries. Accordingly, the present study focused on biodegradable PU. Relevant studies have used castor oil as the soft segment of PU,22–25 but the crosslink effect of castor oil leads to excessive stiffness of castor-oil-based PU, which decreases the ductility of conventional PU. A scholar used castor oil and PCL as the soft segment of castor-oil-based PU to maintain its ductility.26 A paper examined the degradability of PCL in acid and alkaline environments and revealed that PCL showed higher degradability in an alkaline solution than in an acid solution.27 Therefore, the present study was aimed at increasing the alkaline resistance of PCL-based polyurethane. The known interchain interactions of organofluorines were π–πF, C–F⋯H, F⋯F, C–F⋯πF, C–F⋯π, C–F⋯M+, C–F⋯C![[double bond, length as m-dash]](https://www.rsc.org/images/entities/char_e001.gif) O and anion–πF.28 So, when the organofluorines were introduced to polyurethane, due to these interchain interactions could increase the amount of PCL-based polyurethane intermolecular force, so that the molecular segment was more stable. The present study used castor oil and PCL as the soft segment of PU, used a fluorinated chain extender to strengthen the interactions in PU, and aimed to increase the alkaline resistance of PCL and increase the durability of biodegradable PU. A study revealed that high fluorine content in PU indicated a high level of microphase separation of PU, and elevated tensile strength.29 Most relevant studies have examined fluorinated PU by changing the content of fluorinated chain extenders; changing the ratio of soft segment content to fluorinated chain extender content may result in different ratios of soft segments to hard segments, which may affect the properties of PU.30 To our knowledge, no research has discussed, with a constant R value (NCO
O and anion–πF.28 So, when the organofluorines were introduced to polyurethane, due to these interchain interactions could increase the amount of PCL-based polyurethane intermolecular force, so that the molecular segment was more stable. The present study used castor oil and PCL as the soft segment of PU, used a fluorinated chain extender to strengthen the interactions in PU, and aimed to increase the alkaline resistance of PCL and increase the durability of biodegradable PU. A study revealed that high fluorine content in PU indicated a high level of microphase separation of PU, and elevated tensile strength.29 Most relevant studies have examined fluorinated PU by changing the content of fluorinated chain extenders; changing the ratio of soft segment content to fluorinated chain extender content may result in different ratios of soft segments to hard segments, which may affect the properties of PU.30 To our knowledge, no research has discussed, with a constant R value (NCO![[thin space (1/6-em)]](https://www.rsc.org/images/entities/char_2009.gif) :
:![[thin space (1/6-em)]](https://www.rsc.org/images/entities/char_2009.gif) OH), the influence of fluorine on PU; therefore, the present study changed the chain length of a fluorinated chain extender to investigate the effect of such length on PU.
OH), the influence of fluorine on PU; therefore, the present study changed the chain length of a fluorinated chain extender to investigate the effect of such length on PU.
This study synthesized castor-oil-based fluoridated biopolyurethanes (FCOPUs) of varying chain lengths by using perfluorinated alkyl chains of varying lengths as the chain extender, methylene diphenyl diisocyanate (MDI) as the hard segment, PCL as the soft segment, and castor oil as the functional monomer. Moreover, we investigated the variance of molecular weight variance of FCOPUs by using gel permeation chromatography and examined the thermal properties of FCOPUs by using the thermogravimetric analysis (TGA), differential scanning calorimetry (DSC), and dynamic mechanical analysis (DMA). Furthermore, Fourier transform infrared spectroscopy (FTIR), X-ray photoelectron spectroscopy (XPS) were used to observe the changes of interactions in FCOPUs, their structures were confirmed through nuclear magnetic resonance (NMR), and a tensile testing machine and atomic force microscopy (AFM) were used to discuss the tensile strength and phase separation of FCOPUs. Finally, we dipped the FCOPUs in a NaOH solution to first calculate the weight loss of the FCOPUs and then observe the details of surface structure using scanning electron microscopy (SEM).
2. Experimental
2.1 Materials
2,2,3,3,4,4,5,5-Octafluoro-1,6-hexanediol, 2,2,3,3,4,4,5,5,6,6,7,7-dodecafluoro-1,8-octanediol and 2,2,3,3,4,4,5,5,6,6,7,7,8,8,9,9-hexadecafluoro-1,10-decanediol were purchased from Matrix Scientific. 4,4′-Diphenylmethane diisocyanate (MDI), polycaprolactone diol (PCL, Mw = 530), and dibutyltin dilaurate (DBTDL) were purchased from Aldrich. N,N-dimethylacetamide (DMAc) was obtained from Mallinckrodt Chemicals. Castor oil (CO) was purchase from Alfa Aesar.
2.2 Synthesis of FCOPUs
A two-step process was used to polymerize the FCOPUs. First, MDI, PCL, castor oil and N,N-dimethylacetamide (DMAc) were added to a 500 mL four-neck reaction flask and heated to 80 °C using a heating mantle. After 2 to 3 drops of dibutyltin dilaurate were added, the solution was mixed using a mechanical stirrer at 10 rpm, and PU prepolymers were formed after 2 h of reaction. In the second step, the chain extenders were dissolved in DMAc and slowly dripped into the reaction flask, and the reaction was continued for 2 h (Scheme 1). The obtained FCOPUs solution was subjected to vacuum defoaming for 2 h, after which it was poured into a serum bottle and stored in a refrigerator for 1 day. Finally, the FCOPUs solution was poured into a Teflon plate and dried in a temperature-programmable circulating oven for 8 h. The formula, symbols, and contents of the hard and soft segments for the FCOPUs films are shown in Table 1. The contents of the hard and soft segments were calculated according to eqn (2.1) and (2.2).| |  | (2.1) |
| | | Soft segment content (wt%) = 100% − hard segment content (wt%) | (2.2) |
Whard:weight of MDI, Wsoft:weight of PCL and castor oil, Wextender:weight of extender.
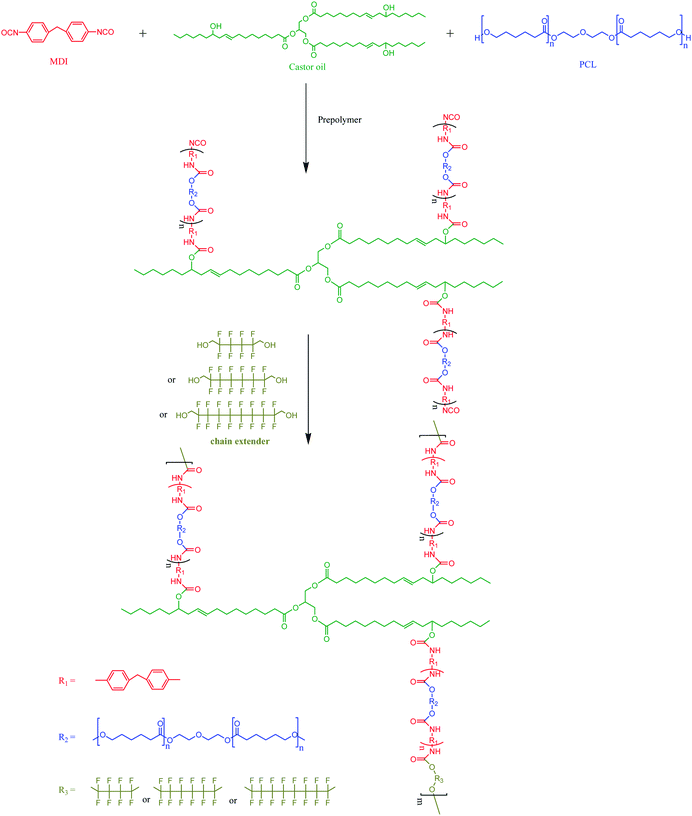 |
| | Scheme 1 Formula for the FCOPUs. | |
Table 1 Formulas of the FCOPUs
| Designation |
MDI (mole) |
CO (mole) |
PCL (mole) |
Extender (mole) |
Hard segment (wt%) |
Soft segment (wt%) |
| 8FCOPU |
4 |
0.4 |
3.2 |
0.2 |
33.73 |
66.27 |
| 12FCOPU |
4 |
0.4 |
3.2 |
0.2 |
34.16 |
65.84 |
| 16FCOPU |
4 |
0.4 |
3.2 |
0.2 |
34.57 |
65.43 |
In this study, the sample names of the FCOPUs were coded as #FCOPU, where “#” refers to the number of fluorine elements in extender, e.g., 12FCOPU. In order to evaluate the influence of fluorinated chain in FCOPUs on degradability, we prepared the control polymer additionally. The purpose of this formula was to replace the amount of fluorinated chain extender by PCL, the whole NCO![[thin space (1/6-em)]](https://www.rsc.org/images/entities/char_2009.gif) :
:![[thin space (1/6-em)]](https://www.rsc.org/images/entities/char_2009.gif) OH was still 1
OH was still 1![[thin space (1/6-em)]](https://www.rsc.org/images/entities/char_2009.gif) :
:![[thin space (1/6-em)]](https://www.rsc.org/images/entities/char_2009.gif) 1.
1.
2.3 Gel permeation chromatography (GPC)
Gel permeation chromatography (GPC) was carried in THF solution using polystyrene standards for calibration with Waters ACQUITY APC with 1 × ACQUITY APC XT 200 + 1 × ACQUITY APC XT 450 columns using a ACQUITY refractive index detector. The flow rate is set as a 0.8 mL min−1 in 45 °C.
2.4 Fourier transform infrared spectroscopy (FTIR)
Fourier transform infrared spectroscopy measurements were performed on a Digilab (Hopkinton, MA, USA) (model (FTS-1000)). The spectra of the samples were obtained by averaging 16 scans in a range of 4000 to 650 cm−1 with a resolution of 2 cm−1.
2.5
1H nuclear magnetic resonance (NMR) spectrometer
The 1H NMR (in DMSO-d6) spectra of the specimens were measured by a Bruker Avance 300 spectrometer (300 MHz).
2.6
19F NMR spectrometer
The 19F NMR spectra of the polymers were recorded using a Bruker Avance IIIHD 400 Hz spectrometer using DMSO-d6 as a solvent and tetramethylsilane as an internal standard.
2.7 X-ray photoelectron spectroscopy (XPS)
The X-ray photoelectron spectroscopy (XPS) measurements were carried out using a Thermo Fisher Scientific (VGS) spectrometer (Waltham, MA, USA). An Al Kα anode was used as the X-ray source (1486.6 eV), and a binding energy range of 0 to 1400 eV was selected for the analysis. The binding energies were calibrated to the C 1s internal standard with a peak at 284.8 eV. The high resolution C 1s spectra were decomposed by fitting a Gaussian function to an experimental curve using a nonlinear regression.
2.8 Surface roughness analysis
Scanning was performed using a Bruker Dimension Icon atomic force microscope, which is generally operated in two imaging modes: tapping and contact. The tapping mode was used in this study, and the tip of the oscillation probe cantilever made only intermittent contact with the sample. Regarding the phase of the sine wave that drives the cantilever, the phase of the tip oscillation is extremely sensitive to various sample surface characteristics; therefore, the topography and phase images of a sample's surface can be detected.
2.9 Thermogravimetric analysis (TGA)
Thermogravimetric analysis was performed on a TA instruments Q-500 (New Castle, DE, USA). The samples (5–8 mg) were heated from room temperature to 700 °C under nitrogen at a rate of 10°C min−1.
2.10 Differential scanning calorimetry (DSC)
Differential scanning calorimetry was performed on a PerkinElmer differential scanning calorimetry (model DSC 6000). The samples were sealed in aluminum pans with a perforated lid. The scans (−50 to 50 °C) were performed at a heating rate of 10°C min−1 under nitrogen purging. The glass transition temperatures (Tg) were located as the midpoints of the sharp descent regions in the recorded curves. The melting points were recorded as the peak maximum of the endothermic transition in the second scan. Approximately 5–8 mg of the samples were used in all of the tests.
2.11 Dynamic mechanical analysis (DMA)
Dynamic mechanical analysis was performed on DMA Q800 machine (TA Instruments) at 1 Hz with a 5 μm amplitude over a temperature range of −50 to 50 °C at a heating rate of 3°C min−1. Specimens with dimensions of 35.6 × 12.7 × 2 mm3 were used in these tests. The dynamic glass transition temperature was taken as the peak temperature of the glass transition region in the tan![[thin space (1/6-em)]](https://www.rsc.org/images/entities/char_2009.gif) δ curve.
δ curve.
2.12 Stress–strain testing
Tensile strength and elongation at break were measured using a universal testing machine (CY-6040A8). Testing was conducted with ASTM D638. The dimension of the film specimen was 45 mm × 8 mm × 0.2 mm.
2.13 Hydrolytic degradation tests
Hydrolytic degradation evaluation of the specimens was conducted in a 3% aqueous NaOH solution at 45 °C. The specimens with dimensions of 2 × 2 cm2 were tested for various days, washed with distilled water and dried completely in a vacuum oven at 70 °C for 3 h. The degree of degradation was determined from the weight loss in eqn (2.3):| |  | (2.3) |
where W0 is the dry weight before degradation, and Wt is the dry weight at time t.
2.14 Morphology analysis
Morphology of the specimens after hydrolytic degradation was observed by using a high resolution Field-Emission Scanning Electron Microscope (FESEM), model JSM-6500F. Specimens of 2 × 2 cm2 were fixed on a sample holder using conductive adhesive tape and were then coated with a thin layer of platinum to improve image resolution. The samples were photographed with 1.00 K magnification.
3. Results and discussion
3.1 Gel permeation chromatography analysis
The gel permeation chromatography curves of the FCOPUs are depicted in Fig. 1; according to the molecular weight distribution results, each of the FCOPUs produced using a chain extender with varying chain lengths exhibits a single peak and does not have any small molecule peaks, indicating complete reaction between the chain extender and the prepolymers. Table 2 presents the calculated molecular weights of FCOPUs and shows that an increased chain length of the fluorinated chain extender is associated with a slightly increased retention time, very often the fluorinated polymers may have interaction with GPC columns which also increased the retention time. Besides, this result of molecular weight might because a long fluorinated chain extender has a large molecular weight, which leads to phenomenon such as decreased activity and increased steric hindrance, thus decreasing the molecular weights of FCOPUs. The molecular weight distribution value (polydispersity index [PDI] = weight − average molecular weight/number − average molecular weight) of all samples were shown to be 1.6, which suggested that the molecular weight distributions of all samples were similar to one another. Specifically, the effect of molecular weight distribution on the properties of FCOPUs would not be substantial in the study's subsequent experiment; such a comparison result among the FCOPUs enhanced our discussion of the effect of chain extender length on FCOPU properties.
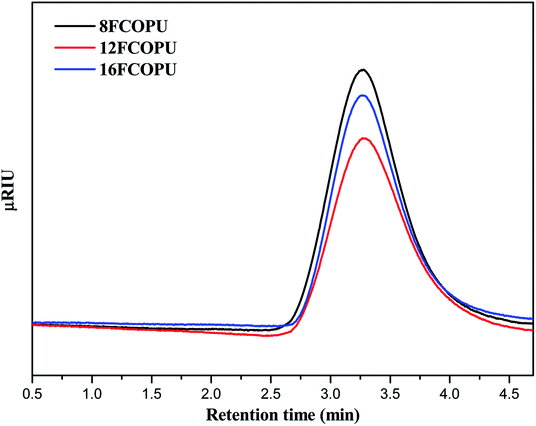 |
| | Fig. 1 GPC curves of the FCOPUs. | |
Table 2 GPC result of FCOPUs
| Sample |
Retention time of the peak (min) |

(×104) |

(×104) |

/
|
| 8FCOPU |
3.28 |
3.10 |
4.92 |
1.59 |
| 12FCOPU |
3.27 |
2.78 |
4.56 |
1.64 |
| 16FCOPU |
3.26 |
2.86 |
4.55 |
1.59 |
3.2 Fluorine-19 NMR
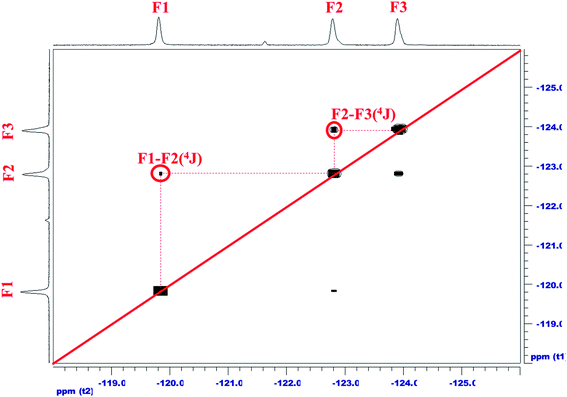
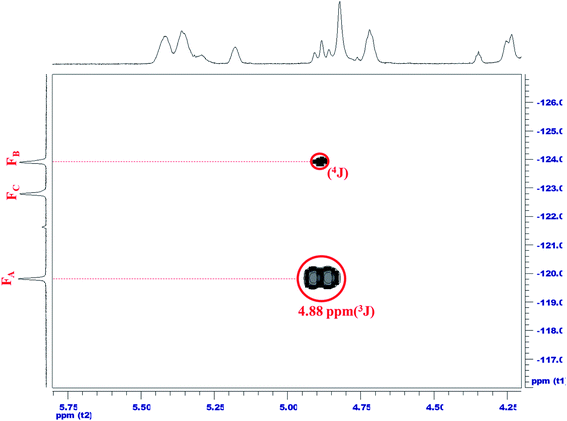
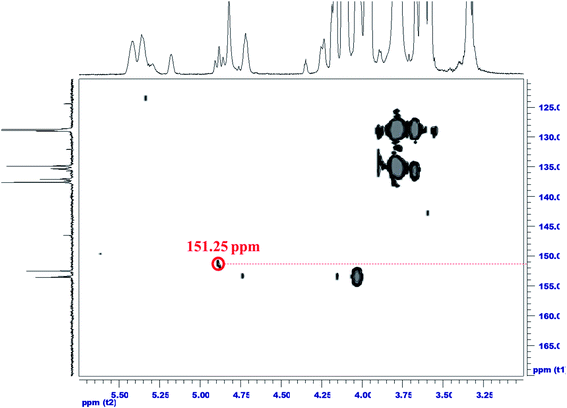
To ensure that fluorinated chain extender was linked to the FCOPUs, the relative positions in a fluorine-19 NMR spectrum must be determined first. This study used the 12FCOPU as the sample for analysis; the fluorinated chain extender for the 12FCOPU contained three different types of symmetric CF2, namely (A) O![[double bond, length as m-dash]](https://www.rsc.org/images/entities/char_e001.gif) C–O–CF2*–CF2, (B) O–CF2–CF2*–CF2, and (C) CF2–CF2–CF2*–CF2. Fig. 2 illustrates the 19F–19F NMR of the 12FCOPU and reveals three absorption peaks at −119.81 ppm, −122.79 ppm, −123.90 ppm in the one-dimensional fluorine NMR spectrum; positions of the three peaks were labeled as 1–3 respectively. To analyze F1–F3 accurately, we analyzed the two strong correlations shown in Fig. 2 (i.e., F1–F2 and F2–F3); previous studies have revealed that 4J(F,F) was stronger than 3J(F,F),31 meaning that a strong coupling exists in 4J(F,F). According to Fig. 2, F–A and F–A′ are most influenced by other elements and are thus labeled as F1, which shows a 4J(F,F) coupling (F1–F2′). Accordingly, F–C and F–C′ are labeled as F2, which shows another 4J(F,F) coupling (F2–F3); therefore, F–B and F–B′ are labeled as F3. The peak at −119.81 ppm (F1) corresponds to F–A and F–A'; the peak at −122.79 ppm (F2 and F2′) corresponds to F–C and F–C'; and the peak at −123.90 ppm (F3) corresponds to F–B and F–B'. The relative positions of fluorine were then confirmed. However, the relative positions did not adequately suggest that the fluorinated chain extender was connected to the PUs; thus, a two-dimensional NMR spectrum analysis was required to confirm the connection. Fig. 3 presents the 1H–19F correlation spectroscopy (COSY) result of the 12FCOPU and shows that the H atoms of the CH2 group in the fluorinated chain extender exhibits a 3J(H,F) coupling with F1 at 4.89 ppm; the H atoms also have a weak 4J(F,F) coupling with F3 at 4.88 ppm. The NMR of the fluorinated chain extender is shown in Fig. 3. Subsequently, Fig. 4 shows the 1H–13C HMBC spectrum of the 12FCOPU. A previous study indicated that the position of O–C
C–O–CF2*–CF2, (B) O–CF2–CF2*–CF2, and (C) CF2–CF2–CF2*–CF2. Fig. 2 illustrates the 19F–19F NMR of the 12FCOPU and reveals three absorption peaks at −119.81 ppm, −122.79 ppm, −123.90 ppm in the one-dimensional fluorine NMR spectrum; positions of the three peaks were labeled as 1–3 respectively. To analyze F1–F3 accurately, we analyzed the two strong correlations shown in Fig. 2 (i.e., F1–F2 and F2–F3); previous studies have revealed that 4J(F,F) was stronger than 3J(F,F),31 meaning that a strong coupling exists in 4J(F,F). According to Fig. 2, F–A and F–A′ are most influenced by other elements and are thus labeled as F1, which shows a 4J(F,F) coupling (F1–F2′). Accordingly, F–C and F–C′ are labeled as F2, which shows another 4J(F,F) coupling (F2–F3); therefore, F–B and F–B′ are labeled as F3. The peak at −119.81 ppm (F1) corresponds to F–A and F–A'; the peak at −122.79 ppm (F2 and F2′) corresponds to F–C and F–C'; and the peak at −123.90 ppm (F3) corresponds to F–B and F–B'. The relative positions of fluorine were then confirmed. However, the relative positions did not adequately suggest that the fluorinated chain extender was connected to the PUs; thus, a two-dimensional NMR spectrum analysis was required to confirm the connection. Fig. 3 presents the 1H–19F correlation spectroscopy (COSY) result of the 12FCOPU and shows that the H atoms of the CH2 group in the fluorinated chain extender exhibits a 3J(H,F) coupling with F1 at 4.89 ppm; the H atoms also have a weak 4J(F,F) coupling with F3 at 4.88 ppm. The NMR of the fluorinated chain extender is shown in Fig. 3. Subsequently, Fig. 4 shows the 1H–13C HMBC spectrum of the 12FCOPU. A previous study indicated that the position of O–C![[double bond, length as m-dash]](https://www.rsc.org/images/entities/char_e001.gif) O in PU was at approximately 153 ppm.32 With the position of C
O in PU was at approximately 153 ppm.32 With the position of C![[double bond, length as m-dash]](https://www.rsc.org/images/entities/char_e001.gif) O corresponding to the position of H atoms in CH2 at 4.88 ppm, the fluorinated chain extender successfully reacted with MDI to form urethane groups.
O corresponding to the position of H atoms in CH2 at 4.88 ppm, the fluorinated chain extender successfully reacted with MDI to form urethane groups.
 |
| | Fig. 2
19F–19F COSY NMR spectrum of the 12FCOPU. | |
 |
| | Fig. 3
1H–19F COSY NMR of 12FCOPU. | |
 |
| | Fig. 4
1H–13C HMBC NMR of 12FCOPU. | |
3.3 Fourier transform infrared spectroscopy (FTIR)
Fig. 5(a) illustrates the FTIR spectrum of FCOPUs in a wavenumber range of 4000–650 cm−1; the spectrum reveals five main functional peaks of PU in the FCOPUs, namely peaks caused by –NH stretching vibration at 3329.13 cm−1, CH2 stretching vibration at 2927.94 cm−1 and 2858.50 cm−1, C![[double bond, length as m-dash]](https://www.rsc.org/images/entities/char_e001.gif) O stretching vibration at approximately 1724.36 cm−1 (amide I band), –NH bending vibration at 1531.47 cm−1 (amide II band), and stretching vibration of C–F group at 1217.08 cm−1. A peak caused by C–O stretching vibration at 1064.70 cm−1 is also observed. Additionally, the free NCO groups of MDI are not shown in the spectrum in the wavenumber range of 2240–2275 cm−1, indicating that MDI has reacted with the PCL, castor oil, and chain extender completely.
O stretching vibration at approximately 1724.36 cm−1 (amide I band), –NH bending vibration at 1531.47 cm−1 (amide II band), and stretching vibration of C–F group at 1217.08 cm−1. A peak caused by C–O stretching vibration at 1064.70 cm−1 is also observed. Additionally, the free NCO groups of MDI are not shown in the spectrum in the wavenumber range of 2240–2275 cm−1, indicating that MDI has reacted with the PCL, castor oil, and chain extender completely.
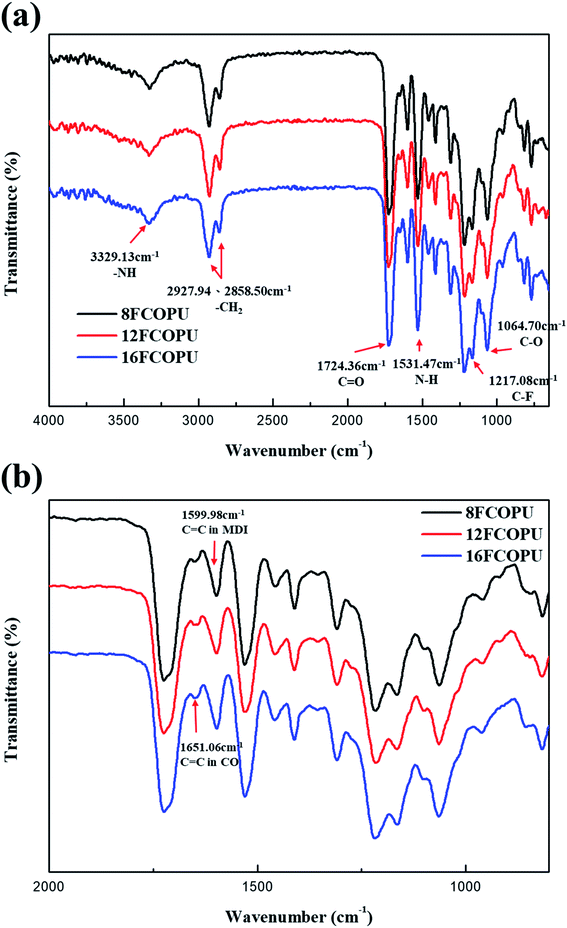 |
| | Fig. 5 FT-IR spectra of the FCOPUs at the wavenumber range of (a) 4000–650 cm−1; (b) 2000–800 cm−1. | |
Fig. 5(b) reveals the absorption peaks in the wavenumber of 2000–650 cm−1. A study verified the existence of hydrogen bonding in PUs with a FTIR; the same study revealed three peak values: C![[double bond, length as m-dash]](https://www.rsc.org/images/entities/char_e001.gif) Ofree, C
Ofree, C![[double bond, length as m-dash]](https://www.rsc.org/images/entities/char_e001.gif) OHB disordered, and C
OHB disordered, and C![[double bond, length as m-dash]](https://www.rsc.org/images/entities/char_e001.gif) OHB ordered, with the peak value of C
OHB ordered, with the peak value of C![[double bond, length as m-dash]](https://www.rsc.org/images/entities/char_e001.gif) OHB ordered observed at approximately 1660 cm−1.33 Another study showed two peak values (free radicals and HBs), in the C–F absorption peak of fluorinated PU;34 the same study calculated the percentage of HBs in fluorinated PU at 1530 cm−1 because no peaks other than a benzene ring stretching vibration peak were observed at this wavenumber. The following equation can be used to verify the existence of hydrogen in PUs:
OHB ordered observed at approximately 1660 cm−1.33 Another study showed two peak values (free radicals and HBs), in the C–F absorption peak of fluorinated PU;34 the same study calculated the percentage of HBs in fluorinated PU at 1530 cm−1 because no peaks other than a benzene ring stretching vibration peak were observed at this wavenumber. The following equation can be used to verify the existence of hydrogen in PUs:
| |  | (2.4) |
where
IH is the strength of HBs,
Ifree refers to the strength of bonds in free radicals, and
Iref denotes the absorption intensity at 1534 cm
−1. To explore the influence of the length of fluorinated chain extender on PUs, this study conducted curve fitting at the wavenumber range of 1235–1185 cm
−1 (
Fig. 6). The curve fitting result uncovered the existence of C–O–C, C–F
free, C–F
HB, and C–N absorption peaks in the wavenumber range of 1235–1185 cm
−1. After calculation, we discovered that when the length of the FCOPU was extended from 8FCOPU to 12FCOPU by using the fluorinated chain extender, the ratio of C–F
HB to C–F
free increased from 47.08% to 88.07%; when the length was further extended, such a ratio slightly increased to 93.28%. Accordingly, a longer chain length is more conducive to enhancing hydrogen bonding in FCOPUs.
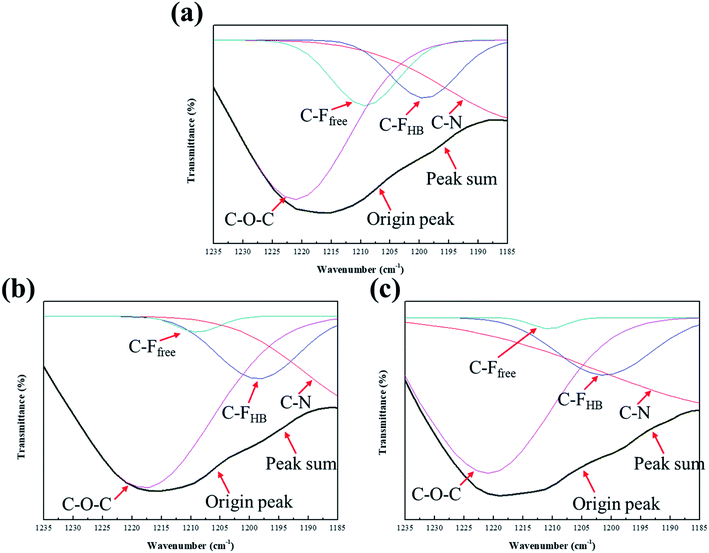 |
| | Fig. 6 FT-IR spectra of (a) 8FCOPU; (b) 12FCOPU; (c) 16FCOPU at the wavenumber range of 1235–1185 cm−1. | |
3.4 X-ray photoelectron spectroscopy (XPS)
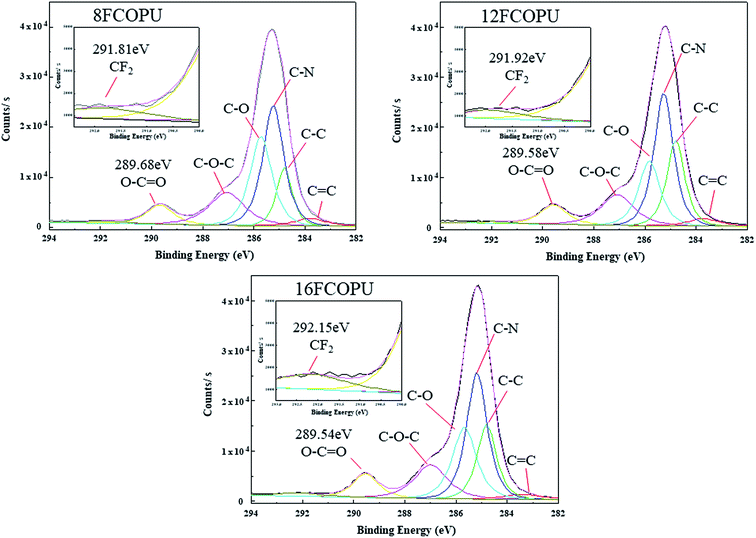
Fig. 7 illustrates the elements and their bonding states in FCOPUs; each of the spectra contains four major peaks, C 1s, O 1s, N 1s, and F 1s and the catalyst, Sn 3d. Table 3 lists our calculated content and the binding energies of elements and shows that the content of fluorine increased from 0.41% to 1.03% with increases in the chain extender's length. A study suggested that in solid PU films, high fluorine content in the PU is relatively conducive to moving fluorinated segments to the surface of the thin film.35 According to the XPS of the FCOPUs, the fluorine content in the surface of 16FCOPUs was 1.03%, despite the theoretical fluorine content being 1.92%; this may have resulted from castor oil with trifunctional groups, which may have formed the crosslinked structure of the FCOPUs, and such a crosslinked structure may inhibit fluorinated segments from moving outward to the film surface.36 Additionally, the results revealed the O 1s binding energies of 8FCOPU, 12FCOPU, and 16FCOPU to be 532.38, 532.17, and 531.87 eV, respectively, implying that the O 1s binding energies decreased slightly with increases in the chain length. Berger et al.37 discussed the interaction of fluorine and revealed the dipole–dipole interaction in C–F⋯C![[double bond, length as m-dash]](https://www.rsc.org/images/entities/char_e001.gif) O, indicating that increases in the length of a fluorinated chain extender might change the molecular interactions in PU films. Therefore, we performed curve fitting on C 1s of the FCOPUs to discuss molecular interactions (Fig. 8). The C 1s curve of the FCOPUs reveals binding energies as follows: C
O, indicating that increases in the length of a fluorinated chain extender might change the molecular interactions in PU films. Therefore, we performed curve fitting on C 1s of the FCOPUs to discuss molecular interactions (Fig. 8). The C 1s curve of the FCOPUs reveals binding energies as follows: C![[double bond, length as m-dash]](https://www.rsc.org/images/entities/char_e001.gif) C (283.7 eV), C–C (284.8 eV), C–N (285.2 eV), C–O (285.7 eV), C–O–C (287.0 eV), O–C
C (283.7 eV), C–C (284.8 eV), C–N (285.2 eV), C–O (285.7 eV), C–O–C (287.0 eV), O–C![[double bond, length as m-dash]](https://www.rsc.org/images/entities/char_e001.gif) O (289.5 eV), and C–F2 (292 eV), these peak positions are consistent with these report.38–40 The results indicated that with an increased length of fluorinated chain extender, the C–F2 binding energy increased from 291.81 to 292.15 eV, and such an increase of energy was contributed by the hydrogen bonding in C–F⋯H–N. Specifically, a longer length of perfluorinated alkyl chains indicated higher content of fluorine in the PUs, thus increasing the number of hydrogen bonding interactions in C–F⋯H–N; this result was consistent with that of the FTIR. The O–C
O (289.5 eV), and C–F2 (292 eV), these peak positions are consistent with these report.38–40 The results indicated that with an increased length of fluorinated chain extender, the C–F2 binding energy increased from 291.81 to 292.15 eV, and such an increase of energy was contributed by the hydrogen bonding in C–F⋯H–N. Specifically, a longer length of perfluorinated alkyl chains indicated higher content of fluorine in the PUs, thus increasing the number of hydrogen bonding interactions in C–F⋯H–N; this result was consistent with that of the FTIR. The O–C![[double bond, length as m-dash]](https://www.rsc.org/images/entities/char_e001.gif) O binding energy decreased slightly from 289.69 to 289.54 eV; such a decrease might be caused by the steric hindrance increasing with the increasing length of the fluorinated chain extender, which disrupted hydrogen bonding in C
O binding energy decreased slightly from 289.69 to 289.54 eV; such a decrease might be caused by the steric hindrance increasing with the increasing length of the fluorinated chain extender, which disrupted hydrogen bonding in C![[double bond, length as m-dash]](https://www.rsc.org/images/entities/char_e001.gif) O⋯N–H, as well as by a dipole–dipole interaction existing in C–F⋯C
O⋯N–H, as well as by a dipole–dipole interaction existing in C–F⋯C![[double bond, length as m-dash]](https://www.rsc.org/images/entities/char_e001.gif) O.30,41
O.30,41
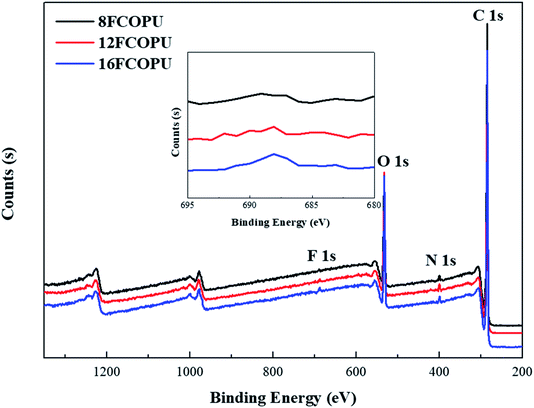 |
| | Fig. 7 XPS survey spectra of the FCOPUs. | |
Table 3 XPS peak characteristics of the FCOPUs
| Sample name |
Content |
Binding energy (eV) |
Atomic ratio (%) |
| 8FCOPU |
C 1s |
284.96 |
82.14 |
| O 1s |
532.38 |
15.82 |
| N 1s |
399.94 |
1.60 |
| F 1s |
687.96 |
0.41 |
| Sn 3d |
491.64 |
0.04 |
| 12FCOPU |
C 1s |
284.60 |
81.22 |
| O 1s |
532.17 |
17.55 |
| N 1s |
399.93 |
0.74 |
| F 1s |
688.8 |
0.45 |
| Sn 3d |
486.97 |
0.04 |
| 16FCOPU |
C 1s |
284.24 |
79.6 |
| O 1s |
531.87 |
17.43 |
| N 1s |
399.52 |
1.89 |
| F 1s |
688.05 |
1.03 |
| Sn 3d |
494.68 |
0.05 |
 |
| | Fig. 8 C 1s fit theory of FCOPUs. | |
3.5 Surface roughness analysis
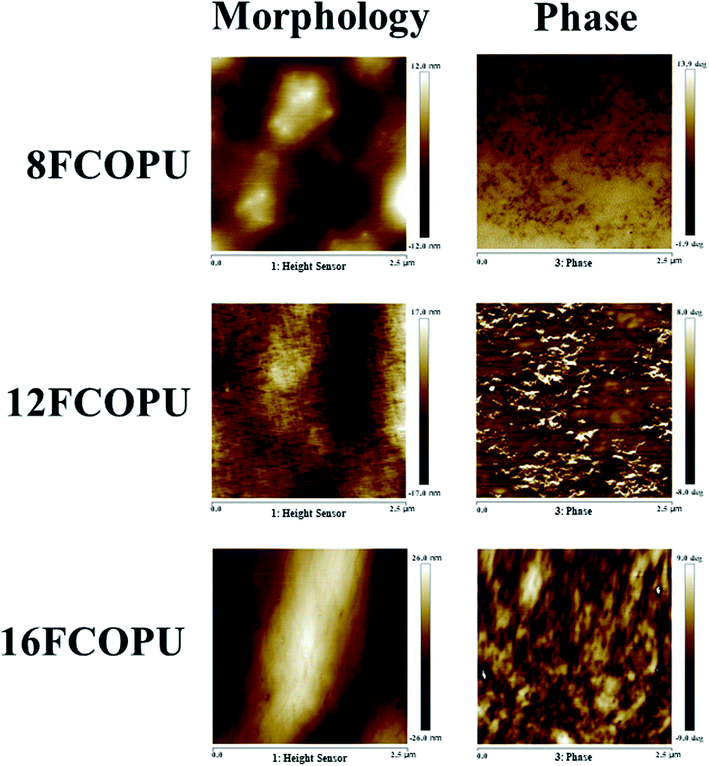
Fig. 9 presents the topography (left) and phase data (right) of 8FCOPU, 12FCOPU, and 16FCOPU. The topography revealed continuous protrusions in FCOPUs. We then calculated the average surface roughness values of 8FCOPU (2.59 nm), 12FCOPU (3.79 nm), and 16FCOPU (4.81 nm), which suggested FCOPUs with long fluorinated chain extenders exhibited rough surfaces and numerous continuous protrusions on the surface. Namely, 16FCOPU had the roughest surface of all the FCOPU samples. The phase data indicated that 8FCOPU exhibited microphase mixing; when the chain length was increased (12FCOPU), microphase separation was observed, and the microphase separation became more distinct when the chain length was further increased (16FCOPU). Specifically, FCOPUs synthesized with longer fluorinated chain extenders exhibited more distinct microphase separation because longer fluorinated chain extenders contained more fluorine. Additionally, the fluorinated chain extender and MDI were used as the hard segments in the FCOPUs, C–F and C![[double bond, length as m-dash]](https://www.rsc.org/images/entities/char_e001.gif) O exhibited interactions, and HBs existed between C–F and N–H; therefore, fluorine in FCOPUs enhanced the interactions between hard segments and thus led to microphase separation. Furthermore, the increased interactions in the polymer resulted in unstable film formation process of FCOPUs, thus leading to increased surface roughness.
O exhibited interactions, and HBs existed between C–F and N–H; therefore, fluorine in FCOPUs enhanced the interactions between hard segments and thus led to microphase separation. Furthermore, the increased interactions in the polymer resulted in unstable film formation process of FCOPUs, thus leading to increased surface roughness.
 |
| | Fig. 9 AFM topographic and phase images of the FCOPUs. | |
3.6 Thermal properties
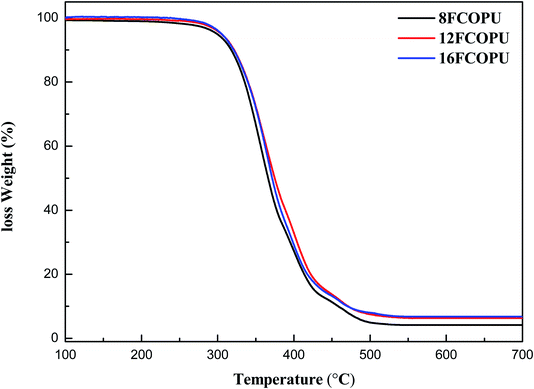
Fig. 10 depicts the TGA curve of the FCOPUs synthesized using fluorinated chain extenders with different lengths. Table 4 presents the onset decomposition temperatures (Tonset) and calculated residual weight at 700 °C and shows the Tonset results of 8FCOPU (319.63 °C), 12FCOPU (321.77 °C), and 16FCOPU (324.80 °C). These results indicated that increased length of CF2 in fluorinated PUs increased the temperature of initial decomposition, which might be attributed to the strong bonding energy of –CF2; moreover, the covalent radius of a fluorine atom is half of the C–C bond length, thus being able to shield the C–C backbone and ensuring the stability of the C–C bond. The result also showed that an increased chain extender length was associated with an increased residual weight at 700 °C; specifically, the residual weight of the FCOPU at 700 °C increased from 4.17% (8FCOPU) to 6.78% (16FCOPU). This result might be caused by the increased number of carbon atoms in the polymer in the process of chain extension, which increased the residual weight at 700 °C.
 |
| | Fig. 10 TGA curves of the FCOPUs. | |
Table 4 Thermal properties of the FCOPUs
| Designation |
TGA |
DSC |
|
T
onset (°C) |
700 °C residue |
T
g (°C) |
T
m (°C) |
| 8FCOPU |
319.6 |
4.2% |
−1.7 |
131.1 |
| 12FCOPU |
321.8 |
6.3% |
0.6 |
135.8 |
| 16FCOPU |
324.8 |
6.8% |
3.5 |
145.1 |
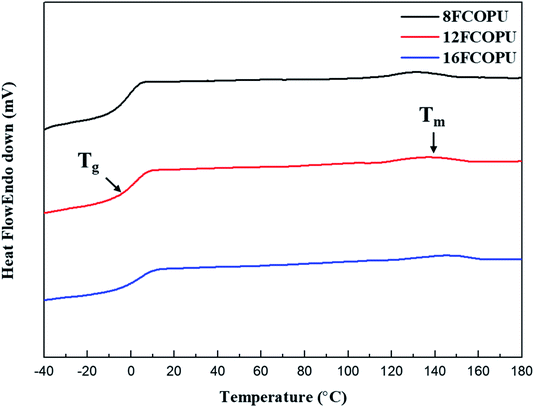
Fig. 11 presents the DSC curve of the FCOPU; Table 4 compiles the Tg and melting temperature (Tm.). The results revealed the Tg of 8FCOPU (−1.66 °C), 12FCOPU (0.63 °C), and 16FCOPU (3.45 °C) and the Tm of 8FCOPU (131.09 °C), 12FCOPU (135.77 °C), and 16FCOPU (145.13 °C), implying that an increased fluorinated chain extender length was associated with increased Tg and Tm. Such increases might be attributed to a long fluorinated chain extender with numerous CF2 groups, which increased interactions in the fluorinated PU, including van der Waals interactions in C–F⋯H–N and C–F⋯C![[double bond, length as m-dash]](https://www.rsc.org/images/entities/char_e001.gif) O. Therefore, the increased degree of physical crosslinking in the polymer chains required increased thermal energy for polymer chain movement, thereby increasing the Tg and Tm. This result was consistent with the XPS and FTIR results; furthermore, the TGA and DSC suggested that increased length of a fluorinated chain extender was conducive to enhancing the thermal stability of fluorinated PUs.
O. Therefore, the increased degree of physical crosslinking in the polymer chains required increased thermal energy for polymer chain movement, thereby increasing the Tg and Tm. This result was consistent with the XPS and FTIR results; furthermore, the TGA and DSC suggested that increased length of a fluorinated chain extender was conducive to enhancing the thermal stability of fluorinated PUs.
 |
| | Fig. 11 DSC thermograms of the FCOPUs. | |
3.7 Dynamic mechanical analysis (DMA)
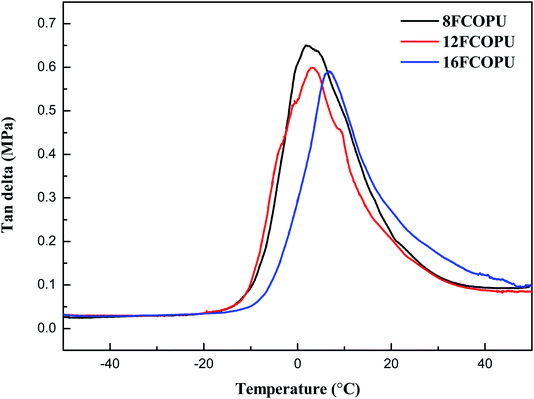
Fig. 12 presents the tan![[thin space (1/6-em)]](https://www.rsc.org/images/entities/char_2009.gif) δ of FCOPUs synthesized using fluorinated chain extenders with different lengths. Dynamic glass transition temperature (Tgd) is defined as the dynamic glass transition temperature of FCOPUs. Table 5 compiles the maximum values of Tgd and tan
δ of FCOPUs synthesized using fluorinated chain extenders with different lengths. Dynamic glass transition temperature (Tgd) is defined as the dynamic glass transition temperature of FCOPUs. Table 5 compiles the maximum values of Tgd and tan![[thin space (1/6-em)]](https://www.rsc.org/images/entities/char_2009.gif) δ; the maximum Tgd values are as follows: 8FCOPU (1.88 °C), 12FCOPU (3.24 °C), and 16FCOPU (6.74 °C). The result indicated that the dynamic glass transition temperature increased with increases in the length of the fluorinated chain extender. Possibly a long fluorinated chain extender contains numerous fluorine atoms, thereby increasing the interactions in FCOPUs, increasing the thermal energy required by polymer chain movement, and improving the thermal stability of the FCOPUs. The result was consistent with that suggested by the TGA and DSC. The maximum values of tan
δ; the maximum Tgd values are as follows: 8FCOPU (1.88 °C), 12FCOPU (3.24 °C), and 16FCOPU (6.74 °C). The result indicated that the dynamic glass transition temperature increased with increases in the length of the fluorinated chain extender. Possibly a long fluorinated chain extender contains numerous fluorine atoms, thereby increasing the interactions in FCOPUs, increasing the thermal energy required by polymer chain movement, and improving the thermal stability of the FCOPUs. The result was consistent with that suggested by the TGA and DSC. The maximum values of tan![[thin space (1/6-em)]](https://www.rsc.org/images/entities/char_2009.gif) δ of FCOPUs were shown to decrease from 0.6503 to 0.5907 with the increased length of the fluorinated chain extender. Possibly numerous fluorine atoms contained in the FCOPUs led to an increased number of physical crosslinks (C–F⋯C
δ of FCOPUs were shown to decrease from 0.6503 to 0.5907 with the increased length of the fluorinated chain extender. Possibly numerous fluorine atoms contained in the FCOPUs led to an increased number of physical crosslinks (C–F⋯C![[double bond, length as m-dash]](https://www.rsc.org/images/entities/char_e001.gif) O and C–F⋯H–N), which in turn resulted in reduced mobility of polymer chains in the FCOPUs. In other words, tan
O and C–F⋯H–N), which in turn resulted in reduced mobility of polymer chains in the FCOPUs. In other words, tan![[thin space (1/6-em)]](https://www.rsc.org/images/entities/char_2009.gif) δ is obtained by dividing E′′ by E′, and therefore the more fluorine is in the FCOPUs, the lower the viscosity is, and the higher the elasticity is. Furthermore, Table 5 reveals the crosslink density of 8FCOPU (0.02249 mol cm−3), 12FCOPU (0.02373 mol cm−3), and 16FCOPU (0.03033 mol cm−3); the result indicated that FCOPUs synthesized by a longer fluorinated chain was associated with an increased crosslink density. This study employed the swelling method and used the Flory–Rehner equation to calculate the crosslink density of FCOPUs. A previous study indicated that crosslink density calculated using the swelling method was the sum of chemical and physical crosslinks.42 Accordingly, because the FCOPUs prepared by the present study all had the same number of chemical crosslinks, we verified that FCOPUs synthesized using long fluorinated chains increased the degree of physical crosslinking and improved the mechanical properties of FCOPUs.
δ is obtained by dividing E′′ by E′, and therefore the more fluorine is in the FCOPUs, the lower the viscosity is, and the higher the elasticity is. Furthermore, Table 5 reveals the crosslink density of 8FCOPU (0.02249 mol cm−3), 12FCOPU (0.02373 mol cm−3), and 16FCOPU (0.03033 mol cm−3); the result indicated that FCOPUs synthesized by a longer fluorinated chain was associated with an increased crosslink density. This study employed the swelling method and used the Flory–Rehner equation to calculate the crosslink density of FCOPUs. A previous study indicated that crosslink density calculated using the swelling method was the sum of chemical and physical crosslinks.42 Accordingly, because the FCOPUs prepared by the present study all had the same number of chemical crosslinks, we verified that FCOPUs synthesized using long fluorinated chains increased the degree of physical crosslinking and improved the mechanical properties of FCOPUs.
 |
| | Fig. 12 DMA tan![[thin space (1/6-em)]](https://www.rsc.org/images/entities/char_2009.gif) δ curves of the FCOPUs. δ curves of the FCOPUs. | |
Table 5 DMA and crosslinking density results of the FCOPUs
| Sample |
T
gd from tan![[thin space (1/6-em)]](https://www.rsc.org/images/entities/char_2009.gif) δ (°C) δ (°C) |
Tan![[thin space (1/6-em)]](https://www.rsc.org/images/entities/char_2009.gif) δmax δmax |
Crosslinking density (mol cm−3) |
| 8FCOPU |
1.9 |
0.650 |
0.02249 |
| 12FCOPU |
3.2 |
0.599 |
0.02373 |
| 16FCOPU |
6.7 |
0.591 |
0.03033 |
3.8 Tensile properties
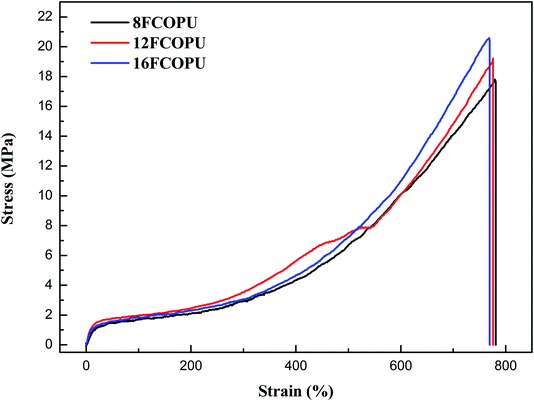
Fig. 13 depicts the stress–strain curve of the FCOPUs synthesized using the fluorinated chain extenders with different lengths; the maximum tensile strength, fracture strain, and Young's modulus are compiled in Table 6. The results (maximum tensile strength/elongation at break) are shown as follows: 8FCOPU (17.967 MPa/779.67%), 12FCOPU (19.226 MPa/775.73%), and 16FCOPU (20.835 MPa/768.2%). According to these figures, the tensile strength of FCOPUs increased with increases in the length of the fluorinated chain extender, which may because an increased number of van der Waals interactions in C–F⋯C![[double bond, length as m-dash]](https://www.rsc.org/images/entities/char_e001.gif) O and C–F⋯H–N produced more physical crosslinks in 18FCOPUs, thereby inhibiting the mobility of polymer chain and maximizing the tensile strength. The Young's moduli of 8FCOPU (0.222 MPa), 12FCOPU (0.243 MPa), and 16FCOPU (0.26 MPa) showed that the longer the fluorinated chain extender used for FCOPU synthesis was, the higher the stiffness of the chain extender was. Specifically, an increased content of fluorine in FCOPUs was associated with increased interactions in FCOPUs; accordingly, the 16FCOPU, compared with the other samples, showed the highest resistance to polymer chain breakage by external force. These mechanical analysis results were consistent with the DMA results.
O and C–F⋯H–N produced more physical crosslinks in 18FCOPUs, thereby inhibiting the mobility of polymer chain and maximizing the tensile strength. The Young's moduli of 8FCOPU (0.222 MPa), 12FCOPU (0.243 MPa), and 16FCOPU (0.26 MPa) showed that the longer the fluorinated chain extender used for FCOPU synthesis was, the higher the stiffness of the chain extender was. Specifically, an increased content of fluorine in FCOPUs was associated with increased interactions in FCOPUs; accordingly, the 16FCOPU, compared with the other samples, showed the highest resistance to polymer chain breakage by external force. These mechanical analysis results were consistent with the DMA results.
 |
| | Fig. 13 Tensile properties of the FCOPUs. | |
Table 6 Tensile properties of the FCOPUs
| Sample |
Tensile strength (MPa) |
Young's modulus (MPa) |
Elongation at break (%) |
| 8FCOPU |
18.0 |
0.22 |
780 |
| 12FCOPU |
19.2 |
0.24 |
771 |
| 16FCOPU |
20.8 |
0.26 |
768 |
3.9 Hydrolytic degradation
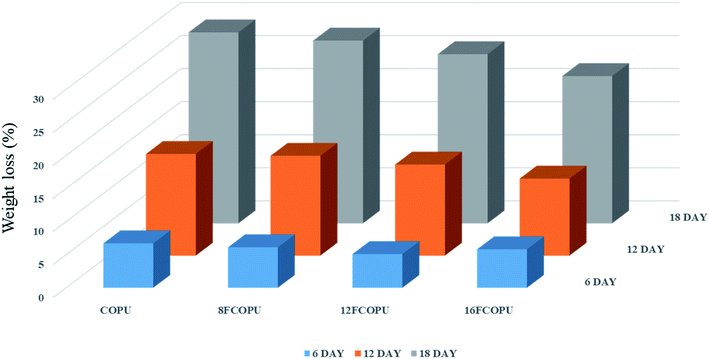
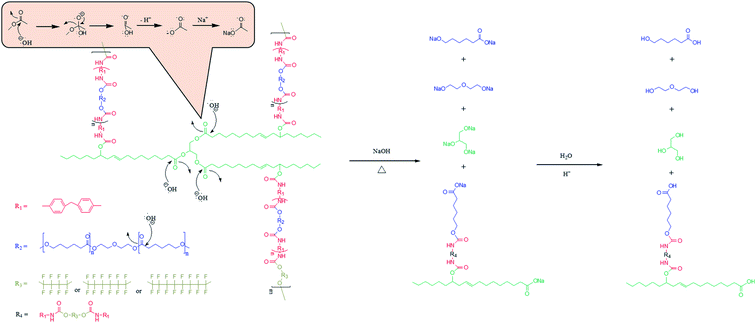
To develop durable degradable materials, this study tested the degradability of FCOPUs and COPU without fluorinated segments in a 3 wt% NaOH solution and recorded the weight losses in Fig. 14. The result suggested that after 18 days of hydrolysis in a 3 wt% NaOH solution, the weight loss of the 16FCOPU (22.28%) was lower than that of the COPU (28.88%). This result was due to the physical crosslinking effect of hard segments, which served as the physical crosslinks in PUs and thus improved the mechanical strength and the physical properties, namely hardness and solvent resistance, of PUs.43 The degradability of PUs was attributed mainly to the O–C![[double bond, length as m-dash]](https://www.rsc.org/images/entities/char_e001.gif) O groups in castor oil and PCL molecules.44 When FCOPUs were dipped in a NaOH solution, OH− attacked O–C
O groups in castor oil and PCL molecules.44 When FCOPUs were dipped in a NaOH solution, OH− attacked O–C![[double bond, length as m-dash]](https://www.rsc.org/images/entities/char_e001.gif) O* to break the double bonds and attached itself to O–C*–O−; subsequently, O− attacked O*–C(OH)–O−, detached the bonds, added electrons to O−, and formed the following degraded form: –OH + HO–C
O* to break the double bonds and attached itself to O–C*–O−; subsequently, O− attacked O*–C(OH)–O−, detached the bonds, added electrons to O−, and formed the following degraded form: –OH + HO–C![[double bond, length as m-dash]](https://www.rsc.org/images/entities/char_e001.gif) O. In an alkaline solution, –COOH and –OH are dehydrogenated to –O− and –COO−; the ionic bonds between the negative electrons and Na+ form –ONa and –COONa, which can be reduced by H2O to –OH and –COOH. In this study, the PCL segments were degraded to 6-hydroxyhexanoic acid and diethylene glycol; the castor oil segments were degraded to glycerol (Fig. 15). With this process repeating continuously, the FCOPU film was degraded in the alkaline solution and started losing weight. This, together with the other analysis results, indicated that high fluorine content in PUs produced numerous physical crosslinks in FCOPUs, which increased the durability of FCOPUs in alkaline solutions.
O. In an alkaline solution, –COOH and –OH are dehydrogenated to –O− and –COO−; the ionic bonds between the negative electrons and Na+ form –ONa and –COONa, which can be reduced by H2O to –OH and –COOH. In this study, the PCL segments were degraded to 6-hydroxyhexanoic acid and diethylene glycol; the castor oil segments were degraded to glycerol (Fig. 15). With this process repeating continuously, the FCOPU film was degraded in the alkaline solution and started losing weight. This, together with the other analysis results, indicated that high fluorine content in PUs produced numerous physical crosslinks in FCOPUs, which increased the durability of FCOPUs in alkaline solutions.
 |
| | Fig. 14 Weight loss of hydrolytic degradation results of the FCOPUs. | |
 |
| | Fig. 15 Degradation mechanism of FCOPUs. | |
3.10 SEM morphology analysis
Fig. 16 presents the FCOPU and COPU surface at different times in the degradation process. For an effective investigation on the effect of the fluorinated chain extender length on the degradation properties of FCOPUs, this study posited that the equivalence of degradable monomers (castor oil and PCL) was identical in all FCOPU samples. The result showed that the surface of COPU still exhibited larger and growing pores, all samples with fluorinated segments showed only minor pores on the surface on the sixth day of degradation. On the 12th day of degradation, FCOPU, 8FCOPU and 12FCOPU exhibited noticeable pores on their surface. On the 18th day of degradation, the pores grew larger. Compared with other samples, after degradation, the surface of COPU still exhibited larger and growing pores, and the 16FCOPU exhibited much smaller pores on its surface on the 6th, 12th, and 18th day of degradation; this might because FCOPUs with a longer fluorinated chain extender contained more physical crosslinks, which created difficulties for alkaline water molecules to diffuse to hydrophobic hard segments or be retained in the fluorous phase, thus effectively preventing FCOPU degradation by the NaOH solution. Moreover, the degradation process of the FCOPUs started from the outer layer and gradually toward the inner layer of PUs, without producing any cracks. The result suggested that the FCOPU film stayed undamaged during the entire degradation process until it was degraded completely by the NaOH solution and verified the potential of the FCOPUs prepared by this study regarding their durability and degradability. Table 7 shows comparison of FCOPUs degradation with previously reported PCL-based or castor oil-based polyurethane with fluorinated segments (or not). It was instructed first that the degradation rate of PCL was higher in base environment than that in acid environment.27 It was reported when the fluorine element was introduced into polyurethane, and the degradation stability could be increased significantly.45 In the previous report of our laboratory, it was reported that it showed as for linear PCL-based polyurethane with fluorinated segments, after PU/OFHD was immersed in 3 wt% NaOH at 45 °C for 18 days, its weight loss was about 9–15% with the generation of crack. It was lower than the weight loss 22% for 16FCOPU in this study. It might be influenced by the existence of castor oil. Compared to PCL, the degradation rate of castor oil is much higher at base environment. As Li et al. reported when castor oil was used as polyurethane soft segment which was immersed in 1 wt% NaOH at 45 °C and degraded for 0.5 days, the weight loss was as high as 21%. The surface structure of castor oil-based WPU was become the pore without crack.47 This appearance was similar to FCOPUs. So, it could be speculated that after the sample of this study was degraded, the generation of pore structure was attributable to the existence of castor oil.
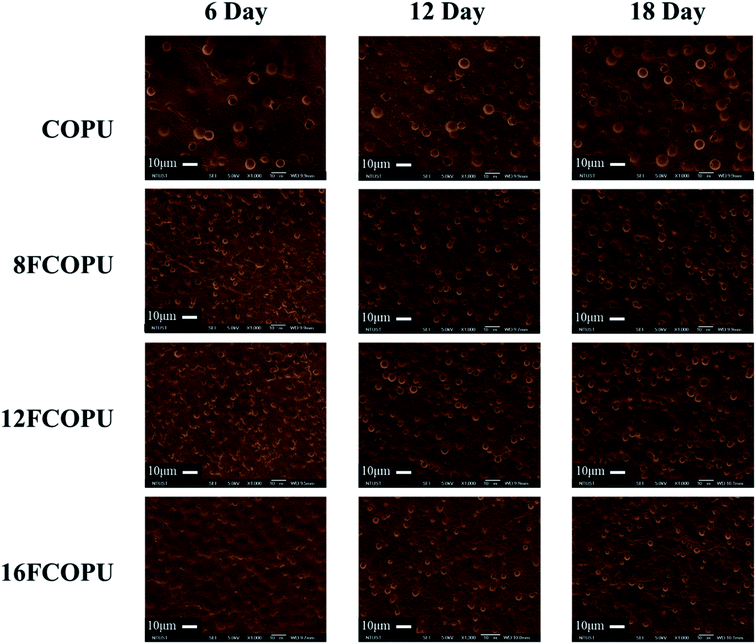 |
| | Fig. 16 Scanning electron microscope micrographs of the FCOPUs with hydrolytic degradation for 6, 12, 18 days at 45 °C. | |
Table 7 Comparison of FCOPUs degradation with previously reported PCL-based or castor oil-based polyurethane with fluorinated segments (or not)
| Sample name |
Solvent |
Time (day) |
Temp.(°C) |
Loss weight (%) |
Morphology |
Ref. |
|
Room temperature.
|
| COPU |
3 wt% NaOH |
18 |
45 |
28.88 |
Pores |
This study |
| 16FCOPU |
3 wt% NaOH |
18 |
45 |
22.28 |
Pores |
This study |
| PCL |
Buffer solutions (pH 10) |
50 |
37 |
≈18 |
Irregular and corrugated |
27
|
| PCL |
Buffer solutions (pH 4) |
50 |
37 |
≈12 |
Irregular and defects. |
27
|
| OPU |
45 wt% NaOH |
7 |
RTa |
≈50 |
— |
45
|
| FPU-1 |
45 wt% NaOH |
7 |
RTa |
≈4 |
— |
45
|
| PU/OFHD-01 |
3 wt% NaOH |
18 |
45 |
≈15 |
Cracks |
46
|
| PU/OFHD-02 |
3 wt% NaOH |
18 |
45 |
≈9 |
Cracks |
46
|
| WPU (castor oil-based) |
1 wt% NaOH |
0.5 |
45 |
≈21 |
Pores |
47
|
4. Conclusions
This study successfully prepared durable, degradable PUs by using MDI, PCL, castor oil, and fluorinated chains, 1H NMR, 19F NMR, 19F–19F COSY, 1H–19F COSY, and HMBC confirmed the successful synthesis of FCOPUs. Using similar molecular weight in all PU samples, we investigated how the length of perfluorinated alkyl segments would affect FCOPUs; the FTIR and XPS curve fitting results revealed that increases in such length increased (8FCOPU to 16FCOPU) hydrogen bonding interactions from 47.08% to 93.28% and increased the binding energy of C–F2 from 291.81 to 282.15 eV. According to these results, an increased number of perfluorinated alkyl segments effectively increased the number of hydrogen bonding interactions of FCOPUs. The AFM result showed that increased hydrogen bonding interactions were associated with higher level of phase separation. Regarding the thermal properties, the TGA, DSC, and DMA results revealed that when the lengths of perfluorinated alkyl segments increased, the numbers of physical crosslinks increased, which increased the thermal decomposition and glass transition temperatures of FCOPUs by approximately 5 °C; additionally, the DMA result suggested that the tan![[thin space (1/6-em)]](https://www.rsc.org/images/entities/char_2009.gif) δ decreased from 0.650 to 0.591. These results indicated that a long perfluorinated alkyl chain extender increased the elasticity and decreased the viscosity of FCOPUs. The result was similar to the tensile strength test, which suggested that a long perfluorinated alkyl chain extender increased the stiffness of FCOPU films. Finally, we performed a degradation test using a 3 wt% NaOH solution and verified that increasing fluorine content was conducive to slowing down the degradation process and that all samples exhibited circular pores rather than cracks on their surfaces during the degradation process, showing that FCOPUs have durable, degradable properties.
δ decreased from 0.650 to 0.591. These results indicated that a long perfluorinated alkyl chain extender increased the elasticity and decreased the viscosity of FCOPUs. The result was similar to the tensile strength test, which suggested that a long perfluorinated alkyl chain extender increased the stiffness of FCOPU films. Finally, we performed a degradation test using a 3 wt% NaOH solution and verified that increasing fluorine content was conducive to slowing down the degradation process and that all samples exhibited circular pores rather than cracks on their surfaces during the degradation process, showing that FCOPUs have durable, degradable properties.
Conflicts of interest
There are no conflicts to declare.
Acknowledgements
We acknowledge financial supports from the Ministry of Economic Affairs and the National Science Council (NSC) of Taiwan.
References
- M. Liu, T. Zhang, L. Long, R. Zhang and S. Ding, Polym. Degrad. Stab., 2019, 160, 120–125 CrossRef CAS.
- R. Geyer, J. R. Jambeck and K. L. Law, Sci. Adv., 2017, 3, e1700782 CrossRef.
- M. A. Elsawy, K. H. Kim, J. W. Park and A. Deep, Renewable Sustainable Energy Rev., 2017, 79, 1346–1352 CrossRef CAS.
- H. W. Jung, M. K. Yang and R. C. Su, Polym. Degrad. Stab., 2018, 154, 186–194 CrossRef CAS.
- Y. Tokiwa, B. Calabia, C. Ugwu and S. Aiba, Int. J. Mol. Sci., 2009, 10, 3722–3742 CrossRef CAS.
- E. Murray, B. C. Thompson, S. Sayyar and G. G. Wallace, Polym. Degrad. Stab., 2015, 111, 71–77 CrossRef CAS.
- K. Thirunavukarasu, S. Purushothaman, J. Sridevi, M. Aarthy, M. K. Gowthaman, T. Nakajima-Kambe and N. R. Kamini, Int. Biodeterior. Biodegrad., 2016, 110, 99–107 CrossRef CAS.
- P. Anbukarasu, D. I. Martínez-Tobón, D. Sauvageau and A. L. Elias, Polym. Degrad. Stab., 2017, 142, 102–110 CrossRef CAS.
- U. Biermann, W. Friedt, S. Lang, W. Lühs, G. Machmüller, J. O. Metzger, M. Rüsch gen. Klaas, H. J. Schäfer and M. P. Schneider, Angew. Chem., 2000, 112, 2292–2310 CrossRef.
- K. R. Kunduru, A. Basu, M. Haim Zada and A. J. Domb, Biomacromolecules, 2015, 16, 2572–2587 CrossRef CAS.
- G. Lligadas, J. C. Ronda, M. Galià and V. Cádiz, Mater. Today, 2013, 16, 337–343 CrossRef CAS.
- T. M. Crescentini, J. C. May, J. A. McLean and D. M. Hercules, Polymer, 2019, 121624 CrossRef.
- W. Xian, L. Song, B. Liu, H. Ding, Z. Li, M. Cheng and L. Ma, J. Appl. Polym. Sci., 2018, 135, 45974 CrossRef.
- C. Tao, Z. Luo, J. Bao, Q. Cheng, Y. Huang and G. Xu, J. Mater. Sci., 2018, 53, 8639–8652 CrossRef CAS.
- X. Jian, Y. Song, W. Zhou and L. Xiao, Polym. Eng. Sci., 2019, 59, 724–729 CrossRef CAS.
- A. Niemczyk, A. Piegat, Á. S. Olalla and M. El Fray, Eur. Polym. J., 2017, 93, 182–191 CrossRef CAS.
- D. Hermida-Merino, B. O. Driscoll, L. R. Hart, P. J. Harris, H. M. Colquhoun, A. T. Slark, C. Prisacariu, I. W. Hamley and W. Hayes, Polym. Chem., 2018, 9, 3406–3414 RSC.
- L. Rueda, B. F. d'Arlas, M. A. Corcuera and A. Eceiza, Polym. Degrad. Stab., 2014, 108, 195–200 CrossRef CAS.
- S. L. Huang, M. S. Chao, R. C. Ruaan and J. Y. Lai, Eur. Polym. J., 2000, 36, 285–294 CrossRef CAS.
- P. Alagi, Y. J. Choi and S. C. Hong, Eur. Polym. J., 2016, 78, 46–60 CrossRef CAS.
- Y. Guo, R. Zhang, Q. Xiao, H. Guo, Z. Wang, X. Li, J. Chen and J. Zhu, Polymer, 2018, 138, 242–254 CrossRef CAS.
- T. Gurunathan, S. Mohanty and S. K. Nayak, Prog. Org. Coat., 2015, 80, 39–48 CrossRef CAS.
- M. V. Hormaiztegui, M. I. Aranguren and V. L. Mucci, Eur. Polym. J., 2018, 102, 151–160 CrossRef CAS.
- S. Gómez-Fernández, L. Ugarte, C. Peña-Rodriguez, M. Á. Corcuera and A. Eceiza, Polym. Degrad. Stab., 2016, 132, 41–51 CrossRef.
- L. C. Raghunanan, S. Fernandez-Prieto, I. Martínez, C. Valencia, M. C. Sánchez and J. M. Franco, Eur. Polym. J., 2018, 101, 291–303 CrossRef CAS.
- K. K. Choi, S. H. Park, K. W. Oh and S. H. Kim, Macromol. Res., 2018, 23, 333–340 CrossRef.
- R. Scaffaro, F. Lopresti and L. Botta, Eur. Polym. J., 2017, 96, 266–277 CrossRef CAS.
- R. Berger, G. Resnati, P. Metrangolo, E. Weber and J. Hulliger, Chem. Soc. Rev., 2011, 40, 3496–3508 RSC.
- J. W. Li, H. T. Lee, H. A. Tsai, M. C. Suen and C. W. Chiu, Polymers, 2018, 10, 1292 CrossRef.
- S. K. Su, J. H. Gu, H. T. Lee, C. L. Wu, Y. R. Su and M. C. Suen, J. Polym. Res., 2018, 25, 227 CrossRef.
- O. Kysilka, M. Rybáčková, M. Skalický, M. Kvíčalová, J. Cvačka and J. Kvíčala, Collect. Czech. Chem. Commun., 2008, 73, 1799–1813 CrossRef CAS.
- Q. Tang and K. Gao, Int. J. Polym. Anal. Charact., 2017, 22, 569–574 CrossRef CAS.
- W. Yang, X. Cheng, H. Wang, Y. Liu and Z. Du, Polymer, 2017, 133, 68–77 CrossRef CAS.
- X. Wang, J. Xu, L. Li, Y. Liu, Y. Li and Q. Dong, Polymer, 2016, 98, 311–319 CrossRef CAS.
- N. Li, F. Zeng, Y. Wang, D. Qu, W. Hu, Y. Luan, S. Dong, J. Zhang and Y. Bai, RSC Adv., 2017, 7, 30970–30978 RSC.
- F. Yu, L. Cao, Z. Meng, N. Lin and X. Y. Liu, Polym. Chem., 2016, 7, 3913–3922 RSC.
- R. Berger, G. Resnati, P. Metrangolo, E. Weber and J. Hulliger, Chem. Soc. Rev., 2011, 40, 3496–3508 RSC.
- S. Y. Hsu, S. C. Lin, J. A. Wang, C. C. Hu, C. C. M. Ma and D. H. Tsai, Electrochim. Acta, 2019, 296, 427–437 CrossRef CAS.
- R. Piya, Y. Zhu, A. H. Soeriyadi, S. M. Silva, P. J. Reece and J. J. Gooding, Biosens. Bioelectron., 2019, 127, 229–235 CrossRef CAS PubMed.
- I. Muzammil, Y. Li and M. Lei, Plasma Processes Polym., 2017, 14, 1700053 CrossRef.
- S. Kerr and F. Y. Naumkin, New J. Chem., 2017, 41, 13576–13584 RSC.
- V. P. Swapna, R. Stephen, T. Greeshma, C. Sharan Dev and M. S. Sreekala, Polym. Compos., 2016, 37, 602–611 CrossRef CAS.
- C. H. Tsou, H. T. Lee, H. A. Tsai, H. J. Cheng and M. C. Suen, Polym. Degrad. Stab., 2013, 98, 643–650 CrossRef CAS.
- N. Goonoo, A. Bhaw-Luximon, I. A. Rodriguez, D. Wesner, H. Schönherr, G. L. Bowlin and D. Jhurry, Biomater. Sci., 2014, 2, 339–351 RSC.
- N. Li, F. L. Zeng, Y. Wang, D. Z. Qu, C. Zhang, J. Li, J. Z. Huo and Y. P. Bai, Chin. J. Polym. Sci., 2018, 36, 85–97 CrossRef CAS.
- C. L. Wu, S. H. Chiu, H. T. Lee and M. C. Suen, Polym. Adv. Technol., 2016, 27, 665–676 CrossRef CAS.
- J. W. Li, W. C. Tsen, C. H. Tsou, M. C. Suen and C. W. Chiu, Polymers, 2019, 11, 1333 CrossRef CAS.
|
| This journal is © The Royal Society of Chemistry 2019 |
Click here to see how this site uses Cookies. View our privacy policy here.  Open Access Article
 a,
Yung-Hsin
Cheng
a,
Hsun-Tsing
Lee
b,
Wen-Chin
Tsen
c,
Chih-Wei
Chiu
a,
Yung-Hsin
Cheng
a,
Hsun-Tsing
Lee
b,
Wen-Chin
Tsen
c,
Chih-Wei
Chiu
 *a and
Maw-Cherng
Suen
 *d
*d
![[double bond, length as m-dash]](https://www.rsc.org/images/entities/char_e001.gif) O. This interaction increased as the fluorinated segments became longer. Regarding the thermal properties of the FCOPUs, the thermogravimetric analysis, differential scanning calorimetry, and dynamic mechanical analysis results revealed that long fluorinated segments were associated with increased thermal stability in the FCOPUs. The atomic force microscopy and tensile strength test suggested that long fluorinated segments contained in the FCOPUs increased the degree of phase separation and tensile strength in FCOPUs. Finally, we dipped the FCOPUs in a 3 wt% NaOH solution, calculated the weight loss of the FCOPUs, and observed their surface structure by using scanning electron microscopy.
O. This interaction increased as the fluorinated segments became longer. Regarding the thermal properties of the FCOPUs, the thermogravimetric analysis, differential scanning calorimetry, and dynamic mechanical analysis results revealed that long fluorinated segments were associated with increased thermal stability in the FCOPUs. The atomic force microscopy and tensile strength test suggested that long fluorinated segments contained in the FCOPUs increased the degree of phase separation and tensile strength in FCOPUs. Finally, we dipped the FCOPUs in a 3 wt% NaOH solution, calculated the weight loss of the FCOPUs, and observed their surface structure by using scanning electron microscopy.![[double bond, length as m-dash]](https://www.rsc.org/images/entities/char_e001.gif) O and anion–πF.28 So, when the organofluorines were introduced to polyurethane, due to these interchain interactions could increase the amount of PCL-based polyurethane intermolecular force, so that the molecular segment was more stable. The present study used castor oil and PCL as the soft segment of PU, used a fluorinated chain extender to strengthen the interactions in PU, and aimed to increase the alkaline resistance of PCL and increase the durability of biodegradable PU. A study revealed that high fluorine content in PU indicated a high level of microphase separation of PU, and elevated tensile strength.29 Most relevant studies have examined fluorinated PU by changing the content of fluorinated chain extenders; changing the ratio of soft segment content to fluorinated chain extender content may result in different ratios of soft segments to hard segments, which may affect the properties of PU.30 To our knowledge, no research has discussed, with a constant R value (NCO
O and anion–πF.28 So, when the organofluorines were introduced to polyurethane, due to these interchain interactions could increase the amount of PCL-based polyurethane intermolecular force, so that the molecular segment was more stable. The present study used castor oil and PCL as the soft segment of PU, used a fluorinated chain extender to strengthen the interactions in PU, and aimed to increase the alkaline resistance of PCL and increase the durability of biodegradable PU. A study revealed that high fluorine content in PU indicated a high level of microphase separation of PU, and elevated tensile strength.29 Most relevant studies have examined fluorinated PU by changing the content of fluorinated chain extenders; changing the ratio of soft segment content to fluorinated chain extender content may result in different ratios of soft segments to hard segments, which may affect the properties of PU.30 To our knowledge, no research has discussed, with a constant R value (NCO![[thin space (1/6-em)]](https://www.rsc.org/images/entities/char_2009.gif) :
:![[thin space (1/6-em)]](https://www.rsc.org/images/entities/char_2009.gif) OH), the influence of fluorine on PU; therefore, the present study changed the chain length of a fluorinated chain extender to investigate the effect of such length on PU.
OH), the influence of fluorine on PU; therefore, the present study changed the chain length of a fluorinated chain extender to investigate the effect of such length on PU.
![[thin space (1/6-em)]](https://www.rsc.org/images/entities/char_2009.gif) :
:![[thin space (1/6-em)]](https://www.rsc.org/images/entities/char_2009.gif) OH was still 1
OH was still 1![[thin space (1/6-em)]](https://www.rsc.org/images/entities/char_2009.gif) :
:![[thin space (1/6-em)]](https://www.rsc.org/images/entities/char_2009.gif) 1.
1.![[thin space (1/6-em)]](https://www.rsc.org/images/entities/char_2009.gif) δ curve.
δ curve.

![[double bond, length as m-dash]](https://www.rsc.org/images/entities/char_e001.gif) C–O–CF2*–CF2, (B) O–CF2–CF2*–CF2, and (C) CF2–CF2–CF2*–CF2. Fig. 2 illustrates the 19F–19F NMR of the 12FCOPU and reveals three absorption peaks at −119.81 ppm, −122.79 ppm, −123.90 ppm in the one-dimensional fluorine NMR spectrum; positions of the three peaks were labeled as 1–3 respectively. To analyze F1–F3 accurately, we analyzed the two strong correlations shown in Fig. 2 (i.e., F1–F2 and F2–F3); previous studies have revealed that 4J(F,F) was stronger than 3J(F,F),31 meaning that a strong coupling exists in 4J(F,F). According to Fig. 2, F–A and F–A′ are most influenced by other elements and are thus labeled as F1, which shows a 4J(F,F) coupling (F1–F2′). Accordingly, F–C and F–C′ are labeled as F2, which shows another 4J(F,F) coupling (F2–F3); therefore, F–B and F–B′ are labeled as F3. The peak at −119.81 ppm (F1) corresponds to F–A and F–A'; the peak at −122.79 ppm (F2 and F2′) corresponds to F–C and F–C'; and the peak at −123.90 ppm (F3) corresponds to F–B and F–B'. The relative positions of fluorine were then confirmed. However, the relative positions did not adequately suggest that the fluorinated chain extender was connected to the PUs; thus, a two-dimensional NMR spectrum analysis was required to confirm the connection. Fig. 3 presents the 1H–19F correlation spectroscopy (COSY) result of the 12FCOPU and shows that the H atoms of the CH2 group in the fluorinated chain extender exhibits a 3J(H,F) coupling with F1 at 4.89 ppm; the H atoms also have a weak 4J(F,F) coupling with F3 at 4.88 ppm. The NMR of the fluorinated chain extender is shown in Fig. 3. Subsequently, Fig. 4 shows the 1H–13C HMBC spectrum of the 12FCOPU. A previous study indicated that the position of O–C
C–O–CF2*–CF2, (B) O–CF2–CF2*–CF2, and (C) CF2–CF2–CF2*–CF2. Fig. 2 illustrates the 19F–19F NMR of the 12FCOPU and reveals three absorption peaks at −119.81 ppm, −122.79 ppm, −123.90 ppm in the one-dimensional fluorine NMR spectrum; positions of the three peaks were labeled as 1–3 respectively. To analyze F1–F3 accurately, we analyzed the two strong correlations shown in Fig. 2 (i.e., F1–F2 and F2–F3); previous studies have revealed that 4J(F,F) was stronger than 3J(F,F),31 meaning that a strong coupling exists in 4J(F,F). According to Fig. 2, F–A and F–A′ are most influenced by other elements and are thus labeled as F1, which shows a 4J(F,F) coupling (F1–F2′). Accordingly, F–C and F–C′ are labeled as F2, which shows another 4J(F,F) coupling (F2–F3); therefore, F–B and F–B′ are labeled as F3. The peak at −119.81 ppm (F1) corresponds to F–A and F–A'; the peak at −122.79 ppm (F2 and F2′) corresponds to F–C and F–C'; and the peak at −123.90 ppm (F3) corresponds to F–B and F–B'. The relative positions of fluorine were then confirmed. However, the relative positions did not adequately suggest that the fluorinated chain extender was connected to the PUs; thus, a two-dimensional NMR spectrum analysis was required to confirm the connection. Fig. 3 presents the 1H–19F correlation spectroscopy (COSY) result of the 12FCOPU and shows that the H atoms of the CH2 group in the fluorinated chain extender exhibits a 3J(H,F) coupling with F1 at 4.89 ppm; the H atoms also have a weak 4J(F,F) coupling with F3 at 4.88 ppm. The NMR of the fluorinated chain extender is shown in Fig. 3. Subsequently, Fig. 4 shows the 1H–13C HMBC spectrum of the 12FCOPU. A previous study indicated that the position of O–C![[double bond, length as m-dash]](https://www.rsc.org/images/entities/char_e001.gif) O in PU was at approximately 153 ppm.32 With the position of C
O in PU was at approximately 153 ppm.32 With the position of C![[double bond, length as m-dash]](https://www.rsc.org/images/entities/char_e001.gif) O corresponding to the position of H atoms in CH2 at 4.88 ppm, the fluorinated chain extender successfully reacted with MDI to form urethane groups.
O corresponding to the position of H atoms in CH2 at 4.88 ppm, the fluorinated chain extender successfully reacted with MDI to form urethane groups.
![[double bond, length as m-dash]](https://www.rsc.org/images/entities/char_e001.gif) O stretching vibration at approximately 1724.36 cm−1 (amide I band), –NH bending vibration at 1531.47 cm−1 (amide II band), and stretching vibration of C–F group at 1217.08 cm−1. A peak caused by C–O stretching vibration at 1064.70 cm−1 is also observed. Additionally, the free NCO groups of MDI are not shown in the spectrum in the wavenumber range of 2240–2275 cm−1, indicating that MDI has reacted with the PCL, castor oil, and chain extender completely.
O stretching vibration at approximately 1724.36 cm−1 (amide I band), –NH bending vibration at 1531.47 cm−1 (amide II band), and stretching vibration of C–F group at 1217.08 cm−1. A peak caused by C–O stretching vibration at 1064.70 cm−1 is also observed. Additionally, the free NCO groups of MDI are not shown in the spectrum in the wavenumber range of 2240–2275 cm−1, indicating that MDI has reacted with the PCL, castor oil, and chain extender completely.
![[double bond, length as m-dash]](https://www.rsc.org/images/entities/char_e001.gif) Ofree, C
Ofree, C![[double bond, length as m-dash]](https://www.rsc.org/images/entities/char_e001.gif) OHB disordered, and C
OHB disordered, and C![[double bond, length as m-dash]](https://www.rsc.org/images/entities/char_e001.gif) OHB ordered, with the peak value of C
OHB ordered, with the peak value of C![[double bond, length as m-dash]](https://www.rsc.org/images/entities/char_e001.gif) OHB ordered observed at approximately 1660 cm−1.33 Another study showed two peak values (free radicals and HBs), in the C–F absorption peak of fluorinated PU;34 the same study calculated the percentage of HBs in fluorinated PU at 1530 cm−1 because no peaks other than a benzene ring stretching vibration peak were observed at this wavenumber. The following equation can be used to verify the existence of hydrogen in PUs:
OHB ordered observed at approximately 1660 cm−1.33 Another study showed two peak values (free radicals and HBs), in the C–F absorption peak of fluorinated PU;34 the same study calculated the percentage of HBs in fluorinated PU at 1530 cm−1 because no peaks other than a benzene ring stretching vibration peak were observed at this wavenumber. The following equation can be used to verify the existence of hydrogen in PUs:

![[double bond, length as m-dash]](https://www.rsc.org/images/entities/char_e001.gif) O, indicating that increases in the length of a fluorinated chain extender might change the molecular interactions in PU films. Therefore, we performed curve fitting on C 1s of the FCOPUs to discuss molecular interactions (Fig. 8). The C 1s curve of the FCOPUs reveals binding energies as follows: C
O, indicating that increases in the length of a fluorinated chain extender might change the molecular interactions in PU films. Therefore, we performed curve fitting on C 1s of the FCOPUs to discuss molecular interactions (Fig. 8). The C 1s curve of the FCOPUs reveals binding energies as follows: C![[double bond, length as m-dash]](https://www.rsc.org/images/entities/char_e001.gif) C (283.7 eV), C–C (284.8 eV), C–N (285.2 eV), C–O (285.7 eV), C–O–C (287.0 eV), O–C
C (283.7 eV), C–C (284.8 eV), C–N (285.2 eV), C–O (285.7 eV), C–O–C (287.0 eV), O–C![[double bond, length as m-dash]](https://www.rsc.org/images/entities/char_e001.gif) O (289.5 eV), and C–F2 (292 eV), these peak positions are consistent with these report.38–40 The results indicated that with an increased length of fluorinated chain extender, the C–F2 binding energy increased from 291.81 to 292.15 eV, and such an increase of energy was contributed by the hydrogen bonding in C–F⋯H–N. Specifically, a longer length of perfluorinated alkyl chains indicated higher content of fluorine in the PUs, thus increasing the number of hydrogen bonding interactions in C–F⋯H–N; this result was consistent with that of the FTIR. The O–C
O (289.5 eV), and C–F2 (292 eV), these peak positions are consistent with these report.38–40 The results indicated that with an increased length of fluorinated chain extender, the C–F2 binding energy increased from 291.81 to 292.15 eV, and such an increase of energy was contributed by the hydrogen bonding in C–F⋯H–N. Specifically, a longer length of perfluorinated alkyl chains indicated higher content of fluorine in the PUs, thus increasing the number of hydrogen bonding interactions in C–F⋯H–N; this result was consistent with that of the FTIR. The O–C![[double bond, length as m-dash]](https://www.rsc.org/images/entities/char_e001.gif) O binding energy decreased slightly from 289.69 to 289.54 eV; such a decrease might be caused by the steric hindrance increasing with the increasing length of the fluorinated chain extender, which disrupted hydrogen bonding in C
O binding energy decreased slightly from 289.69 to 289.54 eV; such a decrease might be caused by the steric hindrance increasing with the increasing length of the fluorinated chain extender, which disrupted hydrogen bonding in C![[double bond, length as m-dash]](https://www.rsc.org/images/entities/char_e001.gif) O⋯N–H, as well as by a dipole–dipole interaction existing in C–F⋯C
O⋯N–H, as well as by a dipole–dipole interaction existing in C–F⋯C![[double bond, length as m-dash]](https://www.rsc.org/images/entities/char_e001.gif) O.30,41
O.30,41
![[double bond, length as m-dash]](https://www.rsc.org/images/entities/char_e001.gif) O exhibited interactions, and HBs existed between C–F and N–H; therefore, fluorine in FCOPUs enhanced the interactions between hard segments and thus led to microphase separation. Furthermore, the increased interactions in the polymer resulted in unstable film formation process of FCOPUs, thus leading to increased surface roughness.
O exhibited interactions, and HBs existed between C–F and N–H; therefore, fluorine in FCOPUs enhanced the interactions between hard segments and thus led to microphase separation. Furthermore, the increased interactions in the polymer resulted in unstable film formation process of FCOPUs, thus leading to increased surface roughness.
![[double bond, length as m-dash]](https://www.rsc.org/images/entities/char_e001.gif) O. Therefore, the increased degree of physical crosslinking in the polymer chains required increased thermal energy for polymer chain movement, thereby increasing the Tg and Tm. This result was consistent with the XPS and FTIR results; furthermore, the TGA and DSC suggested that increased length of a fluorinated chain extender was conducive to enhancing the thermal stability of fluorinated PUs.
O. Therefore, the increased degree of physical crosslinking in the polymer chains required increased thermal energy for polymer chain movement, thereby increasing the Tg and Tm. This result was consistent with the XPS and FTIR results; furthermore, the TGA and DSC suggested that increased length of a fluorinated chain extender was conducive to enhancing the thermal stability of fluorinated PUs.![[thin space (1/6-em)]](https://www.rsc.org/images/entities/char_2009.gif) δ of FCOPUs synthesized using fluorinated chain extenders with different lengths. Dynamic glass transition temperature (Tgd) is defined as the dynamic glass transition temperature of FCOPUs. Table 5 compiles the maximum values of Tgd and tan
δ of FCOPUs synthesized using fluorinated chain extenders with different lengths. Dynamic glass transition temperature (Tgd) is defined as the dynamic glass transition temperature of FCOPUs. Table 5 compiles the maximum values of Tgd and tan![[thin space (1/6-em)]](https://www.rsc.org/images/entities/char_2009.gif) δ; the maximum Tgd values are as follows: 8FCOPU (1.88 °C), 12FCOPU (3.24 °C), and 16FCOPU (6.74 °C). The result indicated that the dynamic glass transition temperature increased with increases in the length of the fluorinated chain extender. Possibly a long fluorinated chain extender contains numerous fluorine atoms, thereby increasing the interactions in FCOPUs, increasing the thermal energy required by polymer chain movement, and improving the thermal stability of the FCOPUs. The result was consistent with that suggested by the TGA and DSC. The maximum values of tan
δ; the maximum Tgd values are as follows: 8FCOPU (1.88 °C), 12FCOPU (3.24 °C), and 16FCOPU (6.74 °C). The result indicated that the dynamic glass transition temperature increased with increases in the length of the fluorinated chain extender. Possibly a long fluorinated chain extender contains numerous fluorine atoms, thereby increasing the interactions in FCOPUs, increasing the thermal energy required by polymer chain movement, and improving the thermal stability of the FCOPUs. The result was consistent with that suggested by the TGA and DSC. The maximum values of tan![[thin space (1/6-em)]](https://www.rsc.org/images/entities/char_2009.gif) δ of FCOPUs were shown to decrease from 0.6503 to 0.5907 with the increased length of the fluorinated chain extender. Possibly numerous fluorine atoms contained in the FCOPUs led to an increased number of physical crosslinks (C–F⋯C
δ of FCOPUs were shown to decrease from 0.6503 to 0.5907 with the increased length of the fluorinated chain extender. Possibly numerous fluorine atoms contained in the FCOPUs led to an increased number of physical crosslinks (C–F⋯C![[double bond, length as m-dash]](https://www.rsc.org/images/entities/char_e001.gif) O and C–F⋯H–N), which in turn resulted in reduced mobility of polymer chains in the FCOPUs. In other words, tan
O and C–F⋯H–N), which in turn resulted in reduced mobility of polymer chains in the FCOPUs. In other words, tan![[thin space (1/6-em)]](https://www.rsc.org/images/entities/char_2009.gif) δ is obtained by dividing E′′ by E′, and therefore the more fluorine is in the FCOPUs, the lower the viscosity is, and the higher the elasticity is. Furthermore, Table 5 reveals the crosslink density of 8FCOPU (0.02249 mol cm−3), 12FCOPU (0.02373 mol cm−3), and 16FCOPU (0.03033 mol cm−3); the result indicated that FCOPUs synthesized by a longer fluorinated chain was associated with an increased crosslink density. This study employed the swelling method and used the Flory–Rehner equation to calculate the crosslink density of FCOPUs. A previous study indicated that crosslink density calculated using the swelling method was the sum of chemical and physical crosslinks.42 Accordingly, because the FCOPUs prepared by the present study all had the same number of chemical crosslinks, we verified that FCOPUs synthesized using long fluorinated chains increased the degree of physical crosslinking and improved the mechanical properties of FCOPUs.
δ is obtained by dividing E′′ by E′, and therefore the more fluorine is in the FCOPUs, the lower the viscosity is, and the higher the elasticity is. Furthermore, Table 5 reveals the crosslink density of 8FCOPU (0.02249 mol cm−3), 12FCOPU (0.02373 mol cm−3), and 16FCOPU (0.03033 mol cm−3); the result indicated that FCOPUs synthesized by a longer fluorinated chain was associated with an increased crosslink density. This study employed the swelling method and used the Flory–Rehner equation to calculate the crosslink density of FCOPUs. A previous study indicated that crosslink density calculated using the swelling method was the sum of chemical and physical crosslinks.42 Accordingly, because the FCOPUs prepared by the present study all had the same number of chemical crosslinks, we verified that FCOPUs synthesized using long fluorinated chains increased the degree of physical crosslinking and improved the mechanical properties of FCOPUs.
![[thin space (1/6-em)]](https://www.rsc.org/images/entities/char_2009.gif) δ (°C)
δ (°C)![[thin space (1/6-em)]](https://www.rsc.org/images/entities/char_2009.gif) δmax
δmax![[double bond, length as m-dash]](https://www.rsc.org/images/entities/char_e001.gif) O and C–F⋯H–N produced more physical crosslinks in 18FCOPUs, thereby inhibiting the mobility of polymer chain and maximizing the tensile strength. The Young's moduli of 8FCOPU (0.222 MPa), 12FCOPU (0.243 MPa), and 16FCOPU (0.26 MPa) showed that the longer the fluorinated chain extender used for FCOPU synthesis was, the higher the stiffness of the chain extender was. Specifically, an increased content of fluorine in FCOPUs was associated with increased interactions in FCOPUs; accordingly, the 16FCOPU, compared with the other samples, showed the highest resistance to polymer chain breakage by external force. These mechanical analysis results were consistent with the DMA results.
O and C–F⋯H–N produced more physical crosslinks in 18FCOPUs, thereby inhibiting the mobility of polymer chain and maximizing the tensile strength. The Young's moduli of 8FCOPU (0.222 MPa), 12FCOPU (0.243 MPa), and 16FCOPU (0.26 MPa) showed that the longer the fluorinated chain extender used for FCOPU synthesis was, the higher the stiffness of the chain extender was. Specifically, an increased content of fluorine in FCOPUs was associated with increased interactions in FCOPUs; accordingly, the 16FCOPU, compared with the other samples, showed the highest resistance to polymer chain breakage by external force. These mechanical analysis results were consistent with the DMA results.
![[double bond, length as m-dash]](https://www.rsc.org/images/entities/char_e001.gif) O groups in castor oil and PCL molecules.44 When FCOPUs were dipped in a NaOH solution, OH− attacked O–C
O groups in castor oil and PCL molecules.44 When FCOPUs were dipped in a NaOH solution, OH− attacked O–C![[double bond, length as m-dash]](https://www.rsc.org/images/entities/char_e001.gif) O* to break the double bonds and attached itself to O–C*–O−; subsequently, O− attacked O*–C(OH)–O−, detached the bonds, added electrons to O−, and formed the following degraded form: –OH + HO–C
O* to break the double bonds and attached itself to O–C*–O−; subsequently, O− attacked O*–C(OH)–O−, detached the bonds, added electrons to O−, and formed the following degraded form: –OH + HO–C![[double bond, length as m-dash]](https://www.rsc.org/images/entities/char_e001.gif) O. In an alkaline solution, –COOH and –OH are dehydrogenated to –O− and –COO−; the ionic bonds between the negative electrons and Na+ form –ONa and –COONa, which can be reduced by H2O to –OH and –COOH. In this study, the PCL segments were degraded to 6-hydroxyhexanoic acid and diethylene glycol; the castor oil segments were degraded to glycerol (Fig. 15). With this process repeating continuously, the FCOPU film was degraded in the alkaline solution and started losing weight. This, together with the other analysis results, indicated that high fluorine content in PUs produced numerous physical crosslinks in FCOPUs, which increased the durability of FCOPUs in alkaline solutions.
O. In an alkaline solution, –COOH and –OH are dehydrogenated to –O− and –COO−; the ionic bonds between the negative electrons and Na+ form –ONa and –COONa, which can be reduced by H2O to –OH and –COOH. In this study, the PCL segments were degraded to 6-hydroxyhexanoic acid and diethylene glycol; the castor oil segments were degraded to glycerol (Fig. 15). With this process repeating continuously, the FCOPU film was degraded in the alkaline solution and started losing weight. This, together with the other analysis results, indicated that high fluorine content in PUs produced numerous physical crosslinks in FCOPUs, which increased the durability of FCOPUs in alkaline solutions.

![[thin space (1/6-em)]](https://www.rsc.org/images/entities/char_2009.gif) δ decreased from 0.650 to 0.591. These results indicated that a long perfluorinated alkyl chain extender increased the elasticity and decreased the viscosity of FCOPUs. The result was similar to the tensile strength test, which suggested that a long perfluorinated alkyl chain extender increased the stiffness of FCOPU films. Finally, we performed a degradation test using a 3 wt% NaOH solution and verified that increasing fluorine content was conducive to slowing down the degradation process and that all samples exhibited circular pores rather than cracks on their surfaces during the degradation process, showing that FCOPUs have durable, degradable properties.
δ decreased from 0.650 to 0.591. These results indicated that a long perfluorinated alkyl chain extender increased the elasticity and decreased the viscosity of FCOPUs. The result was similar to the tensile strength test, which suggested that a long perfluorinated alkyl chain extender increased the stiffness of FCOPU films. Finally, we performed a degradation test using a 3 wt% NaOH solution and verified that increasing fluorine content was conducive to slowing down the degradation process and that all samples exhibited circular pores rather than cracks on their surfaces during the degradation process, showing that FCOPUs have durable, degradable properties.


