DOI:
10.1039/C9RA05606H
(Paper)
RSC Adv., 2019,
9, 28312-28322
Facile synthesis of novel 3D flower-like magnetic La@Fe/C composites from ilmenite for efficient phosphate removal from aqueous solution†
Received
20th July 2019
, Accepted 2nd September 2019
First published on 9th September 2019
Abstract
In this study, a novel 3D flower-like La@Fe/C magnetic composite was successfully synthesized by carbothermal reduction of ilmenite via microwave radiation. The physico-chemical properties of the composite were investigated. The results showed that La@Fe/C features a 3D flower-like morphology with an SBET and Vmic of 114 m2 g−1 and 0.017 cm3 g−1, respectively. Zerovalent iron and metal oxides were detected by XRD and XPS on the surface of the adsorbent, which formed as a result of carbothermal reduction of ilmenite using coconut shell-based carbon followed by the introduction of lanthanum. This resultant magnetic La@Fe/C exhibited remarkable phosphate selectivity performance even in the presence of a 50-fold excess of competing ions, which is superior to the pristine ilmenite and coconut activated carbon. Adsorption isotherms and adsorption kinetics fitted well with the Langmuir model and pseudo-second-order model, respectively. A thermodynamic study indicated that the adsorption of phosphate was spontaneous and endothermic. The adsorption–regeneration cyclic experiments of the La@Fe/C composite demonstrated a good level of recyclability. These results indicated that carbothermal reduction of ilmenite followed by the introduction of lanthanum could result in highly efficient and recoverable magnetic particles for the removal of phosphate from wastewater.
1. Introduction
Phosphates are essential nutrients for the existence of various life forms. However, excessive release of phosphate into water bodies can trigger the deterioration of water quality, collapse of the aquatic ecosystem, or even algae blooms because of eutrophication.1 In the past few decades, various methods have been investigated for the removal of excessive phosphate from the water bodies. Adsorption has often been proposed as a promising means for phosphate removal due to its several favorable characteristics including (i) simple design, (ii) ease of operation, and (iii) high removal efficiency even at low phosphate concentration.2 Various types of adsorbents such as biomass, activated carbon, metal oxide nanoparticles and hydrogel have been explored to remove phosphate from water,3,4 yet, enhancing the phosphate adsorption capacity and recyclability of the adsorbents remained as two important challenges to be overcome.
Among different types of oxides and hydroxides of metals tested, those of Fe, Al, La and Ca have been regarded as effective adsorbents for the removal of phosphate owing to their high phosphate binding capacity.5 In particular, lanthanum (La) has attracted special attention, since it is highly active in binding phosphate and forming environmentally friendly lanthanum–phosphate complex, which is highly insoluble (pK = 26.16).4,6 Therefore, lanthanum has often been preferred as a loading agent to enhance the removal of phosphate from aqueous solutions. Various La loaded porous adsorbent such as La-loaded mesoporous silica,7 La-loaded activated fiber8 and La-loaded zeolite9 have been proven to be favorable for improving phosphate uptake capacity. However, in spite of their promising adsorption capacity towards phosphate, their practical application is rather limited due to the difficulties encountered in separating these adsorbents from water.
Recently, coatings of magnetic iron or its (hydr)oxides on lanthanum have been offered as an effective means to enable the rapid magnetic separation of the adsorbents from aqueous solutions. Researchers have demonstrated that Fe3O4-coated lanthanum (La(OH)3/Fe3O4) exhibited higher adsorption capacity toward phosphate compared to pure Fe3O4.10 Among iron-based nanoparticles, zerovalent iron (nZVI) exhibited significantly higher adsorptive removal capacity towards phosphate than other adsorbents, which is caused by the synergetic effect of precipitation and chemical adsorption during the removal of phosphate.11 However, nZVI has certain shortcomings, including ease of aggregation and oxidation, which adversely affect its adsorptive removal performance.12 To alleviate these detrimental effects, stabilization of nZVI on carriers that are compatible with the adsorptive removal process, i.e., activated carbon and activated carbon fiber, have been proposed as an effective strategy that not only reduces nZVI agglomeration, but also prevents its oxidation.12 However, the stabilization of nZVI on carriers typically involves relatively burdensome multiple-step protocols, such as coating, reducing, washing and drying processes, which would result in a higher production cost. On the contrary, one-step pyrolysis of iron oxide with carbon possesses a greener and economically feasible way to produce affordable nZVI for environmental remediation.
This study shows first demonstration of preparing nZVI loaded particles through a one-step carbothermal reduction assisted by microwave radiation, whereby low-cost ilmenite is used as a raw material. Ilmenite is an abundant natural magnetic ore with chemical formula of FeTiO3.13 After carbothermal reduction of ilmenite by coconut activated carbon (AC) via microwave radiation, novel magnetic nZVI-based particles with flower-like morphologies were obtained. To further improve the phosphate adsorption capacity, lanthanum was introduced into the nZVI-based particles. The physico-chemical properties of the resultant adsorbents were characterized. The influence of various parameters such as lanthanum impregnation ratio, adsorbent dosage, pH and contact time on phosphate removal were investigated in a systematic fashion and discussed in detail. Furthermore, the kinetics and thermodynamics of the adsorption process were examined. Finally, the recyclability of the adsorbents synthesized was evaluated.
2. Materials and methods
2.1 Materials
The ilmenite from Sichuan province of China was used as raw material to prepare adsorbents, which mainly consisted of (wt%): O (45.1), Fe (21.7), Ti (20.8), C (3.4), Mg (2.9), Si (2.8), Al (1.5), S (0.7), Ca (0.6), Mn (0.4), and Na (0.1). The elemental composition of the coconut activated carbon was as follows (wt%): C (85.6), H (1.5), N (0.5), O (12.4). Chemical reagents such as LaCl3·9H2O, KH2PO4, NaOH and HCl were of analytical reagent grade and used as received without further purification.
2.2 Preparation of adsorbents
For the preparation of the adsorbents, raw materials, i.e., ilmenite and coconut activated carbon, were dried, grinded and sieved pass through a 200-mesh screen. 15 g of the mixed sample with a ratio of mIlmenite![[thin space (1/6-em)]](https://www.rsc.org/images/entities/char_2009.gif) :
:![[thin space (1/6-em)]](https://www.rsc.org/images/entities/char_2009.gif) mAC = 4
mAC = 4![[thin space (1/6-em)]](https://www.rsc.org/images/entities/char_2009.gif) :
:![[thin space (1/6-em)]](https://www.rsc.org/images/entities/char_2009.gif) 1 was then activated at 600 W for 10 min in the microwave oven under N2 atmosphere. The resultant particles were designated as Fe/C precursor, and the magnetic particles separated from Fe/C precursor using magnet were named as magnetic precursor. For the fabrication of lanthanum-loaded Fe/C composites, 100 mL certain concentration LaCl3 solution was added to 2 g of Fe/C precursor, and then 0.1 mol L−1 NaOH solution was introduced dropwise until the final pH reached 10.0. The final mixture was stirred at 333 K for 1 h.14 Thereafter, the slurry was dried at 378 K, followed by activation at 300 W for 2 min in the microwave oven under N2 atmosphere. Upon cooling to room temperature, the samples were crushed and sieved through a 200-mesh screen for adsorption tests. The sample produced with impregnated lanthanum was labeled as Lax@Fe/C, where x refers to the impregnating concentration of La. The sample Lax@Fe/C after phosphate adsorption was named Lax@Fe/C-A.
1 was then activated at 600 W for 10 min in the microwave oven under N2 atmosphere. The resultant particles were designated as Fe/C precursor, and the magnetic particles separated from Fe/C precursor using magnet were named as magnetic precursor. For the fabrication of lanthanum-loaded Fe/C composites, 100 mL certain concentration LaCl3 solution was added to 2 g of Fe/C precursor, and then 0.1 mol L−1 NaOH solution was introduced dropwise until the final pH reached 10.0. The final mixture was stirred at 333 K for 1 h.14 Thereafter, the slurry was dried at 378 K, followed by activation at 300 W for 2 min in the microwave oven under N2 atmosphere. Upon cooling to room temperature, the samples were crushed and sieved through a 200-mesh screen for adsorption tests. The sample produced with impregnated lanthanum was labeled as Lax@Fe/C, where x refers to the impregnating concentration of La. The sample Lax@Fe/C after phosphate adsorption was named Lax@Fe/C-A.
2.3 Phosphate adsorption experiments
Phosphate solution was prepared by dissolving analytical grade anhydrous potassium dihydrogen phosphate (KH2PO4) in distilled water. The phosphate adsorption experiments were carried out in sealed conical flasks with 50 mL of 10 mg L−1 P. The effect of lanthanum impregnation ratio, adsorbent dosage (1–8 g L−1), pH (3–11) and contact time (0–180 min) was studied. After the adsorption process, the suspension was filtered through a 0.45 μm membrane, and the remaining phosphate concentration was determined according to the molybdenum blue spectrophotometric method (UV/Vis spectrophotometer at λmax = 700 nm).8 The adsorption experiments were carried out three times, and the mean values of the tests were reported with relative standard deviation (RSD) below 0.52%.
The removal efficiency (η) of phosphate and the adsorption capacity (qt) of the adsorbent were calculated according to eqn (1) and (2), respectively:
| |
 | (1) |
| |
 | (2) |
where
C0 (mg L
−1) and
Ct (mg L
−1) are the concentrations of the phosphate initially and at time
t (min), respectively;
η (%) is the removal efficiency of phosphate;
V (L) is the volume of phosphate solution; and
M (g) is the mass of the adsorbent.
The equilibrium adsorption capacity (qe, mg g−1) was determined as eqn (3):
| |
 | (3) |
where
Ce (mg L
−1) is the equilibrium concentration of phosphate.
The influence of coexisting ions on the phosphate removal, such as Ca2+ (60–220 mg L−1), Cl− (50–300 mg L−1), NO3− (50–300 mg L−1), SO42− (50–300 mg L−1), and CO32− (50–300 mg L−1) were evaluated in batch experiments with phosphate concentration of 10 mg L−1. The La@Fe/C after phosphate adsorption were calcined at 673 K, washed, and dried for further regeneration tests.
The mechanism for phosphate adsorption onto the adsorbents was studied by fitting the kinetic data with pseudo-first-order model, pseudo-second-order model and intra-particle-diffusion model (eqn (4)–(6)):15–17
| |
ln(qe − qt) = ln![[thin space (1/6-em)]](https://www.rsc.org/images/entities/char_2009.gif) qe − k1t qe − k1t
| (4) |
| |
 | (5) |
where
qe and
qt (mg g
−1) are the respective adsorption capacities at equilibrium and at time “
t” (min);
k1,
k2 and
kid are the rate constants of pseudo-first-order model, pseudo-second-order model and intra-particle-diffusion model, respectively, and
C is a constant related to the extent of the boundary layer thickness.
Three widely used isotherms including Langmuir, Freundlich and Temkin models were applied to fit the experimental data for adsorbing phosphate onto adsorbent (eqn (7)–(9)).18–20
| |
 | (7) |
| |
 | (8) |
| |
qe = BT![[thin space (1/6-em)]](https://www.rsc.org/images/entities/char_2009.gif) ln ln![[thin space (1/6-em)]](https://www.rsc.org/images/entities/char_2009.gif) AT + BT AT + BT![[thin space (1/6-em)]](https://www.rsc.org/images/entities/char_2009.gif) ln(Ce) ln(Ce)
| (9) |
where
qm (mg g
−1) and
kL (L mg
−1) are Langmuir constants related to the adsorption capacity and the adsorption rate, respectively;
kF ((mg g
−1) (L mg)
−1/n) and
n are the constants and a measure of the adsorption intensity, respectively.
BT =
RT/
b, where
b (J mol
−1),
AT (L mg
−1),
R (8.314 J mol
−1 K
−1) and
T (K) are the Temkin constant related to the heat of adsorption, equilibrium binding constant, gas constant and absolute temperature, respectively.
Thermodynamic parameters including enthalpy (ΔH0), entropy (ΔS0) and free energy (ΔG0) were calculated using the eqn (10) and (11):21
| |
 | (10) |
| |
ΔG0 = −RT![[thin space (1/6-em)]](https://www.rsc.org/images/entities/char_2009.gif) ln ln![[thin space (1/6-em)]](https://www.rsc.org/images/entities/char_2009.gif) kd kd
| (11) |
where
kd is the distribution coefficient; Δ
S0 (kJ mol
−1 K
−1) is the standard entropy; Δ
H0 (kJ mol
−1) is the standard enthalpy;
R (8.314 J mol
−1 K
−1) is the gas constant and
T (K) is the absolute temperature.
2.4 Characterization of adsorbents
N2 adsorption–desorption isotherm of samples was measured at 77 K using the surface area analyzer (ASAP 2460, Norcross, GA). The specific surface area (SBET), total pore volume (Vtot), mesopore volume (Vmes), micropore volume (Vmic), and pore size distribution were obtained from the N2 adsorption–desorption isotherms using the Brunauer–Emmett–Teller (BET) equation, N2 adsorption amount at the maximum relative pressure, Barrett–Joyner–Halenda (BJH) method, t-plot method, and density functional theory (DFT) method, respectively.
The crystallinity and phase identification of adsorbents were determined by XRD (X-Pert PRO MPD, Panalytical, NL) with Cu Kα as the radiation source under 36 KV with 2θ range of 10–80°. The surface chemistry was determined by an X-ray photoelectron spectroscopy (XPS) (XSAM-800, KRATOS, UK) with Al (1486.6 eV) under ultra-high vacuum at 12 kV and 15 mA.
Fourier Transforms Infrared Spectroscopy (FTIR) characterization was carried out with a spectrometer (Tensor 27 spectrometer, FTIR-6700, Nicolet, USA) in the range of 4000–400 cm−1 with a resolution of 4 cm−1. The Scanning Electron Microscopy (SEM) measurement was carried out using SEM (JEOL, JSM-7500 F, Japan). pH point of zero charge (pHPZC) was measured by the method described by Moharami and Jalali to investigate the total surface charge of the adsorbents.22
3. Results and discussion
3.1 Characterization of the adsorbents
3.1.1 Textural properties. The textural properties of the absorbents synthesized are shown in Table 1, which were calculated on the basis of their N2 adsorption–desorption isotherms. N2 isotherms (Fig. S1 in ESI†) showed that the pristine ilmenite had no obvious porosity, while coconut AC and La@Fe/C had hierarchical pore structure with obvious hysteresis loop (Fig. S1b and d†).23 As can be seen from Table 1, the specific surface area (SBET) of pristine ilmenite, coconut AC, and Fe/C precursor were 0.3 m2 g−1, 1590 m2 g−1, and 270 m2 g−1, respectively. After La modification, the SBET of La0.001@Fe/C, La0.005@Fe/C, La0.06@Fe/C and La0.12@Fe/C were 106 m2 g−1, 114 m2 g−1, 115 m2 g−1, and 117 m2 g−1, respectively, all of which are substantially smaller than the Fe/C precursor. The reduction of the SBET after La doping may possibly result from the formation of aggregated La/Fe-nanocomposites leading to an increased particle size.10 The micropore volume (Vmic) and mesopore volume (Vmes) of La@Fe/C (in range of 0.011–0.237 cm3 g−1 and 0.041–0.167 cm3 g−1, respectively) are much higher than that of pristine ilmenite (0.00007 and 0.00119 cm3 g−1, respectively), suggesting that large amount of porosities were formed on La@Fe/C during carbothermal reduction of ilmenite.
Table 1 Textural properties of the adsorbentsa
| Adsorbent |
SBET (m2 g−1) |
Vtot (cm3 g−1) |
Vmic (cm3 g−1) |
Vmes (cm3 g−1) |
Dmean (nm) |
qe (mg g−1) |
| SBET, BET surface area; Vtot, total pore volume; Vmes, mesopore volume; Vmic, micropore volume; Dmean, average pore diameter; qe, adsorption capacities toward 10 mg L−1 phosphate; La0.005@Fe/C-A: La0.005@Fe/C after phosphate adsorption. |
| Ilmenite |
0.3 |
0.00147 |
0.00007 |
0.00119 |
30.25 |
0.79 |
| AC |
1590 |
1.437 |
0.237 |
0.965 |
6.02 |
2.73 |
| Fe/C precursor |
270 |
0.241 |
0.039 |
0.164 |
5.67 |
5.61 |
| La0.001@Fe/C |
106 |
0.102 |
0.017 |
0.071 |
6.11 |
7.10 |
| La0.005@Fe/C |
114 |
0.108 |
0.017 |
0.075 |
5.88 |
7.20 |
| La0.06@Fe/C |
115 |
0.113 |
0.011 |
0.089 |
4.89 |
6.43 |
| La0.12@Fe/C |
117 |
0.176 |
0 |
0.167 |
6.78 |
9.99 |
| La0.005@Fe/C-A |
76 |
0.074 |
0.011 |
0.052 |
6.17 |
— |
Table 1 further compares the adsorption performance of the mentioned adsorbents with a concentration of 1 g L−1 tested in 10 mg L−1 phosphate solution. It was obvious that both AC and ilmenite exhibited relatively low phosphate adsorption capacity, with qe value of 2.73 mg g−1 and 0.79 mg g−1, respectively. However, upon carbothermal reduction of ilmenite, the resulting Fe/C precursor exhibited a substantially higher adsorption capacity (i.e., qe = 5.61 mg g−1), which could be attributed to the generation of active sites, i.e., nZVI (Fe0) and Fe2O3, for phosphate removal. It can also be seen that although La0.12@Fe/C has the lowest microporosity, it possesses the highest adsorption capacity toward phosphate, which is possibly linked to the higher lanthanum loading providing more active sites on La0.12@Fe/C for binding phosphate. An interesting point to note is that La0.005@Fe/C (qe = 7.20 mg g−1) showed higher phosphate uptake capacity than La0.06@Fe/C (qe = 6.43 mg g−1), which might be related to the higher microporosity of La0.005@Fe/C (Vmic = 0.017 cm3 g−1) as compared to La0.06@Fe/C (Vmic = 0.011 cm3 g−1). Since the hydrated radius of phosphate species (i.e., H2PO3−, PO43−, and HPO42−) is less than 0.339 nm, micropore was favored for the removal of phosphate.24 Although La0.12@Fe/C exhibited the highest phosphate removal capacity, to minimize the use of La chemicals, La0.005@Fe/C particles was selected for further studies.
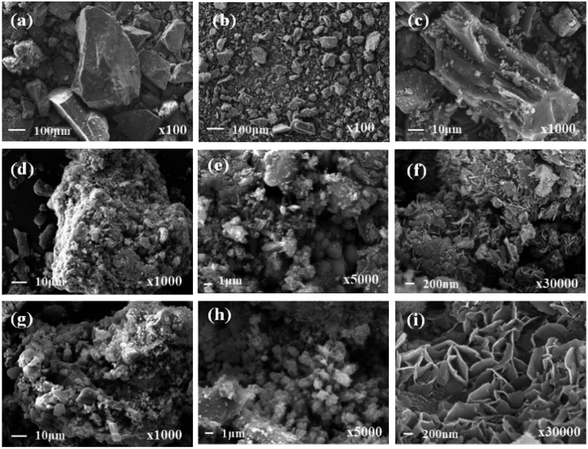
Fig. 1 showed the SEM images for ilmenite, precursor (i.e., Fe/C), and the adsorbent of interest before and after phosphate adsorption (i.e., La0.005@Fe/C and La0.005@Fe/C-A). It can be seen that seldom pores can be observed on the pristine ilmenite, while the Fe/C precursor exhibited a porous structure with flower-like morphology (Fig. 1d–f). Further loading of La did not destruct the 3D flower-like morphology (Fig. 1g–i). Such morphologies with submicron level pore sizes are favorable for adsorption purposes. Fig. 1g–i demonstrate that La0.005@Fe/C-A could maintain its 3D flower-like structure after phosphate adsorption. The nm-sized lamellar structure found on the La0.005@Fe/C-A can be ascribed to the formation of insoluble lanthanum–phosphate complex and iron–phosphate complex on the surface of La0.005@Fe/C. The porous morphology of La0.005@Fe/C did not undergo a significant change upon phosphate adsorption (Fig. 1e vs. Fig. 1h).
 |
| | Fig. 1 SEM for (a) ilmenite, (b, c) Fe/C precursor, (d–f) La0.005@Fe/C, and (g–i) La0.005@Fe/C-A. | |
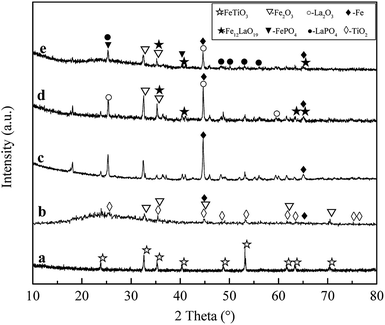
3.1.2 XRD analysis. XRD patterns of ilmenite, Fe/C precursor, magnetic precursor, La0.005@Fe/C and La0.005@Fe/C-A are shown in Fig. 2. The detected peaks on Fig. 2a at 2θ = 23.825°, 32.588°, 35.257°, 40.323°, 48.766°, 53.136°, 61.594°, 63.269° and 70.304° for ilmenite are assigned to FeTiO3 (JCPDS 71-1140).
 |
| | Fig. 2 XRD patterns of (a) ilmenite, (b) Fe/C precursor, (c) magnetic precursor, (d) La0.005@Fe/C, and (e) La0.005@Fe/C-A. | |
New peaks appeared following the microwave radiation treatment, as shown in Fig. 2b–d, which resulted from the carbothermal reduction reactions between ilmenite and activated carbon. As can be seen in Fig. 2b–d, the new peaks at 2θ = 23.802°, 35.305°, 44.504°, 48.532°, 53.420°, 61.694°, 63.539°, 75.037° and 76.628°, and 2θ = 32.802°, 35.193°, 44.879°, 61.751° and 70.236° were corresponding to TiO2 (JCPDS 46-1237) and Fe2O3 (JCPDS 16-0653), respectively.
Furthermore, the characteristic diffraction peaks in Fig. 2d and e at 2θ = 25.328°, 44.634°, 59.955° can be indexed to La2O3 (JCPDS 40-1281). Fe0 was found at 2θ = 44.669° and 65.000° (JCPDS 16-0696) on the XRD patterns of magnetic precursor, which confirmed the formation of nZVI via carbothermal reduction of ilmenite. Moreover, Fe12LaO19 was also detected at 2θ = 35.164°, 40.605°, 55.294° and 56.402° (JCPDS 13-0474), indicating that the La–Fe nanocomposites were also formed during microwave heating. These results are in line with the studies showing that TiO2 and Fe2O3 can be obtained by high-temperature activation of ilmenite.25 TiO2 formed in the adsorbent did not undergo further structural changes, despite the extremely high reaction temperature.26,27 The diffraction peaks of Fe0 were not obvious except for the XRD pattern of the magnetic precursor, which could originate from the small grain size and good dispersion of Fe0 on La0.005@Fe/C.
After adsorbing phosphate, new peaks were observed on La0.005@Fe/C-A (Fig. 2e). The peaks located at 2θ = 25.281° and 40.264° can be ascribed to FePO4 (JCPDS 31-0647) and peaks at 2θ = 25.281°, 48.375°, 51.909°, 53.210° and 56.027° belonged to LaPO4 (JCPDS 04-0635). These detected peaks of FePO4 and LaPO4 on the surface of La0.005@Fe/C-A are indicative of the reactions between phosphate and metal/metal oxides during the adsorption process. Thus, the mechanism between phosphate and metal/metal oxides in La0.005@Fe/C during the adsorption process could be proposed as ion exchange or metal phosphate precipitation process as shown in eqn (12).
| | |
La3+ + Fe3+ + 2PO43− → LaPO4↓ + FePO4↓
| (12) |
3.1.3 XPS analysis. XPS was used to analyze the elemental composition and the chemical bond state on the surface of La0.005@Fe/C and La0.005@Fe/C-A. The relative content of elements in adsorbent were: C 62.39 wt%, O 23.54 wt%, Fe 8.08 wt%, La 4.87 wt%, Ti 1.12 wt%. The XPS spectra of magnetic precursor were also analyzed to clarify the status of iron in the composites. As shown in Fig. 3a, the respective binding energies of Ti 2p3/2 and Ti 2p1/2 were found to be 460.5 eV and 466.3 eV for La0.005@Fe/C.
 |
| | Fig. 3 XPS spectra of (a) Ti 2p, (b) Fe 2p, and (c) La 3d patterns for magnetic precursor, La0.005@Fe/C and La0.005@Fe/C-A. | |
After phosphate adsorption, no significant change was observed in the binding energy of Ti on La0.005@Fe/C-A. Moreover, the difference between the binding energies of Ti 2p3/2 and Ti 2p1/2 on the spectra of La0.005@Fe/C and La0.005@Fe/C-A was equal to 5.8 ± 0.1 eV, which might point to the presence of TiO2 on La0.005@Fe/C and La0.005@Fe/C-A.28–30 The fact that TiO2 can still be detected in La0.005@Fe/C-A after phosphate adsorption indicates that TiO2 did not react with phosphorus to form complexes.
The binding energy of Fe 2p3/2 with peaks for Fe(III), Fe(II) and Fe(0) appeared at 713.5–714.1, 711.5–712.0 and 708.2 eV, respectively, and the Fe 2p1/2 peaks for Fe(III) and Fe(II) centered at 725.8–726.0 and 717.0–717.4 eV, respectively.31,32 Thus, the presence of Fe3+, Fe2+ and Fe0 in samples confirmed that FeTiO3 in ilmenite was reduced by C in activated carbon, and the formation of nZVI took place under microwave radiation. Moreover, the binding energy peak of La 3d5/2 at around 838.0 eV and La 3d3/2 at 854.0 eV indicated the existence of La3+ in La2O3,33 which suggests the formation of La2O3 via the calcination of LaCl3 at 673 K. Following phosphate adsorption, slight changes were observed in the binding energies for Fe 2p and La 3d of La0.005@Fe/C as shown in Fig. 3b and c, which suggest that Fe and La were involved in the phosphate removal process. These results were also confirmed by the XRD analysis, whereby FePO4 and LaPO4 could be detected in the spectra of La0.005@Fe/C-A (Fig. 2e).
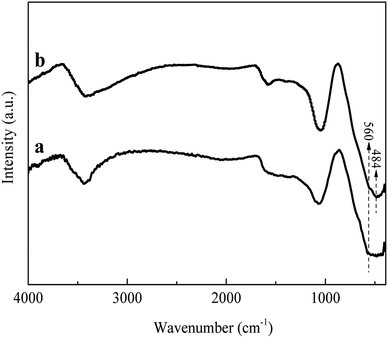
3.1.4 FTIR analysis. Fig. 4 showed the FTIR spectra of La0.005@Fe/C before and after phosphate adsorption. No obvious difference was observed between the bands of La0.005@Fe/C and La0.005@Fe/C-A. Three characteristic bands at 3440 cm−1, 1068 cm−1 and 560 cm−1 were found for both La0.005@Fe/C and La0.005@Fe/C-A. The peak at about 3440 cm−1 can be assigned to the O–H stretching vibration, which was indicative of the presence of hydroxylic, carboxylic, and phenolic groups (including hydrogen bonding) in the coconut AC matrix.34 The peak at 1068 cm−1 was assigned to the asymmetric stretch vibration of P–O, and the peak at 560 cm−1 was related to the vibration of O–P–O.35 It is noteworthy that, the La–O coordination peak vibration was found at 484 cm−1 on La0.005@Fe/C-A, which possibly happened due to the reaction between the La and the oxygen anion in the phosphate molecule.36 Furthermore, the bands at 1068 cm−1 became stronger after adsorbing phosphate, suggesting the existence of PO43− on La0.005@Fe/C-A.37
 |
| | Fig. 4 FTIR spectra of (a) La0.005@Fe/C and (b) La0.005@Fe/C-A. | |
3.2 Batch experiments
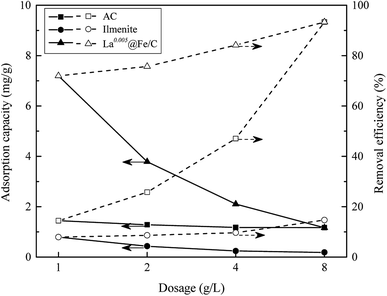
3.2.1 Effect of adsorbent dosage. The effect of adsorbent dosage on phosphate adsorption was studied with adsorbent dosages ranging from 1 to 8 g L−1 in 10 mg L−1 phosphate solution, and the results were shown in Fig. 5. As can be seen, La0.005@Fe/C showed substantially higher phosphate adsorption capacity, in particular at the lower range of adsorbent dosages, when compared to the coconut shell based activated carbon (AC) and ilmenite. This high phosphate adsorption capacity of La0.005@Fe/C can be attributed to the reaction of phosphate with lanthanum and iron located on the surface of the adsorbent, and thus, formation of insoluble phosphate complex, as per shown by the XRD, XPS and FTIR results. The removal efficiency of phosphate by La0.005@Fe/C increased from 72.0% to 93.3% with the increasing dosage of La0.005@Fe/C from 1 g L−1 to 8 g L−1, this was because higher dosage of adsorbents enabled more active sites for phosphate removal. However, the phosphate adsorption amount decreased from 7.20 mg g−1 to 1.17 mg g−1 with the dosage increasing from 1 g L−1 to 8 g L−1, which might possibly stem from the overlapping of available activated sites on the adsorbent. Thus, the dosage of adsorbents with 1 g L−1 was selected for the further phosphate removal experiments.
 |
| | Fig. 5 Influences of different adsorbent dosages on phosphate adsorption and removal efficiency of different adsorbents. | |
3.2.2 Effect of contact time. The effects of contact time on AC, ilmenite and La0.005@Fe/C are presented in Fig. 6. Ilmenite and La0.005@Fe/C showed fast adsorption within the initial 30 min, and then the adsorption process gradually slowed down and reached equilibrium at nearly 90 min, while the equilibrium time for AC was around 120 min. This was because at initial stage, large amount of vacant adsorption sites was available on the surface and internal structure of AC, ilmenite and La0.005@Fe/C. As the adsorption process continued, the active sites on the adsorbents gradually saturated and hardly adsorb phosphate.8 As shown in Table 1, AC, Fe/C precursor, and La0.005@Fe/C presented microporosity in the order of AC > Fe/C precursor > La0.005@Fe/C, whereas the adsorption capacities for the removal of phosphate is in the order of La0.005@Fe/C > Fe/C precursor > AC, which could be due to different chemical properties of these adsorbents. Upon a three-hour-long exposure, La0.005@Fe/C exhibited higher phosphate capacity (7.36 mg g−1) when compared to AC (2.27 mg g−1) and Fe/C precursor (5.71 mg g−1), as shown in Fig. 6 The stronger adsorptive performance of La0.005@Fe/C towards phosphate can be attributable to the more active sites available on the surface of La0.005@Fe/C, as compared to the Fe/C precursor and AC.
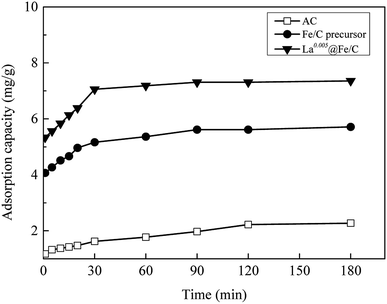 |
| | Fig. 6 Influences of contact time on the phosphate adsorption of AC, Fe/C precursor and La0.005@Fe/C. | |
3.2.3 Effect of pH. Another important factor to be taken into consideration is the pH of the solution, which can affect both the degree of adsorbate ionization and the surface charge of the adsorbent in the solution. The influence of pH on the removal of phosphate by La0.005@Fe/C was investigated at different pH values ranging from 3 to 11, and the results are shown in Fig. 7. It can be seen that a pH increases from 3 to 7 yielded a higher uptake of phosphate, whereby the maximum phosphate adsorption amount was achieved at pH = 7. It was reported that within the pH range of 3–8, H2PO4− is the dominant phosphate species in the solution.6 Since the zero point of charge (pHpzc) of La0.005@Fe/C is 7.45, a pH value lower than 7.45 causes the surface of La0.005@Fe/C to become positively charged, which further favors the electrostatic interaction and ion exchange with H2PO4−. As the pH value increased further from 7 to 11, the adsorption capacity decreased from 7.28 mg g−1 to 6.70 mg g−1. This was mainly caused by the fact that alkaline pH generates repulsive electrostatic forces, weakening the active adsorption sites for ion exchange due to the high concentration of OH− in the solution.38
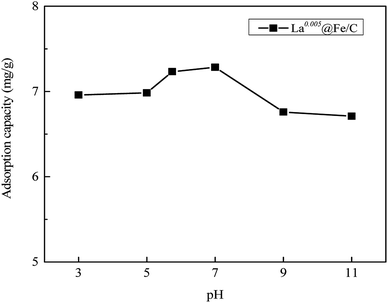 |
| | Fig. 7 Influences of pH on phosphate adsorption by La0.005@Fe/C. | |
3.3 Adsorption mechanism
3.3.1 Adsorption kinetics. The kinetic modeling were fitted to the pseudo-first-order, pseudo-second-order model and intra-particle diffusion. Results (see Fig. 8 and Table 2) showed that the experimental kinetic data can be best described by pseudo-second-order model with R2 for AC, precursor and La0.005@Fe/C were 0.9908, 0.9996 and 0.9998, respectively. The calculated qe values (qe,cal = 2.32, 5.74, 7.44 mg g−1 for AC, precursor and La0.005@Fe/C, respectively) were in well agreement with the experimental values (qe,exp = 2.27, 5.71, 7.36 mg g−1 for AC, precursor and La0.005@Fe/C, respectively). These results confirmed that the phosphate adsorption process might be controlled by the chemisorption process.39 For a better understanding of the adsorption mechanism, intra-particle-diffusion model was further applied to fit the experimental data. As can be seen from Fig. 8, the adsorption kinetics curve of intra-particle-diffusion model can be divided into two major phases, the first phase showed a higher rate constant Kid1 of La0.005@Fe/C, which indicated a higher removal rate in the beginning due to the large available surface area and high amount of active sites on the external surface.17 The lower use of Kid2 could be related to the smaller amount of adsorption sites on the adsorbent, limiting the intra particle diffusion. It is noteworthy that the plot did not pass through the origin, which suggests that intra-particle-diffusion was not the key step to control the adsorption process. Some other mechanisms such as initial external mass transfer may also be involved in the phosphate adsorption process.40
 |
| | Fig. 8 Kinetic modeling of: (a) pseudo-first-order model, (b) pseudo-second-order model, and (c) intra-particle diffusion model for phosphate adsorption on the adsorbents. | |
Table 2 Kinetic parameters for removal of phosphate by AC, Fe/C precursor and La0.005@Fe/C
| Parameters |
Adsorbent |
| AC |
Fe/C precursor |
La0.005@Fe/C |
| Experimental result |
qe,exp (mg g−1) |
2.27 |
5.71 |
7.36 |
| Pseudo-first-order |
qe,cal (mg g−1) |
1.23 |
1.45 |
1.75 |
| k1 (min−1) |
0.02 |
0.03 |
0.03 |
| R2 |
0.8858 |
0.9557 |
0.9287 |
| Pseudo-second-order |
qe,cal (mg g−1) |
2.32 |
5.74 |
7.44 |
| k2 (g (mg min)−1) |
0.05 |
0.06 |
0.06 |
| R2 |
0.9908 |
0.9996 |
0.9998 |
| Intra-particle diffusion |
Kid1 (mg (g−1 min−1/2)) |
0.08 |
0.25 |
0.30 |
| C1 |
1.11 |
3.76 |
4.96 |
| R12 |
0.9679 |
0.9488 |
0.9537 |
| Kid2 (mg (g−1 min−1/2)) |
0.09 |
0.07 |
0.04 |
| C2 |
1.13 |
4.83 |
6.88 |
| R22 |
0.9214 |
0.8680 |
0.8531 |
3.3.2 Adsorption isotherms. The equilibrium data were fitted to the Langmuir, Freundlich and Temkin isotherm models (Fig. 9), and the adsorption constants were presented in Table 3. The adsorption of phosphate onto La0.005@Fe/C fitted best to Langmuir model (R2 = 0.9980), suggesting that the adsorption of phosphate on La0.005@Fe/C was based on monolayer homogeneous adsorption process. It could be seen from Table 3 that the qe of La0.005@Fe/C calculated from the Langmuir model increased from 32.16 mg g−1 at 293 K to 39.90 mg g−1 at 323 K, indicating that the adsorption of phosphate onto La0.005@Fe/C was an endothermic process.41 The value of kL, calculated from Langmuir isotherm was 0.08–0.10, suggesting a favorable adsorption of phosphate on La0.005@Fe/C. In addition, the value of n calculated from Freundlich model is 1.88, pointing to a chemically favorable and heterogeneous adsorption of phosphate onto La0.005@Fe/C.42 The Temkin constant b was related to the heat of adsorption, and its values were positive for all temperatures (b = 321.84 J mol−1 at 293 K), which also confirms the fact that adsorption of phosphate onto La0.005@Fe/C was endothermic process.43
Table 3 Isotherm parameters for the adsorption of phosphate by La0.005@Fe/C
| T (K) |
qe,exp (mg g−1) |
Langmuir |
Freundlich |
Temkin |
| qe,cal (mg g−1) |
kL (L mg−1) |
R2 |
n |
kF |
R2 |
AT |
b (J mol−1) |
R2 |
| 293 |
32.16 |
32.36 |
0.10 |
0.9980 |
1.88 |
4.54 |
0.9384 |
1.16 |
321.84 |
0.9725 |
| 303 |
34.91 |
34.94 |
0.09 |
0.9988 |
1.86 |
4.70 |
0.9534 |
1.15 |
303.42 |
0.9767 |
| 313 |
36.90 |
36.92 |
0.09 |
0.9981 |
1.83 |
4.86 |
0.9606 |
1.16 |
288.67 |
0.9718 |
| 323 |
39.90 |
39.82 |
0.08 |
0.9979 |
1.76 |
4.90 |
0.9635 |
1.10 |
264.06 |
0.9697 |
 |
| | Fig. 9 Isotherm modeling of (a) Langmuir, (b) Freundlich, and (c) Temkin adsorption isotherms for phosphate adsorption on La0.005@Fe/C. | |
3.3.3 Thermodynamic analysis. Thermodynamic parameters for phosphate adsorption onto La0.005@Fe/C were evaluated at 293 K, 303 K, 313 K and 323 K using eqn (10) and (11). The positive value of ΔH0 (3.40 kJ mol−1) indicates that phosphate adsorption onto La0.005@Fe/C is an endothermic process, while the negative values of ΔG0 (−2.44 kJ mol−1, −2.64 kJ mol−1, −2.84 kJ mol−1, and −3.04 kJ mol−1) at temperature of 293 K, 303 K, 313 K and 323 K, respectively, indicated the phosphate adsorption occurs spontaneously.44 The positive value ΔS0 (0.02 kJ mol−1 K−1) showed the affinity of La0.005@Fe/C for adsorbing phosphate and the increasing randomness at the solid-solution interface with some structural changes in the adsorbates and adsorbents during the adsorption process.45
3.4 Influence of coexisting ion
The influence of coexisting ions in waste water such as NO3−, Cl−, CO32−, SO42− and Ca2+ (ref. 46) on phosphate (10 mg L−1) adsorption was investigated, and the results are presented in Fig. 10. It can be observed from Fig. 10 that high concentration (500 mg L−1) of anion Cl− and cation Ca2+ hardly affected the removal of phosphate, whereas the presence of NO3−, CO32− and SO42− resulted in slightly decreased phosphate removal, leading to a decreased phosphate removal from 73.08% to 55.86%, 53.62% and 62.85%, respectively. This slight decrement of phosphate adsorption capacity in the presence of coexisting anions could stem from the fact that anions can act as a competition ion, inducing electrostatic repulsion between the deprotonated surface hydroxyls and the highly charged PO43−. The reduction of phosphate adsorption in the presence of CO32− was relatively more obvious, which might be due to the formation of La2(CO3)3, for it has a lower KSP (3.98 × 10⁻³⁴) than LaPO4 (3.70 × 10⁻²³).54 It can be noticed that the removal of phosphate was effective (>53.62% removal efficiency) even in the presence of coexisting ions with 50-fold excess, indicating La0.005@Fe/C had a high adsorption selectivity towards phosphate.
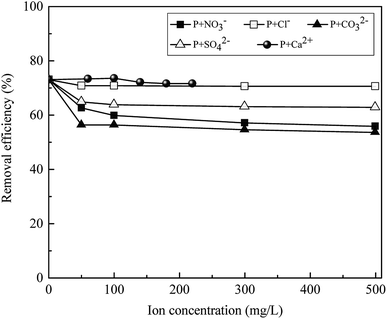 |
| | Fig. 10 The effect of NO3−, Cl−, CO32−, SO42− and Ca2+ on phosphate adsorption of La0.005@Fe/C. | |
3.5 The stability and reusability of La0.005@Fe/C
To assess the reusability of La0.005@Fe/C, a series of experiments have been devised, whereby the adsorbent is exposed to thermal regeneration and five cycles of repeated adsorption and regeneration. The performance of the reused La0.005@Fe/C with respect to the adsorptive removal of phosphate is shown in Fig. 11. A gradual decrease from 7.20 mg g−1 to 4.20 mg g−1 was observed in the phosphate removal capacity, which corresponds to a capacity retention of 58.33% after five cycles. Nonetheless, the adsorbent exhibited higher stability than the previously reported phosphate adsorbents, i.e., La(OH)3/Fe3O4 (4![[thin space (1/6-em)]](https://www.rsc.org/images/entities/char_2009.gif) :
:![[thin space (1/6-em)]](https://www.rsc.org/images/entities/char_2009.gif) 1) nanocomposite, and La based FeCl3/LSF (lithium silica fume).10,55 Therefore, the La@Fe/C particle in this work is considered as a promising phosphate adsorbent with high stability and removal efficiency.
1) nanocomposite, and La based FeCl3/LSF (lithium silica fume).10,55 Therefore, the La@Fe/C particle in this work is considered as a promising phosphate adsorbent with high stability and removal efficiency.
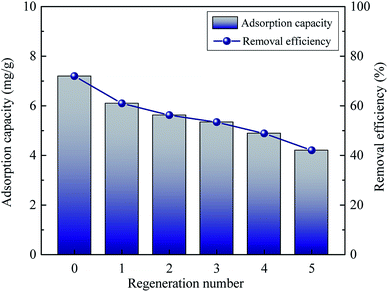 |
| | Fig. 11 Phosphate adsorption capacity and removal efficiency of La0.005@Fe/C as a function of adsorption–regeneration cycles. | |
3.6 Comparison with various adsorbents
Table 4 presented the comparison of theoretical phosphate adsorption capacity of La0.005@Fe/C with various adsorbents based on Langmuir isotherm. It can be seen that the phosphate adsorption capacity of La0.005@Fe/C is relatively higher than the other adsorbents reported in the literature. Similarly, other bi-metallic adsorbents such as Fe–Mn binary oxide and ACF-LaFe reportedly exhibited high phosphate adsorption capacities of 33.20 mg g−1 and 29.44 mg g−1, respectively. These high values are associated with the fact that by coupling two metal species, the adsorbent interface could be engineered to possess multiple sites which then contribute to binding phosphate.56
Table 4 Comparison of phosphate adsorption capacity of various adsorbents
| Adsorbent |
Temperature (K) |
Adsorption capacity (mg g−1) |
Reference |
| La0.005@Fe/C |
293 |
32.36 |
This work |
| Activated carbon |
298 |
8.70 |
47 |
| Iron oxide tailings |
293 |
8.21 |
48 |
| AC/N–Fe(II) |
298 |
14.12 |
49 |
| AC/N–Fe(III) |
298 |
8.13 |
49 |
| La(III) modified zeolite |
293 |
24.60 |
50 |
| Fe–Mn binary oxide |
298 |
33.20 |
51 |
| Granular ferric hydroxide |
294 |
20.9 |
52 |
| ACF-LaFe |
298 |
29.44 |
8 |
| Fe3O4@La–Ce |
313 |
19.6 |
53 |
| Fe3O4 nanoparticles |
296 |
4.50 |
10 |
| Magnetic Fe3O4@SiO2@La2O3 |
296 |
27.80 |
10 |
4. Conclusions
A novel 3D flower-like La@Fe/C magnetic composite adsorbent was successfully prepared by carbothermal reduction of ilmenite via microwave radiation. The resultant La0.005@Fe/C features active adsorption sites for phosphate uptake even in the presence of 50-fold excess competing ions. The phosphate adsorption on La0.005@Fe/C fitted well to Langmuir mode, with the calculated maximum adsorption capacity of 32.36 mg g−1 at 293 K. Thermodynamic study indicated that the adsorption of phosphate occurs spontaneously and endothermically. Regeneration tests showed the La@Fe/C composite is a potentially attractive adsorbent for the removal of phosphate from aqueous solutions with high efficiency and recycling capability.
Conflicts of interest
There are no conflicts to declare.
Acknowledgements
The authors acknowledge the funding support from the National Natural Science Foundation of China (51808360), China Postdoctoral Science Foundation (2018M640917), Chengdu Science and Technology Department (2019-GH02-00053-HZ). We would also like to thank the support for teacher Wang Dong (SEM analysis) from Analytical & Testing center of Sichuan University.
Notes and references
- X. T. Zhang, W. Wang, S. Y. Dai and F. Y. Cui, RSC Adv., 2018, 8, 11754–11763 RSC.
- L. Paripurnanda, V. Saravanamuthu, K. Jaya and S. B. Nanthi, Crit. Rev. Environ. Sci. Technol., 2014, 44, 847–907 CrossRef.
- B. Hui, Y. Zhang and L. Ye, Chem. Eng. J., 2014, 235, 207–214 CrossRef CAS.
- S. X. Dong, Y. L. Wang, Y. W. Zhao, X. H. Zhou and H. L. Zheng, Water Res., 2017, 126, 433–441 CrossRef CAS PubMed.
- L. E. De-Bashan and Y. Bashan, Water Res., 2004, 38, 4222–4246 CrossRef CAS PubMed.
- R. Z. Xie, Y. Chen, T. Cheng, Y. G. Lai, W. J. Jiang and Z. S. Yang, Water Sci. Technol., 2016, 73, 1891–1900 CrossRef CAS PubMed.
- J. Yang, L. Zhou, L. Z. Zhao, H. W. Zhang, J. N. Yin, G. F. Wei, K. Qian, Y. H. Wang and C. Z. Yu, J. Mater. Chem., 2011, 21, 2489–2494 RSC.
- J. Liu, Q. Zhou, J. Chen, L. Zhang and N. Chang, Chem. Eng. J., 2013, 215–216, 859–867 CrossRef CAS.
- Z. Wang, Y. Fan, Y. W. Li, F. R. Qu, D. Y. Wu and H. N. Kong, Microporous Mesoporous Mater., 2016, 222, 226–234 CrossRef CAS.
- B. L. Wu, L. P. Fang, J. D. Fortner, X. H. Guan and I. M. C. Lo, Water Res., 2017, 126, 179–188 CrossRef CAS PubMed.
- J. C. Liu, I. Warmadewanthi and C. Chang, Colloids Surf., A, 2009, 347, 215–219 CrossRef CAS.
- X. Jiang, Y. H. Guo, L. B. Zhang, W. J. Jiang and R. Z. Xie, Chem. Eng. J., 2018, 341, 392–401 CrossRef CAS.
- M. J. Lehtinen, in Mineral Deposits of Finland, ed. W. D. Maier, R. Lahtinen and H. O'Brien, Elsevier, 2015, pp. 685–710, DOI:10.1016/B978-0-12-410438-9.00026-1.
- L. Lai, Q. Xie, L. N. Chi, W. Gu and D. Y. Wu, J. Colloid Interface Sci., 2016, 465, 76 CrossRef CAS PubMed.
- S. Lagergren, K. Sven. Vetenskapsakad. Handl., 1989, 24, 1–39 Search PubMed.
- R. Z. Xie, H. Wang, Y. Chen and W. J. Jiang, Environ. Prog. Sustainable Energy, 2013, 32, 688–696 CrossRef CAS.
- H. Wang, R. Z. Xie, J. Zhang and J. Zhao, Adv. Powder Technol., 2017, 29, 27–35 CrossRef.
- J. W. McBain, J. Phys. Chem., 1934, 39, 1162 CrossRef.
- I. Langmuir, J. Chem. Phys., 2015, 40, 1361–1403 Search PubMed.
- X. B. Luo, W. Xing, R. Zhong, X. Y. Min, X. Xiao and J. M. Luo, Ind. Eng. Chem. Res., 2017, 56, 9419–9428 CrossRef CAS.
- X. B. Luo, K. Zhang, J. M. Luo, S. L. Luo and J. Crittenden, Environ. Sci. Technol., 2016, 50, 13002–13012 CrossRef CAS PubMed.
- S. Moharami and M. Jalali, Chem. Eng. J., 2013, 223, 328–339 CrossRef CAS.
- Z. P. Wen, Y. L. Zhang, C. M. Dai, B. Chen, S. J. Guo, H. Yu and D. L. Wu, Microporous Mesoporous Mater., 2014, 200, 235–244 CrossRef CAS.
- B. Tansel, J. Sager, T. Rector, J. Garland, R. F. Strayer, L. Levine, M. Roberts, M. Hummerick and J. Bauer, Sep. Purif. Technol., 2006, 51, 40–47 CrossRef CAS.
- P. C. Wang, X. Jiang, C. J. Zhang, Q. Y. Zhou, J. J. Li and W. J. Jiang, Energy Fuels, 2017, 31, 5266–5274 CrossRef CAS.
- N. J. Welham, Metall. Mater. Trans. A, 2000, 31, 283–289 CrossRef.
- C. J. Zhang, D. N. Yang, X. Jiang and W. J. Jiang, Environ. Technol., 2015, 37, 1895–1905 CrossRef PubMed.
- M. Murata, K. Wakino and S. Ikeda, J. Electron Spectrosc. Relat. Phenom., 1975, 6, 459–464 CrossRef CAS.
- G. C. Bond and S. Flamerz, Appl. Catal., 1989, 46, 89–102 CrossRef CAS.
- I. Georgiadou, N. Spanos, C. Papadopoulou, H. Matralis, C. Kordulis and A. Lycourghiotis, Colloids Surf., A, 1995, 98, 155–165 CrossRef CAS.
- J. Leveneur, G. I. N. Waterhouse, J. Kennedy, J. B. Metson and D. R. G. Mitchell, J. Phys. Chem. C, 2011, 115, 20978–20985 CrossRef CAS.
- X. Gao, S. Liu, Y. Zhang, Z. Luo and K. Cen, J. Hazard. Mater., 2011, 188, 58–66 CrossRef CAS PubMed.
- J. Wang, L. Y. Wu, J. Li, D. Tang and G. K. Zhang, J. Alloys Compd., 2018, 753, 422–432 CrossRef CAS.
- Q. S. Liu, Z. Tong, L. Nan, W. Peng and G. Abulikemu, Appl. Surf. Sci., 2010, 256, 3309–3315 CrossRef CAS.
- J. J. He, W. Wang, W. X. Shi and F. Y. Cui, RSC Adv., 2016, 6, 99353–99360 RSC.
- L. Zhang, Q. Zhou, J. Y. Liu, N. Chang, L. H. Wan and J. H. Chen, Chem. Eng. J., 2012, 185–186, 160–167 CrossRef CAS.
- H. R. Nodeh, H. Sereshti, E. Z. Afsharian and N. Nouri, J. Environ. Manage., 2017, 197, 265–274 CrossRef PubMed.
- J. Goscianska, M. Ptaszkowska-Koniarz, M. Frankowski, M. Franus, R. Panek and W. Franus, J. Colloid Interface Sci., 2018, 513, 72–81 CrossRef CAS PubMed.
- M. Kılıç, Ç. Kırbıyık, Ö. Çepelioğullar and A. E. Pütün, Appl. Surf. Sci., 2013, 283, 856–862 CrossRef.
- W. Liu, Z. Cai, X. Zhao, T. Wang, F. Li and D. Zhao, Environ. Sci. Technol., 2016, 50, 11174–11183 CrossRef CAS PubMed.
- J. M. Salman, V. Njoku and B. H. Hameed, Chem. Eng. J., 2011, 174, 33–40 CrossRef CAS.
- N. Asanjarani, Desalin. Water Treat., 2015, 53, 430–445 CrossRef.
- S. Mor, K. Chhoden, P. Negi and K. Ravindra, Environ. Nanotechnol. Monit., 2017, 7, 15–23 CrossRef.
- Z. H. Wang, D. K. Shen, F. Shen and T. Y. Li, Chemosphere, 2016, 150, 1–7 CrossRef CAS PubMed.
- F. Nekouei, S. Nekouei, I. Tyagi and V. K. Gupta, J. Mol. Liq., 2015, 201, 124–133 CrossRef CAS.
- D. D. Tang and G. K. Zhang, Chem. Eng. J., 2016, 283, 721–729 CrossRef CAS.
- S. Kilpimaa, H. Runtti, T. Kangas, U. Lassi and T. Kuokkanen, J. Ind. Eng. Chem., 2015, 21, 1354–1364 CrossRef CAS.
- L. Zeng, X. M. Li and J. D. Liu, Water Res., 2004, 38, 1318–1326 CrossRef CAS PubMed.
- Z. F. Wang, E. Nie, J. H. Li, M. Yang, Y. J. Zhao, X. Z. Luo and Z. Zheng, Environ. Sci. Pollut. Res., 2011, 19, 2908–2917 CrossRef PubMed.
- P. Ning, H.-J. Bart, B. Li, X. W. Lu and Y. Zhang, J. Environ. Sci., 2008, 20, 670–674 CrossRef CAS.
- G. Zhang, H. J. Liu, R. P. Liu and J. H. Qu, J. Colloid Interface Sci., 2009, 335, 168–174 CrossRef CAS PubMed.
- P. Suresh Kumar, L. Korving, K. J. Keesman, M. C. M. van Loosdrecht and G.-J. Witkamp, Chem. Eng. J., 2019, 358, 160–169 CrossRef CAS.
- M. Y. Han, J. H. Zhang, Y. Y. Hu and R. P. Han, J. Chem. Eng. Data, 2019, 64, 3641–3651 CrossRef CAS.
- P. Koilraj and K. Sasaki, Chem. Eng. J., 2017, 317, 1059–1068 CrossRef CAS.
- Y. G. Lai, W. J. Jiang, Z. S. Yang, X. P. Hao and R. Z. Xie, Desalin. Water Treat., 2016, 57, 1–12 CrossRef.
- A. L. Mckenzie, C. T. Fishel and R. J. Davis, J. Catal., 1992, 138, 547–561 CrossRef CAS.
Footnote |
| † Electronic supplementary information (ESI) available. See DOI: 10.1039/c9ra05606h |
|
| This journal is © The Royal Society of Chemistry 2019 |
Click here to see how this site uses Cookies. View our privacy policy here.  Open Access Article
 *a
*a
![[thin space (1/6-em)]](https://www.rsc.org/images/entities/char_2009.gif) :
:![[thin space (1/6-em)]](https://www.rsc.org/images/entities/char_2009.gif) mAC = 4
mAC = 4![[thin space (1/6-em)]](https://www.rsc.org/images/entities/char_2009.gif) :
:![[thin space (1/6-em)]](https://www.rsc.org/images/entities/char_2009.gif) 1 was then activated at 600 W for 10 min in the microwave oven under N2 atmosphere. The resultant particles were designated as Fe/C precursor, and the magnetic particles separated from Fe/C precursor using magnet were named as magnetic precursor. For the fabrication of lanthanum-loaded Fe/C composites, 100 mL certain concentration LaCl3 solution was added to 2 g of Fe/C precursor, and then 0.1 mol L−1 NaOH solution was introduced dropwise until the final pH reached 10.0. The final mixture was stirred at 333 K for 1 h.14 Thereafter, the slurry was dried at 378 K, followed by activation at 300 W for 2 min in the microwave oven under N2 atmosphere. Upon cooling to room temperature, the samples were crushed and sieved through a 200-mesh screen for adsorption tests. The sample produced with impregnated lanthanum was labeled as Lax@Fe/C, where x refers to the impregnating concentration of La. The sample Lax@Fe/C after phosphate adsorption was named Lax@Fe/C-A.
1 was then activated at 600 W for 10 min in the microwave oven under N2 atmosphere. The resultant particles were designated as Fe/C precursor, and the magnetic particles separated from Fe/C precursor using magnet were named as magnetic precursor. For the fabrication of lanthanum-loaded Fe/C composites, 100 mL certain concentration LaCl3 solution was added to 2 g of Fe/C precursor, and then 0.1 mol L−1 NaOH solution was introduced dropwise until the final pH reached 10.0. The final mixture was stirred at 333 K for 1 h.14 Thereafter, the slurry was dried at 378 K, followed by activation at 300 W for 2 min in the microwave oven under N2 atmosphere. Upon cooling to room temperature, the samples were crushed and sieved through a 200-mesh screen for adsorption tests. The sample produced with impregnated lanthanum was labeled as Lax@Fe/C, where x refers to the impregnating concentration of La. The sample Lax@Fe/C after phosphate adsorption was named Lax@Fe/C-A.


![[thin space (1/6-em)]](https://www.rsc.org/images/entities/char_2009.gif) qe − k1t
qe − k1t


![[thin space (1/6-em)]](https://www.rsc.org/images/entities/char_2009.gif) ln
ln![[thin space (1/6-em)]](https://www.rsc.org/images/entities/char_2009.gif) AT + BT
AT + BT![[thin space (1/6-em)]](https://www.rsc.org/images/entities/char_2009.gif) ln(Ce)
ln(Ce)

![[thin space (1/6-em)]](https://www.rsc.org/images/entities/char_2009.gif) ln
ln![[thin space (1/6-em)]](https://www.rsc.org/images/entities/char_2009.gif) kd
kd


![[thin space (1/6-em)]](https://www.rsc.org/images/entities/char_2009.gif) :
:![[thin space (1/6-em)]](https://www.rsc.org/images/entities/char_2009.gif) 1) nanocomposite, and La based FeCl3/LSF (lithium silica fume).10,55 Therefore, the La@Fe/C particle in this work is considered as a promising phosphate adsorbent with high stability and removal efficiency.
1) nanocomposite, and La based FeCl3/LSF (lithium silica fume).10,55 Therefore, the La@Fe/C particle in this work is considered as a promising phosphate adsorbent with high stability and removal efficiency.


